Sive Morten
Special Consultant to the FPA
- Messages
- 18,654
JPY/USD Daily Update, Tue 07, September
Good Morning,
Before proceeding with update, please, reread daily and 4-hour analysis above.
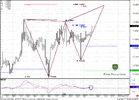
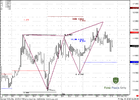
As you remember, 120.50 area is a strong resistance just above the market, that includes daily 161.8% expansion target, 4-hour 1.27 Butterfly target and 4-hour 100% expansion target. So,
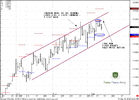
As i've said, if 4- hour trend will turn bullish and market will hold above pivot points - we can possess ourselves on the long side of JPY/USD with target 120.50.
That has happened - look at 4-hour chart. Market also has reached 61.8% expansion target and can show some retracement to the downside, that can be used for Long entering.
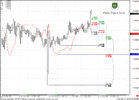
Personally, I would like to see not deep retracement -118.92 Confluence support area (look at hourly chart). So, that hourly trend will remain bullish.
For now it's impossible to say, how deep this retracement can be. The main condition - market has to stay above weekly pivot. If it move below it then something is wrong.
Good Morning,
Before proceeding with update, please, reread daily and 4-hour analysis above.
As you remember, 120.50 area is a strong resistance just above the market, that includes daily 161.8% expansion target, 4-hour 1.27 Butterfly target and 4-hour 100% expansion target. So,
As i've said, if 4- hour trend will turn bullish and market will hold above pivot points - we can possess ourselves on the long side of JPY/USD with target 120.50.
That has happened - look at 4-hour chart. Market also has reached 61.8% expansion target and can show some retracement to the downside, that can be used for Long entering.
Personally, I would like to see not deep retracement -118.92 Confluence support area (look at hourly chart). So, that hourly trend will remain bullish.
For now it's impossible to say, how deep this retracement can be. The main condition - market has to stay above weekly pivot. If it move below it then something is wrong.