NPBFX - making money with us since 1996!

EUR/USD: wave analysis 10.05.2018

Good afternoon, dear forum visitors!

NPBFX offers the latest release of analytics on the EUR/USD for a better understanding of the current market situation and more efficient trading.

Current trend

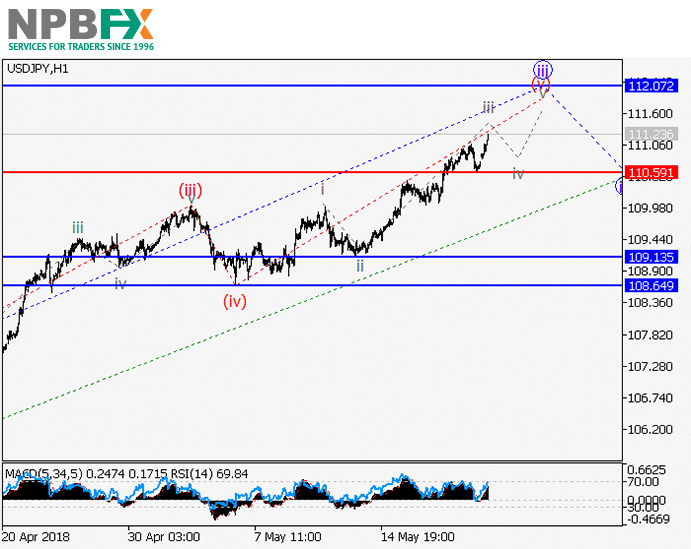
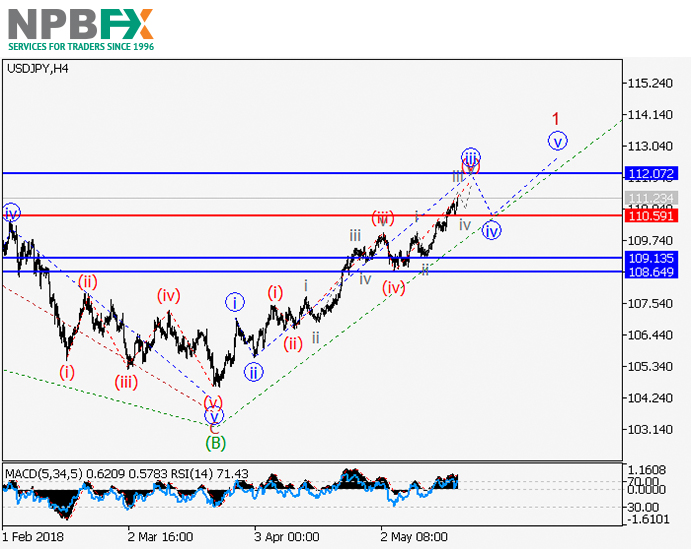
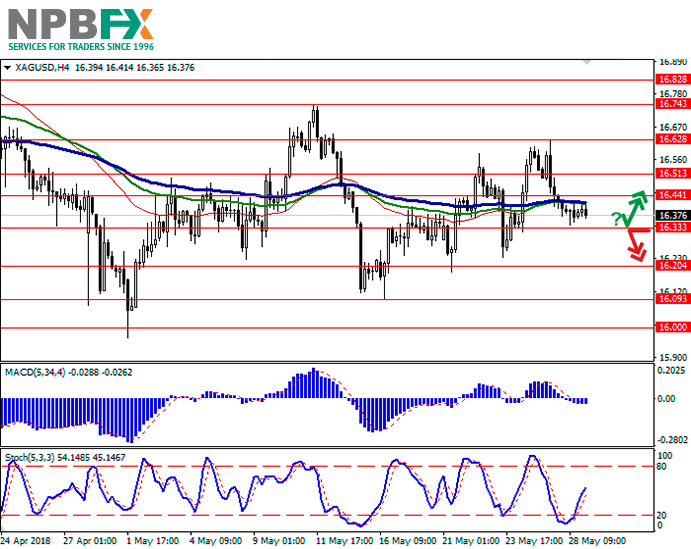
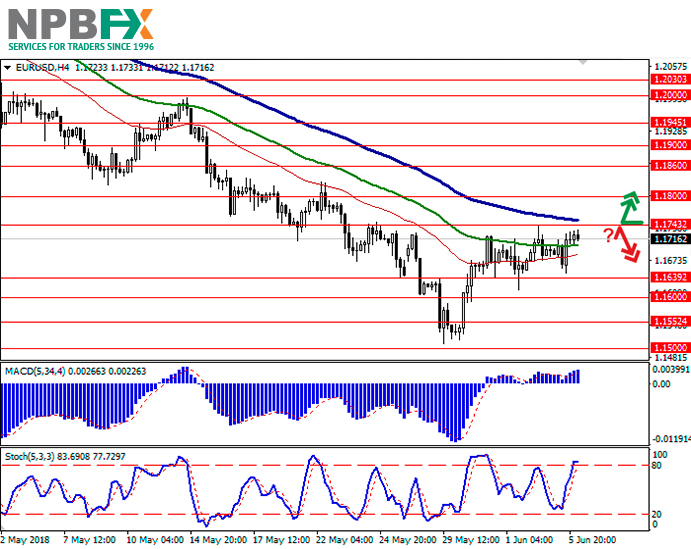
The pair can grow within the correction.

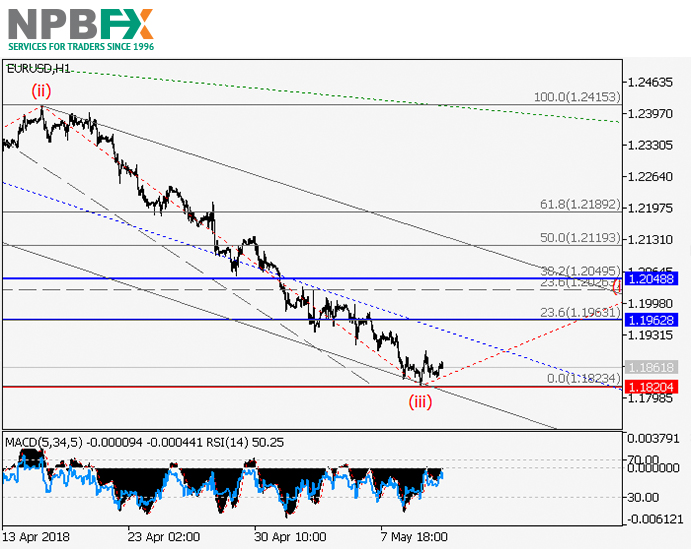
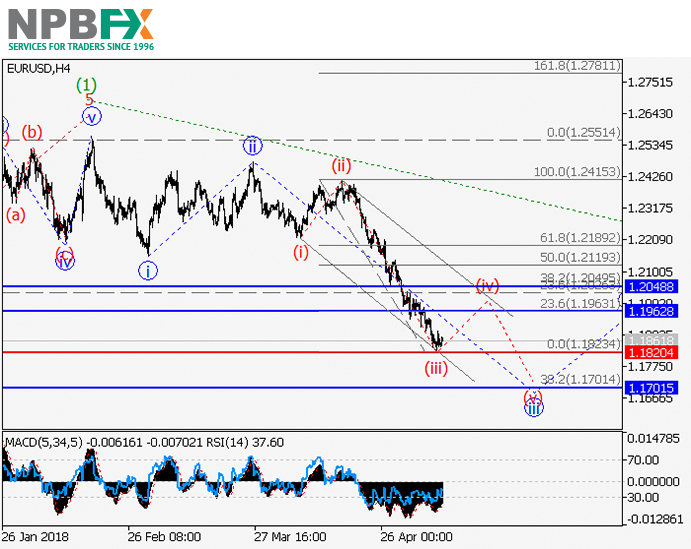
On the 4-hour chart, the downward correction of the higher level is forming as a wave (2), within which the wave A of (2) is developing. Now the third wave of the lower level iii of A is forming, within which the wave (iii) of iii has ended. If the assumption is correct, the pair will grow to the levels of 1.1962–1.2048. The level of 1.1820 is critical and stop-loss for this scenario.

101.jpg


102.jpg


Main scenario

Long positions will become relevant above the level of 1.1820 with the targets at 1.1962–1.2048. Implementation period: 3–5 days.

Alternative scenario

The breakdown and the consolidation of the price below the level of 1.1820 will let the pair go down to the level of 1.1700.

Use more opportunities of the NPBFX analytical portal: economic calendar

Be ready for any market changes through global events using the economic calendar on the NPBFX portal. The calendar contains all the most important events of the world economy and prognoses for them. In order to get free and unlimited access to the economic calendar and other useful instruments on the portal, you need to pass a one-time registration on the NPBFX website.

If you have any questions about trading instruments, you can always ask an analyst in the online chat on the portal and get a free consultation of an experienced specialist.

Use the current recommendations of analysts on EUR/USD and trade efficiently with NPBFX.
 
USD/CHF: wave analysis 14.05.2018

Good afternoon, dear forum visitors!

NPBFX offers the latest release of analytics on the USD/CHF for a better understanding of the current market situation and more efficient trading.

Current trend

The price is in correction and can grow.

On the 4-hour chart, the upward momentum is developing as a first wave of the higher level 1 of (3). Now the third wave of the lower level iii of 1 is forming, within which the local correction (iv) of iii is ending. If the assumption is correct, the pair will grow to the levels of 1.0137–1.0190. The level of 0.9933 is critical and stop-loss for this scenario.

141.jpg


142.jpg


Main scenario

Long positions will become relevant above the level of 0.9933 with the targets at 1.0137–1.0190. Implementation period: 3–5 days.

Alternative scenario

The breakdown and the consolidation of the price below the level of 0.9933 will let the pair go down to the levels of 0.9860–0.9798.

Use more opportunities of the NPBFX analytical portal: trading signals

Make right trade decisions on sell or buy USD/CHF and other popular instruments using trading signals on the NPBFX portal. All registered users have free access to signals from the top 10 trading indicators (MA10, BBands, Ichimoku, Stochastic, ZigZag, etc.) with also general recommendations on the portal.

If you have any questions about trading instruments, you can always ask an analyst in the online chat on the portal and get a free consultation of an experienced specialist.

Use the current recommendations of analysts on USD/CHF and trade efficiently with NPBFX.
 
XAU/USD: wave analysis 16.05.2018

Good afternoon, dear forum visitors!

NPBFX offers the latest release of analytics on the XAU/USD for a better understanding of the current market situation and more efficient trading.

Current trend

The price can fall.

On the daily chart, the wave (C) of the higher level is developing, within which the first wave 1 of (C) is forming. Now the third wave of the lower level iii of 1 is developing. If the assumption is correct, the price will fall to the levels of 1233.90–1203.08. The level of 1325.63 is critical and stop-loss for this scenario.

161.jpg


162.jpg


Main scenario

Short positions will become relevant during the correction, below the level of 1325.63 with the targets at 1233.90–1203.08. Implementation period: 7–10 days.

Alternative scenario

The breakout and the consolidation of the price above the level of 1325.63 will let the price grow to the level of 1365.30.

Use more opportunities of the NPBFX analytical portal: glossary

Beginning traders certainly face a lot of specialized concepts and lexicon on FOREX, which are often not fully been understood. Swap, tick, hedge, margin calls are often unfamiliar to beginning traders. But the lack of knowledge of these fundamentals make a competent market vision impossible. So glossary on the NPBFX analytical portal could be an excellent helper in this case, which contains all the main definitions with explanations in a compact and accessible form. All concepts are arranged in alphabetical order, so that you can easily and quickly find and explore a new concept for yourself.

If you have any questions about trading instruments, you can always ask an analyst in the online chat on the portal and get a free consultation of an experienced specialist.

Use the current recommendations of analysts on XAU/USD and trade efficiently with NPBFX.
 
USD/JPY: wave analysis 21.05.2018

Good afternoon, dear forum visitors!

NPBFX offers the latest release of analytics on the USD/JPY for a better understanding of the current market situation and more efficient trading.

Current trend

The trend is upward.

On the 4-hour chart, the upward momentum is forming as a first wave 1 of (C) of the higher level. Now the third wave of the lower level iii of 1 is developing, within which the development of the wave (v) of iii continues. If the assumption is correct, the pair will grow to the level of 112.07. The level of 110.59 is critical and stop-loss for this scenario.

211.jpg


212.jpg


Main scenario

Long positions will become relevant during the correction, above the level of 110.59 with the target at 112.07. Implementation period: 5–7 days.

Alternative scenario

The breakdown and the consolidation of the price below the level of 110.59 will let the pair go down to the levels of 109.13–108.64.

Use more opportunities of the NPBFX analytical portal: E-book

If you just recently started to be interested in trading on FOREX and would like to deepen your knowledge, an electronic Beginner's Guide to FOREX Trading will be an excellent helper for you here. The book consists of 5 chapters and reflects fundamental concepts of the foreign exchange market to start successful trading. From the main chapters of the E-book you can learn about the concepts and history of FOREX, currencies and trend lines, technical indicators, types of orders, trading on news, psychology of trading, risk management and much more.

You can read a Beginner's guide to FOREX Trading online or download it free of charge from the NPBFX analytical portal in the "Education" section. In order to get unlimited access to the E-book and other useful instruments on the portal, you need to register on the NPBFX website.

If you have any questions about trading instruments, you can always ask an analyst in the online chat on the portal and get a free consultation of an experienced specialist.

Use the current recommendations of analysts on USD/JPY and trade efficiently with NPBFX.
 
NZD/USD: New Zealand dollar is falling 23.05.2018

Good afternoon, dear forum visitors!

NPBFX offers the latest release of analytics on the NZD/USD for a better understanding of the current market situation and more efficient trading.

Current trend

NZD fall against the US dollar, balancing the growth of the end of last week when the instrument stepped off the December lows.

The investors are still focused on the US-China trade relations. On Tuesday, the concrete steps of the parties to ease tension were revealed. Since July 1, China is going to rapidly reduce import fees on American cars and spare parts. Taxes for cars will be reduced from 25% to 15%, and for spare parts – from 10% to 6%. America, according to The Wall Street Journal, is ready to cancel restrictions on the supply of ZTE smartphones but the company will probably have to change the management structure and pay a number of fines.

On Wednesday, investors are waiting for FOMC Minutes release. The report can show the further actions of the regulator. Traders expect if there will be three or four, as the head of the Fed, Jerome Powell, earlier hinted.

Support and resistance

On the daily chart, Bollinger bands decrease. The price range narrows, reflecting the flat trading in the short term. MACD grows, keeping a weak buy signal (the histogram is above the signal line). The indicator reacts slowly to the “bearish” dynamics. Stochastic reversed downwards, but a correctional fall in the short term is possible.

It is better to wait for the clear signal.

Resistance levels: 0.6935, 0.6973, 0.7000, 0.7051.

Support levels: 0.6880, 0.6850, 0.6800.

231.jpg


232.jpg


Trading tips

Long positions can be opened after the rebound from the level of 0.6880 and breakout of 0.6900 with the targets at 0.6973 or 0.7000 and stop loss 0.6860.

Short positions can be opened after the breakdown of the level of 0.6880 with the targets at 0.6830-0.6800 and stop loss 0.6920.

Implementation period: 2–3 days.

Use more opportunities of the NPBFX analytical portal: economic calendar

Be ready for any market changes through global events using the economic calendar on the NPBFX portal. The calendar contains all the most important events of the world economy and prognoses for them. In order to get free and unlimited access to the economic calendar and other useful instruments on the portal, you need to pass a one-time registration on the NPBFX website.

If you have any questions about trading instruments, you can always ask an analyst in the online chat on the portal and get a free consultation of an experienced specialist.

Use the current recommendations of analysts on NZD/USD and trade efficiently with NPBFX.
 
XAG/USD: silver prices are going down 29.05.2018

Good afternoon, dear forum visitors!

NPBFX offers the latest release of analytics on the XAG/USD for a better understanding of the current market situation and more efficient trading.

Current trend

Prices for silver slightly decreased on Monday, continuing the development of the "bearish" trend of last Friday, when the instrument retreated from its two-week highs. Trading activity remained low yesterday, as markets in the US were closed on the occasion of Memorial Day.

Investors are waiting for US and EU trade negotiations and US employment market data, which determines Fed’s interest rate greatly. The unemployment rate is expected to stay around 3.9%, as employment statistics will grow from 164K to 185K, which reflects positive trends in the US economy. EU-US trade negotiations are complicated. On June 1, 25% tax on steel and aluminum, supplied to the US from EU, will be implied.

Support and resistance

Bollinger Bands in D1 chart demonstrate flat dynamics. The price range is narrowing from above, reflecting low trading activity of recent days.

MACD indicator is extending horizontally near the zero mark, characterizing flat trades in the short and ultra-short term. At the same time, the indicator still keeps a weak sell signal.

Stochastic is showing slightly more stable dynamics and is going down quickly locating in the middle of its area.

Technical indicators do not contradict the further development of the "bearish" trend in the short or ultra-short term.

Resistance levels: 16.44, 16.51, 16.62, 16.74.

Support levels: 16.33, 16.20, 16.09, 16.00.

291.jpg


292.jpg


Trading tips

Long positions may be opened if the instrument rebounds from the level of 16.33 followed by the breakout of 16.44 mark. Take-profit — 16.56 or 16.60, 16.62. Stop-loss — 16.35.

A breakdown of the level of 16.33 may be a signal to further sales with targets at 16.20 or 16.15 marks. Stop-loss — 16.43.

Implementation period: 2-3 days.

Use more opportunities of the NPBFX analytical portal: glossary

Beginning traders certainly face a lot of specialized concepts and lexicon on FOREX, which are often not fully been understood. Swap, tick, hedge, margin calls are often unfamiliar to beginning traders. But the lack of knowledge of these fundamentals make a competent market vision impossible. So glossary on the NPBFX analytical portal could be an excellent helper in this case, which contains all the main definitions with explanations in a compact and accessible form. All concepts are arranged in alphabetical order, so that you can easily and quickly find and explore a new concept for yourself.

If you have any questions about trading instruments, you can always ask an analyst in the online chat on the portal and get a free consultation of an experienced specialist.

Use the current recommendations of analysts on XAG/USD and trade efficiently with NPBFX.
 
GBP/USD: wave analysis 31.05.2018

Good afternoon, dear forum visitors!

NPBFX offers the latest release of analytics on the GBP/USD for a better understanding of the current market situation and more efficient trading.

Current trend

The pair can grow.

On the 4-hour chart, the downward correction of the higher level is developing as a wave (2). Locally the wave and of (2) has formed, and the development of the upward correction of the lower level as a wave B of (2) begins. If the assumption is correct, the price will grow to the levels of 1.3472–1.3645. The level of 1.3226 is critical and stop-loss for this scenario.

311.jpg


312.jpg


Main scenario

Long positions will become relevant during the correction, above the level of 1.3226 with the targets at 1.3472–1.3645. Implementation period: 5–7 days.

Alternative scenario

The breakdown and the consolidation of the price below the level of 1.3226 will let the pair go down to the level of 1.3100.

Use more opportunities of the NPBFX analytical portal: analytics

You can find more actual analytical reviews on other popular currency pairs, metals and CFDs on the NPBFX online portal. Daily analytics with charts, current market prognoses and trading scenarios in the Feed section are available. Get free and unlimited access to the online portal after registering on the official website of NPBFX Company.

If you have any questions about trading instruments, you can always ask an analyst in the online chat on the portal and get a free consultation of an experienced specialist.

Use the current recommendations of analysts on GBP/USD and trade efficiently with NPBFX.
 
USD/CAD: the pair is trading flat

Good afternoon, dear forum visitors!

NPBFX offers the latest release of analytics on the USD/CAD for a better understanding of the current market situation and more efficient trading.

Current trend

On Friday, USD grew against CAD, supported by positive US employment market releases. However, it could not consolidate, and by the end of the session, it returned to the morning levels.

Published on Friday, the May data from the US labor market proved to be strong. The number of Nonfarm Payrolls has grown stronger than forecasts from 159K to 223K. The average wage has expectedly increased by 2.7%, and the unemployment rate has dropped to 3.8%. On the one hand, the good state of the labor market helps raise the Fed's interest rate. However, the complication of trade relations with the EU leads to an increase in the uncertainty of the American economy, which means that the regulator may delay the tightening of monetary policy. James Bullard, the head of the FRB of St. Louis, said this on Friday.

Support and resistance

On the daily chart, Bollinger bands are moderately growing. The price range does not change, remaining quite wide for the current activity level. MACD decreases, keeping a weak sell signal (the histogram is below the signal line). Stochastic, after a few days of decline, reversed upwards, reacting to the "bullish" end of the week.

Technical indicators’ readings are controversial, so it is better to wait until the situation is clear.

Resistance levels: 1.2947, 1.3000, 1.3045, 1.3100.

Support levels: 1.2900, 1.2860, 1.2800, 1.2744.

3-1.jpg


4-1.jpg


Trading tips

Long positions can be opened after the breakout of the level of 1.3000 with the target at 1.3100 and stop loss 1.2947.

Short positions can be opened after the breakdown of the level of 1.2900 down with the target at 1.2800 and stop loss 1.2947.

Implementation period: 2–3 days.

Use more opportunities of the NPBFX analytical portal: glossary

Beginning traders certainly face a lot of specialized concepts and lexicon on FOREX, which are often not fully been understood. Swap, tick, hedge, margin calls are often unfamiliar to beginning traders. But the lack of knowledge of these fundamentals make a competent market vision impossible. So glossary on the NPBFX analytical portal could be an excellent helper in this case, which contains all the main definitions with explanations in a compact and accessible form. All concepts are arranged in alphabetical order, so that you can easily and quickly find and explore a new concept for yourself.

If you have any questions about trading instruments, you can always ask an analyst in the online chat on the portal and get a free consultation of an experienced specialist.

Use the current recommendations of analysts on USD/CAD and trade efficiently with NPBFX.
 
EUR/USD: the pair shows mixed trend 06.06.2018

Good afternoon, dear forum visitors!

NPBFX offers the latest release of analytics on the EUR/USD for a better understanding of the current market situation and more efficient trading.

Current trend

Yesterday, EUR traded against USD in a downward direction. Nevertheless, by the end of the afternoon session, EUR managed to win back its losses and enter the green zone.

The European currency is under pressure from weak data on Markit services PMI in Eurozone. In May, the indicator fell from 53.9 to 53.8 points. The indicator for Germany remained at the same level of 52.1 points.

European investors are still focused on Italy. The government crisis is over – Eurosceptics managed to form a government headed by Giuseppe Conte. Now concrete steps are expected from it, which can significantly complicate relations with the European authorities. Recall that "5 stars" and "League" parties are against the EU budget rules and austerity. The coalition's plans include tax cuts, an increase in government spending, and a refusal to raise the retirement age. According to Bloomberg, the implementation of these plans could cost Italy an additional EUR 126 billion and will certainly lead to an increase in Italian public debt.

Support and resistance

On the D1 chart, Bollinger Bands are reversing horizontally. The price range is narrowing, reflecting a mixed nature of trading. MACD indicator is growing keeping a stable buy signal (located above the signal line). Stochastic also grows, but approaches its maximum marks, which indicates EUR being overbought in the ultra-short term.

Resistance levels: 1.1743, 1.1800, 1.1860, 1.1900.

Support levels: 1.1639, 1.1600, 1.1552, 1.1500.

061.jpg


062.jpg


Trading tips

To open long positions one can rely on the breakout of the level of 1.1743, if "bullish" signals prevail. Take-profit — 1.1860 or 1.1900. Stop-loss – 1.1690.

The rebound from resistance level of 1.1743, with the subsequent breakdown of 1.1700 mark, can become a signal to begin correctional sales with targets at 1.1600, 1.1552. Stop-loss — 1.1760.

Implementation period: 2-3 days.

Use more opportunities of the NPBFX analytical portal: E-book

If you just recently started to be interested in trading on FOREX and would like to deepen your knowledge, an electronic Beginner's Guide to FOREX Trading will be an excellent helper for you here. The book consists of 5 chapters and reflects fundamental concepts of the foreign exchange market to start successful trading. From the main chapters of the E-book you can learn about the concepts and history of FOREX, currencies and trend lines, technical indicators, types of orders, trading on news, psychology of trading, risk management and much more.

You can read a Beginner's guide to FOREX Trading online or download it free of charge from the NPBFX analytical portal in the "Education" section. In order to get unlimited access to the E-book and other useful instruments on the portal, you need to register on the NPBFX website.

If you have any questions about trading instruments, you can always ask an analyst in the online chat on the portal and get a free consultation of an experienced specialist.

Use the current recommendations of analysts on EUR/USD and trade efficiently with NPBFX.
 
WTI Crude Oil: oil prices are corrected 11.06.2018

Good afternoon, dear forum visitors!

NPBFX offers the latest release of analytics on the WTI for a better understanding of the current market situation and more efficient trading.

Current trend

As a result of last week, oil prices rose slightly having receded from local lows since April 10. The instrument is moderately supported by the trade relations between the US and China, as well as interruptions in supplies from Venezuela and Iran.

In turn, a rapid decline in consumption of oil and oil products by China pressures the quotes. According to Chinese Customs Statistics, oil imports decreased by 400K barrels to 9.2 million barrels per day. The decline in demand is largely due to the planned maintenance of oil refineries.

Additional pressure on prices is provided by the further growth of oil production in the United States. Last week, according to the Ministry of Energy, oil production rose to 10.8 million barrels per day, which is a new record high.

Support and resistance

Bollinger Bands in D1 chart demonstrate a stable decrease. The price range is narrowing, reflecting the multidirectional nature of trading last days. MACD indicator is trying to reverse upwards and to form a buy signal (the histogram has to consolidate above the signal line). In turn, Stochastic shows almost vertical growth, quickly approaching its maximum marks.

The current showings of the indicators do not contradict the development of the "bullish" trend in the short and ultra-short term. One should keep existing long positions.

Resistance levels: 65.64, 66.04, 67.00, 67.50.

Support levels: 65.00, 64.50, 64.05.

111.jpg


112.jpg


Trading tips

To open long positions, one can rely on the breakout of 66.04 while maintaining the "bullish" signals from the technical indicators. Take-profit — 67.50 or 68.00. Stop-loss – 65.50. Implementation time: 2-3 days.

A confident breakdown of the level of 65.00 may serve as a signal to the return of correctional sales with the target at 64.05. Stop-loss – 65.50. Implementation time: 2 days.

Use more opportunities of the NPBFX analytical portal: trading signals for commodities

How can a trader determine if it’s worth buying or selling WTI now or better waiting for a more favorable period? Use trading signals for commodities from the top 10 technical indicators on the NPBFX portal and make the right decisions! All registered users have free and unlimited access to the minutely updated trading signals (MA10, BBands, Ichimoku, Stochastic, ZigZag, etc.) for Gold, Silver, Brent and WTI Crude oil.

If you have any questions about trading instruments, you can always ask an analyst in the online chat on the portal and get a free consultation of an experienced specialist.

Use the current recommendations of analysts on WTI and trade efficiently with NPBFX.
 
Back
Top