Antony_NPBFX
NPBFX Representative (unconfirmed)
- Messages
- 1,098
AUD/USD: wave analysis 06.08.2018
Good afternoon, dear forum visitors!
NPBFX offers the latest release of analytics on the AUD/USD for a better understanding of the current market situation and more efficient trading.
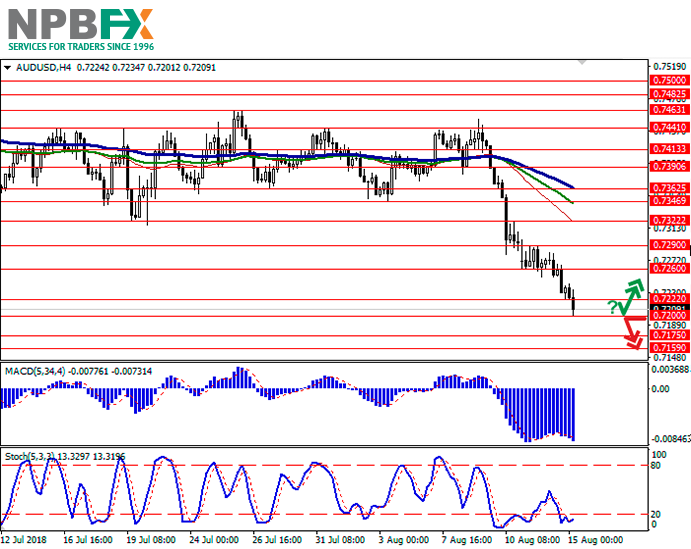
Current trend
The pair can grow.
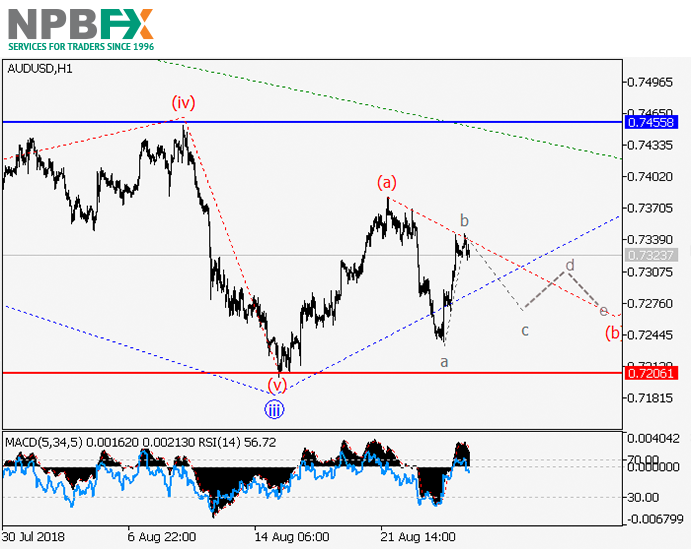
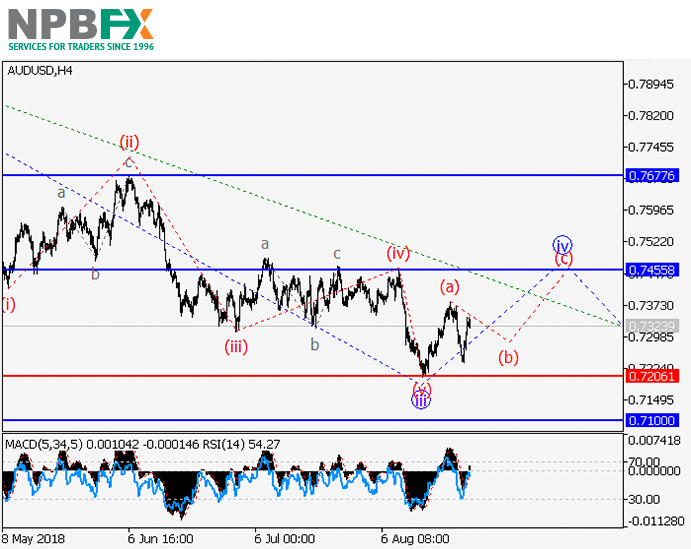
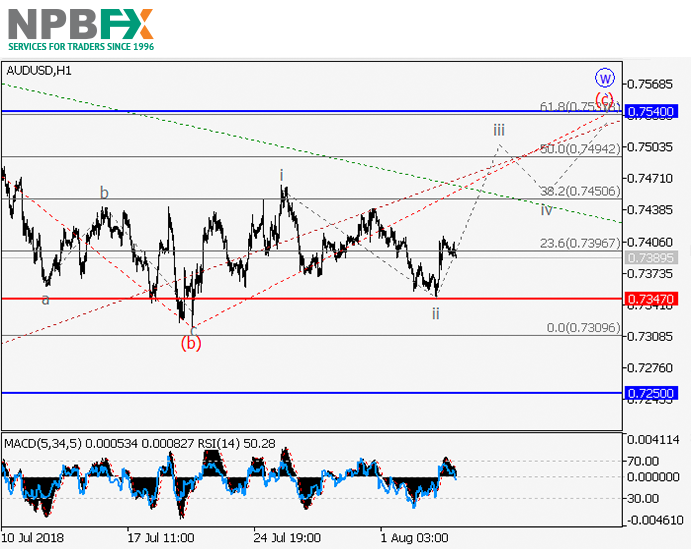
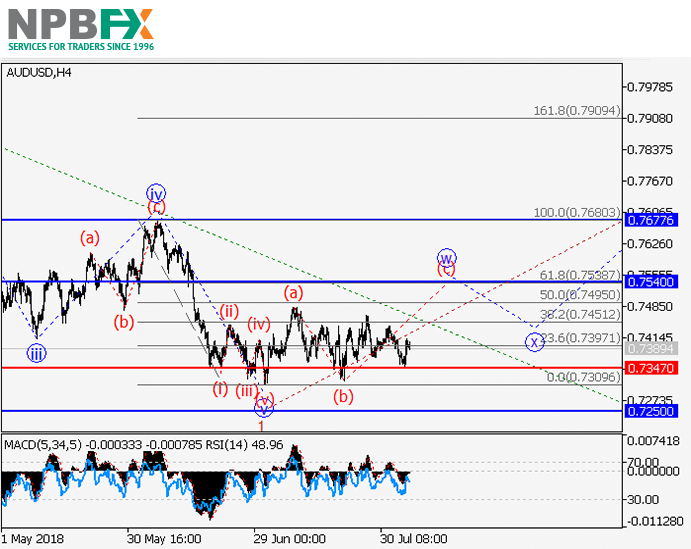
On the 4-hour chart, the upward correction of the higher level is developing as a wave 2 of (5). Now the wave w of 2 is developing as a flat (a)(b)(c), within which the wave (c) of w is forming. If the assumption is correct, the pair will grow to the level of 0.7540. The level of 0.7347 is critical and stop loss for this scenario.
Main scenario
Long positions will become relevant during the correction, above the level of 0.7347 with the target at 0.7540. Implementation period: 7 days and more.
Alternative scenario
The breakdown and the consolidation of the price below the level of 0.7347 will let the pair go down to the level of 0.7250.
Use more opportunities of the NPBFX analytical portal: glossary
Beginning traders certainly face a lot of specialized concepts and lexicon on FOREX, which are often not fully been understood. Swap, tick, hedge, margin calls are often unfamiliar to beginning traders. But the lack of knowledge of these fundamentals make a competent market vision impossible. So glossary on the NPBFX analytical portal could be an excellent helper in this case, which contains all the main definitions with explanations in a compact and accessible form. All concepts are arranged in alphabetical order, so that you can easily and quickly find and explore a new concept for yourself.
If you have any questions about trading instruments, you can always ask an analyst in the online chat on the portal and get a free consultation of an experienced specialist.
Use the current recommendations of analysts on AUD/USD and trade efficiently with NPBFX.
Good afternoon, dear forum visitors!
NPBFX offers the latest release of analytics on the AUD/USD for a better understanding of the current market situation and more efficient trading.
Current trend
The pair can grow.
On the 4-hour chart, the upward correction of the higher level is developing as a wave 2 of (5). Now the wave w of 2 is developing as a flat (a)(b)(c), within which the wave (c) of w is forming. If the assumption is correct, the pair will grow to the level of 0.7540. The level of 0.7347 is critical and stop loss for this scenario.
Main scenario
Long positions will become relevant during the correction, above the level of 0.7347 with the target at 0.7540. Implementation period: 7 days and more.
Alternative scenario
The breakdown and the consolidation of the price below the level of 0.7347 will let the pair go down to the level of 0.7250.
Use more opportunities of the NPBFX analytical portal: glossary
Beginning traders certainly face a lot of specialized concepts and lexicon on FOREX, which are often not fully been understood. Swap, tick, hedge, margin calls are often unfamiliar to beginning traders. But the lack of knowledge of these fundamentals make a competent market vision impossible. So glossary on the NPBFX analytical portal could be an excellent helper in this case, which contains all the main definitions with explanations in a compact and accessible form. All concepts are arranged in alphabetical order, so that you can easily and quickly find and explore a new concept for yourself.
If you have any questions about trading instruments, you can always ask an analyst in the online chat on the portal and get a free consultation of an experienced specialist.
Use the current recommendations of analysts on AUD/USD and trade efficiently with NPBFX.