You are using an out of date browser. It may not display this or other websites correctly.
You should upgrade or use an alternative browser.
You should upgrade or use an alternative browser.
USDCAD: is it a bear or a bull in disguise ?
- Thread starter stephane
- Start date
fxstrategist
Corporal
- Messages
- 742
The USDCAD has found a good resistance at the 1.2800 level, if oil keeps dropping, we may see a breakout of this level.
fxstrategist
Corporal
- Messages
- 742
The USDCAD stays just below the 1.2800 level, but it looks like getting ready to breakout, especially if the FED hints at a rate hike.
fxstrategist
Corporal
- Messages
- 742
The USDCAD still boxed between the 1.2400 and the 1.2800. Well-defined range, but no clear direction yet.
fxstrategist
Corporal
- Messages
- 742
More range trading on the USDCAD, especially around that 1.2600 level. Main support remains at the 1.2400 and resistance at the 1.2800 levels.
fxstrategist
Corporal
- Messages
- 742
The USDCAD stays in the 400 pip range from the 1.2400 to the 1.2800 level. The 1.2400 has proven to be a good support and a possible breakdown of that level coudl make the price accelerate its bearish momentum.
stephane
Private, 1st Class
- Messages
- 114
The USDCAD stays in the 400 pip range from the 1.2400 to the 1.2800 level. The 1.2400 has proven to be a good support and a possible breakdown of that level coudl make the price accelerate its bearish momentum.
I have a different support and resistance that gives me rather a 500 pips range, but boy ranging it is ! Hopefully with a 500 or 400 pips range, you may trade from support to resistance or opposite and make some pips.

fxstrategist
Corporal
- Messages
- 742
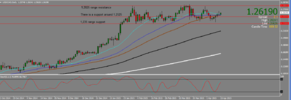
The USDCAD goes back above the 1.2600 level, which is the middle of the range between the 1.24 and the 1.28, indicating another possible visit of the 1.2800 level.
fxstrategist
Corporal
- Messages
- 742
The breakdown on the USDCAD from the 1.2400 level has take it to the 1.2100 level, which has acted as support for the pair, but another visit to that level may cause more drops for the pair.
Similar threads
- Replies
- 7
- Views
- 769
- Replies
- 7
- Views
- 232
- Replies
- 0
- Views
- 198
- Replies
- 6
- Views
- 797
- Replies
- 12
- Views
- 326
