Avoiding False Breakouts in Bitcoin

How to tell a true break from a false break
There are few worse experiences for a trader than being on the wrong side of a false break in Bitcoin, or any market for that matter. A skilled technical analyst knows how to recognise and evaluate support and resistance levels. But at what point has the level been broken? Is it $1 through the level? Perhaps $100? How far does it have to go before you have the confidence to make the trade? The fear is that getting short (or long) on a break is an exposed and scary moment for traders.
The process may go like this: the market is testing and then breaking a support level; you want to wait as brief a time as possible, but feel confident that the break is for real and it’s time to take the plunge and short the market (and/or liquidate a long position). In volatile thin trade other traders recognise support is giving way, too. As soon as you’ve completed your short trade, the market occasionally turns quickly and viciously in your face, recovering and returning above the breakdown point. Yuck! As a disciplined trader, you now know that you are wrongly positioned and will be forced to cover painfully as the market moves back in the direction it was going before the dreaded false break. Worse still, you are scrambling to get long as the price confirms the support level has held by moving higher.
Has this happened to you? It is humiliating and very frustrating. It can even fill you with self-doubt. If you haven’t experienced it yet, you will. No matter how good you are as a trader and technical analyst, false breaks are a fact of life. The best you can do is reduce the chances of the trade being another horror story. This is true when trading Bitcoin, any other crypto or, indeed, any market.
You can recognise good and false breaks by listening to the market. Learn to hear, and interpret the message when the screams or yells, or whispers or whimpers, as levels give way. This skill will reduce the frequency of falling victim to horrible false breaks.
There is one sure way to avoid false breaks
There is a way you can never fall victim to false breaks. That is always to place your Stop so far away until you are sure the break is a true one. Given enough price movement and time, you will have the confidence to trade with the certainty a reversal will not stop you out. The problem is that by the time the price gets to the point where you are sure it will not hurt you, you have lost all the potential for the trade. In this case, the cost of insurance was just too high.
Placing a Stop so far away is not a desirable thing to do. The result is that you have fewer occasions where you are stopped out but, every time you’re stopped out, the loss is large. On balance it may be better to have a tighter Stop and have an occasional unfortunate execution with a smaller loss. Your Stop should be far enough away from the break level not to get caught in the noise of the break, but not so far away that your trade is always filled at an abysmal level. There is an optimal distance away to place the Stop.
Professionals have this skill
Institutional traders are well trained. Their firms have big budgets and know the importance of personnel with high-level skills. Technical analysis is one of the skills any modern trader must possess. They don’t just have to be good, but better than their competitors. Education is not a luxury. It is a necessity. Regulators require registered people to have proven competence in what they are doing. This is called Continuous Professional Development (CPD). CPD is a regulatory requirement for brokers and advisors. They are obliged to have a fixed number of hours per year of education that is of high quality and relevant to their job. Each registered person’s log of CPD hours is audited by the regulator. It is good for the person, the industry, the company’s bottom line and is required by regulators. Generally speaking, institutional (truly the professional) traders are so good because they are well trained.
How a professional makes the decision
So, you are forced into an emotional compromise. How do you ensure that, overall, you are doing better with your order placement by placing an order very close to the level (to get in early) or far away (to avoid the false break)? How to work this out? Professionals know there is no perfect answer, just a best answer.
Listen to the market
The market speaks. Listen to what it is saying. The price is an accurate reflection of all market knowledge, plus traders’ hopes, fears, expectations, frustrations and optimism. The price is right and accurately portrays everything (not just the fundamentals) accurately and dynamically. If you know the price, you know all the news and, more importantly, what the market thinks of the news.
At the point of the break (true or false) the market will be shouting (if you care to listen) whether the move is a false or true break.
Five tests to confirm a break
What does a market sound like when making a true break and what does it sound like when making a false break? On a true break, it follows through, and on a false break, it whips back around. What message does it make at the break point and what is the difference?
When a market approaches a (say) support level, apply the following tests. See how it fairs in the tests and that tells you the sound the market is making. This exercise is the same no matter the timeframe you are using.
We want a test which tells us the market’s sound as early as possible with the best chance of getting the correct answer.
Test 1
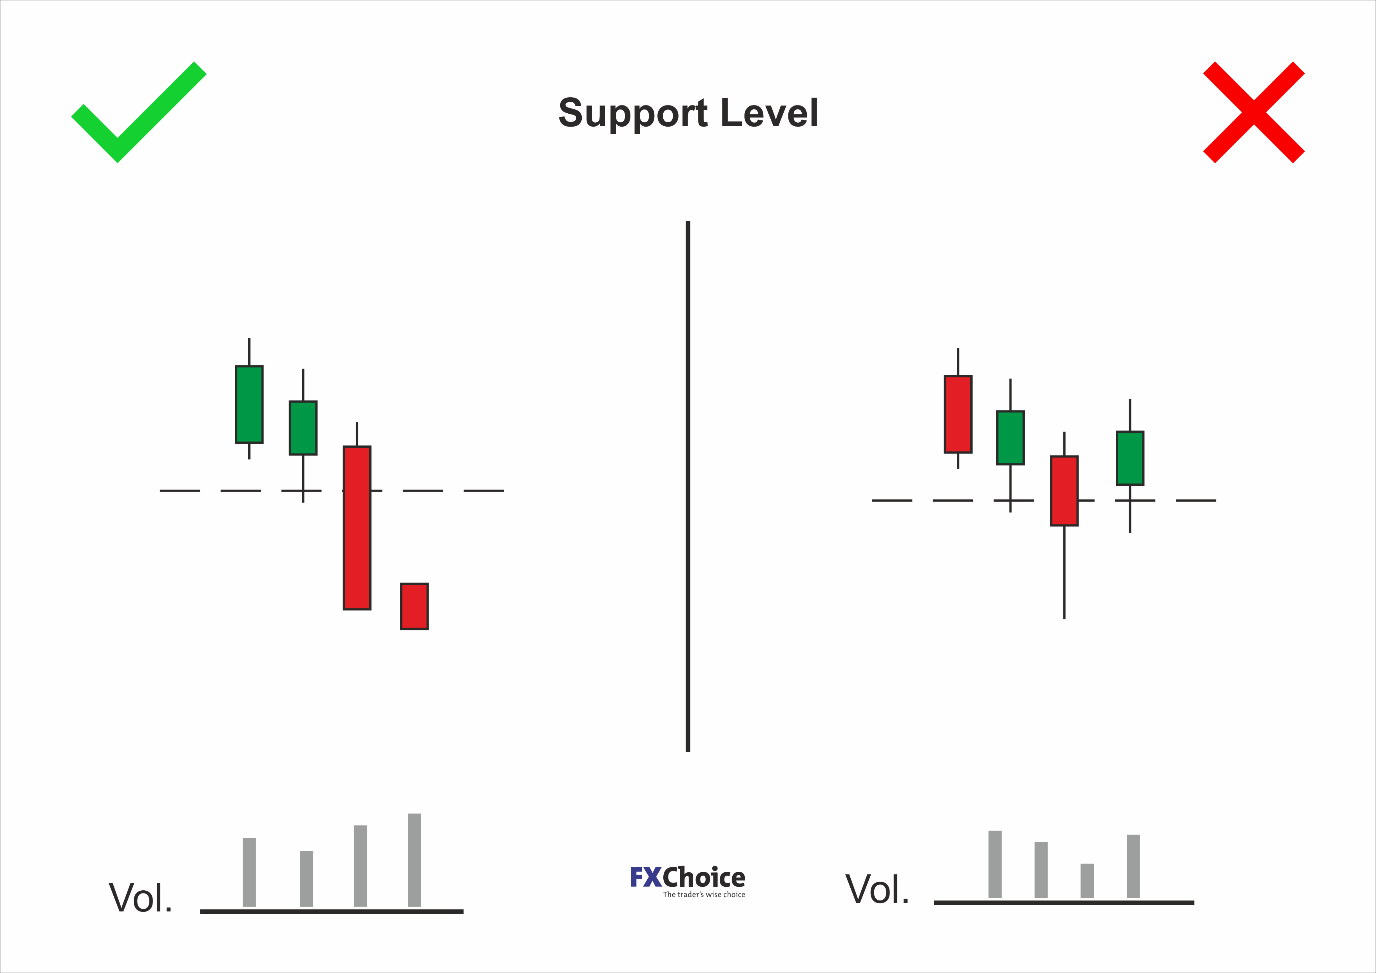
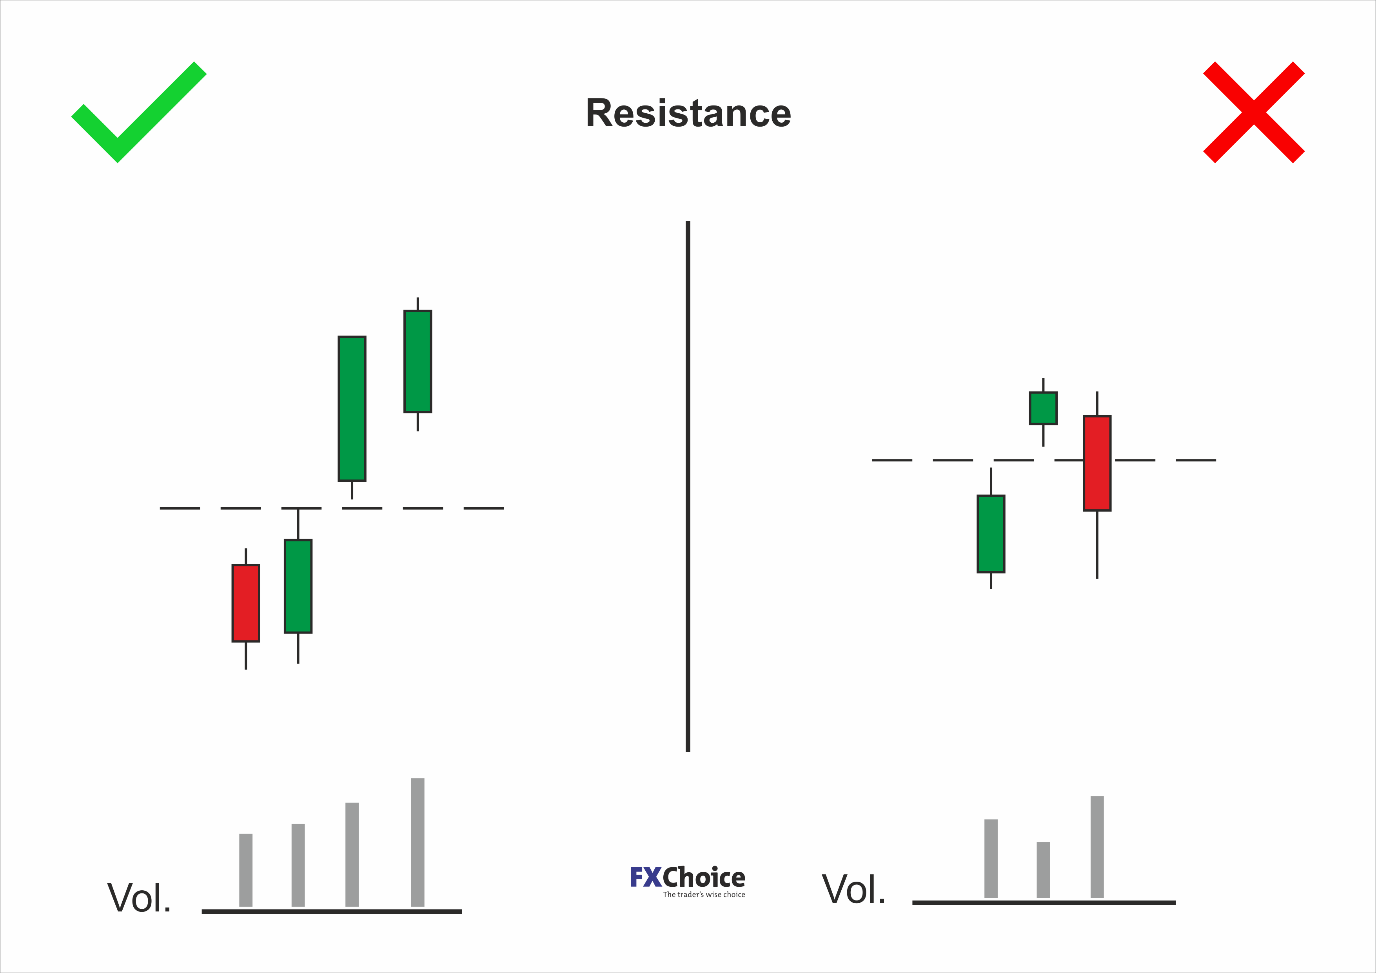
The candle must close through the level. If you have defined the level of the break and the price cannot hold it, it did not break. This is true whether it is a daily candle or an hourly candle. The first bar’s confirmed break is a minimum. Test 1 is a requirement.
Tests 2-4 are your evidence of a true break. The more that are true, the surer you are. The more they are true, the louder the market is shouting BREAK OUT!
Test 2
The candle closes at the extreme. The candle (whatever period it is) ends at or near its extreme point. If it is breaking down, it is closing near its low. If it is breaking up, it’s high. Anywhere in the bottom- (breaking down) or top- (breaking up) third of the candle is shouting to you. A break down with a close at the very low shows selling was relentless. Not one wanted to short cover at the end. They just want to sell and sell. The market is screaming at you.
Test 3
A long bar. A long bar is a relative thing. We mean a high-to-low range, which is larger than its normal bar range. If you think about it, what is happening when ranges are larger than average is that traders are panicking to buy or sell. They are breaking the market. Let us say that a normal range would be 20 pips, but the market is willing to sell aggressively at 25 down, 30 down 35 down and still selling at 40 down. The range for this bar is twice normal. This shows an element of conviction and desperation. In other words, there is power behind the move. A large candle at a breakpoint is another scream from the market.
Test 4
High volume. This is not easy to see in Bitcoin and the other cryptos. It is also difficult to see in forex and other Over-The-Counter markets. But you can feel it. You can tell how busy it is by frequent or infrequent quote updates. The busier it is, the higher the turnover. The importance of turnover is that it accurately displays the conviction of a move. If a market breaks down and the volume is heavy, it tells you very clearly there is power behind the sell-off. It is a screech.
Test 5
A Gap. An up gap is formed when the low of the current bar is higher than the high of the previous bar. The reverse is true for a down gap. These gaps are called breakaway gaps. An up gap is bullish, and a down gap is bearish. The bigger the gap, the stronger the message. Gaps do not happen often but, if one occurs when a support or resistance level is breaking, the market is yelping Ouch! As the market changes direction or makes a new high or low, sometimes it is explosive. The market may break down and there are simply no buyers. The sellers are frantic to sell and offer down because they must liquidate positions or establish new large short positions. This is not a gap formed by lack of liquidity or thin trade. It is quite the opposite.
There are some markets where it is hard for gaps to form – such as the forex market for G10 currencies where these pairs are liquid all the time. Their only opportunity for a gap is at the weekend. They trade fluidly and continuously. Bitcoin trades fairly liquidly over the weekend. Any gap in Bitcoin is therefore meaningful. If you ever see a gap in Bitcoin, it is significant. This is not so for the less-liquid cryptos.
What noise does a false break make?
When a market breaks a significant level and just whimpers or whispers, it is very likely to be a false break. The price should not close mid-bar on a narrow range day (this candlestick is called a Doji – a message of indecision). If the market is breaking up or down or through a trend line or neckline, it should not be a quiet day. All the opposites of rules 2-5 indicate no pulse increase or power behind the break down or break up. For a technical analyst, these are visual signs of silence. Even if this results in a close through the support or resistance line, it is not how it should be when trends change or break out.
A technical analyst sees the decibel (dB) of a move as a clear message of its power. A break will only be true if it is accompanied by force – noise. A technical break with no force is almost always false or, at the very least, delayed. If you close through a support or resistance level but do not see at least two of Rules 2-5, wait. It may be delayed, and you will hear the noise on the next bar and follow it with confidence. If you do not, you will probably find it was a false break, and the market bounces over the next few bars.
Be grateful that the market broke the level, but you were not sucked in with the rest.
Let the market tell you if the move is true or false. It is talking or even shouting when it is breaking. It mumbles or whispers when the break is false. All you have to do is pay attention and listen.
To avoid false breaks, don’t shout, listen
Using the tests above, you will hear what the market is saying when your support or resistance level is giving way. Apply these tests, and if Test 1 is fulfilled with at least two of the remaining four being also, then go ahead and take the plunge. Remember to place a Stop as the market sometimes changes its mind. We are entering quickly into a trade – within one bar of the brake – and so there is a danger of getting it wrong, but the reward is getting into the trade quickly at a good level. If you do not see at least two of the four tests fulfilled, then wait. Your estimation of where the support or resistance level is maybe slightly wrong, and the tests are not fulfilled until the next bar, and you can make the trade with confidence then. Or if it was a false break, and it just tickled through the level with no follow-through, you will be relieved you didn’t act, and weren’t caught with the other poor souls who were stopped out.
Using this method, you are not relying on some fixed number of dollars to tell you whether the break is true or false, which may or may not be correct. You do not jump in too quickly. You’re waiting for the rest of the market to tell you that the level is giving way or not. It is the rest of the market that will decide, not you. Follow the noise of the market. Don’t insist the market is wrong or it must do something because your level has been broken. It will tell you, usually clearly, that it has broken or held.
Armed with the ability to listen, you will substantially improve your ability to avoid false breaks and get in at a good level on true breaks. You cannot eliminate false breaks. If you do, you are entering too late and will lose out overall. Accept an occasional false break, but use your skill to make the experience a rare one.
This article was written by Trevor Neil, Consultant Technical Analysis to FXChoice.
Author Profile

FxChoice
The company boasts award-winning Customer Service and emphasises its dedication to tight spreads, rapid execution, fund security and breadth of deposit/withdrawal options. Within its MetaTrader platform, FXChoice clients can trade up to 36 currency pairs, as well as Indices, Commodities, Shares and Cryptos.
Info
258 Views 0 CommentsComments
Table of Contents
Recent
-
Bitcoin Fundamental Briefing, March 2024 Demystifying Cryptocurrency Nodes: Deep Dive into Polygon Node Ecosystem Strategies for Trading Forex on a Budget Bitcoin Fundamental Briefing, February 2024 Bitcoin Fundamental Briefing, January 2024 Strategic Asset Allocation Techniques for Currency Traders Bitcoin Fundamental Briefing, December 2023 Bitcoin Fundamental Briefing, November 2023