ePlanet Brokers Expands Transparency Efforts With New H1 2026 Operational Disclosures
Transparency in online brokerage is often discussed in terms of regulation, pricing and risk disclosures. However, another part of transparency is less frequently visible: how a broker performs operationally after a client opens an account.
How long does verification take? What percentage of withdrawal requests are successfully processed? How quickly are orders executed? How often are trading systems available? And when clients submit formal complaints, how are those cases handled?
ePlanet Brokers has attempted to provide answers to some of these questions through its H1 2026 Transparency Report, which discloses operational data covering KYC verification, deposits, withdrawals, trading execution, infrastructure reliability, customer support and formal complaints.
The reporting period covers January 1 to June 30, 2026, with comparisons against H2 2025 where the underlying data is considered sufficiently comparable.
The report is available here.
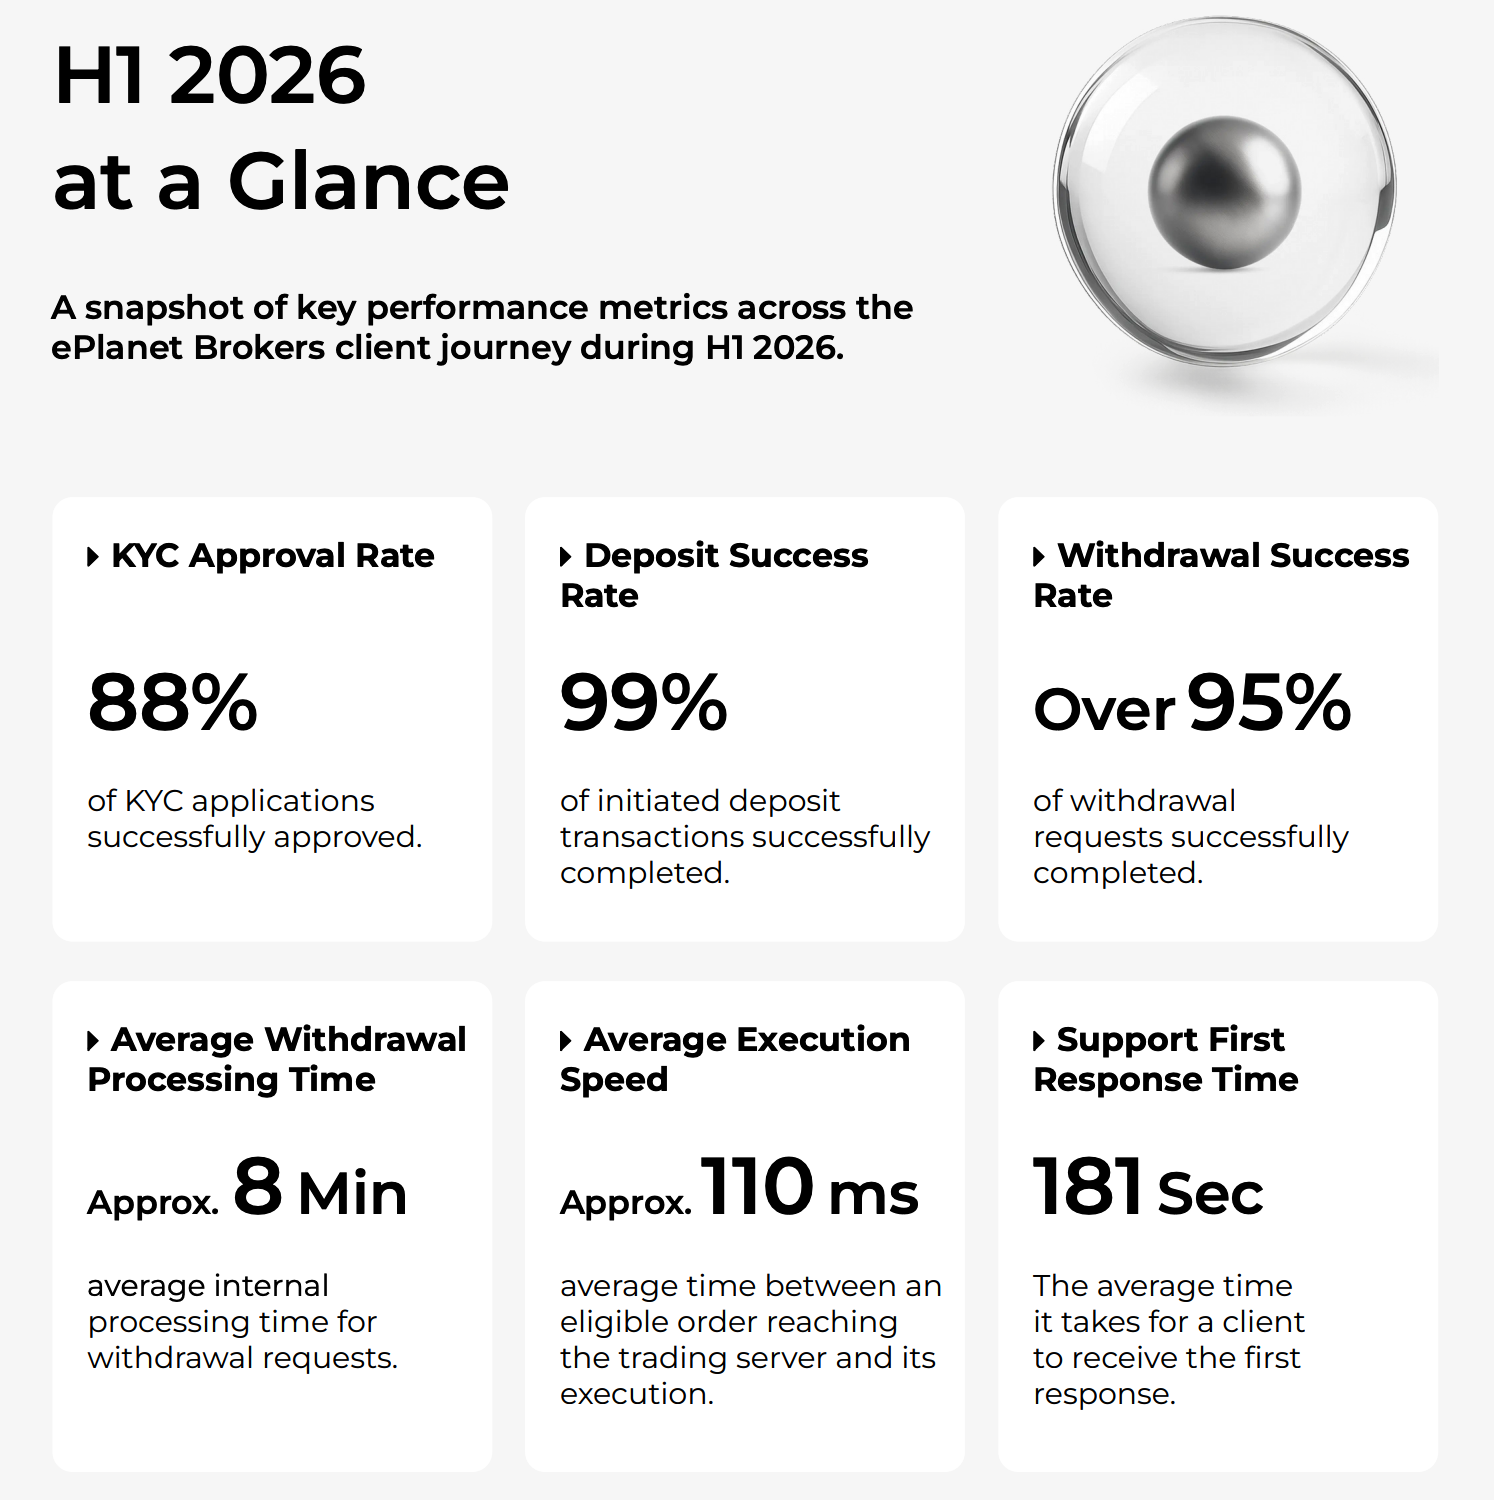
H1 2026 at a Glance: Key operational performance metrics across the ePlanet Brokers client journey.
The significance of the publication is not limited to individual performance figures. By publishing definitions, previous-period comparisons and methodological limitations alongside the numbers, ePlanet Brokers is creating a baseline against which future operational performance can be evaluated.
Why Operational Transparency Matters to Traders
Traders evaluating a broker typically encounter information about platforms, instruments, spreads, account types and regulatory arrangements. These factors are important, but they do not necessarily describe what happens during the day-to-day client experience.
Operational data can provide another perspective.
For example, a broker may state that withdrawals are processed efficiently. Publishing an actual average processing time allows that statement to be measured. Similarly, describing an execution infrastructure as fast is different from publishing an average execution figure and explaining how it is calculated.
This distinction is important when interpreting the ePlanet Brokers report. The document contains positive performance figures, but it also defines what those figures represent and, in several cases, what they do not represent.
That makes the underlying methodology almost as relevant as the headline numbers.
Withdrawal Success Exceeds 95%
Withdrawals are likely to be among the most closely examined metrics in any broker transparency report.
For H1 2026, ePlanet Brokers reported a withdrawal success rate of more than 95%, compared with approximately 90% during H2 2025.
Average internal withdrawal processing time was approximately eight minutes. During H2 2025, the corresponding figure was under 20 minutes.
The report therefore indicates a material reduction in average internal processing time between the two reporting periods.
However, the definition of this metric is important.
The approximately eight-minute figure measures the period between a client’s withdrawal request being submitted and that request being processed by ePlanet Brokers. It should not be interpreted as an eight-minute guarantee for funds to arrive at the client’s final destination.
Banks, payment providers, interbank settlement systems and blockchain confirmations may continue processing a transaction after the broker has completed its part of the process.
This distinction is particularly relevant when comparing withdrawal experiences across payment methods.
Withdrawal Automation Increased to More Than 40%
Another notable change involves automation.
ePlanet Brokers reported that more than 40% of withdrawals were automated during H1 2026, compared with approximately 10% or lower during H2 2025.
Automation can reduce the amount of manual intervention required for eligible requests, although not every withdrawal can necessarily follow an automated path.
The report identifies three primary factors behind withdrawal delays during H1:
Interbank transfer settlement delays.
Bank-specific transaction restrictions.
Additional review requirements.
Requests requiring additional review represented less than 10% of total withdrawal requests during the period.
There are also circumstances in which a withdrawal may be rejected rather than delayed.
According to the report, these include minimum holding period and trading activity requirements, a mismatch between the withdrawal method and original deposit source, and confirmed violations of applicable trading terms.
The report states that at least 24 hours must have passed since a deposit and at least 0.02 lots of trading volume must have been completed before a withdrawal request is submitted. Where these conditions have not been met, the client is asked to resubmit the request after the applicable requirements have been satisfied.
A more detailed explanation of the withdrawal process, processing times and verification requirements is available here.
ePlanet Brokers Sets Further Withdrawal Targets for 2026
The value of publishing operational metrics becomes greater when they are followed by measurable targets.
For the remainder of 2026, ePlanet Brokers has identified several objectives related to withdrawals.
The company is targeting an average internal processing time below five minutes by the end of the year, compared with approximately eight minutes in H1.
It is also targeting a 50% automated withdrawal rate, up from more than 40%, and aims for approximately 40% of eligible withdrawals to be processed instantly.
These are forward-looking operational targets rather than current performance figures. Their significance will therefore depend on whether subsequent reporting provides comparable data showing whether they were achieved.
KYC Approval Rises From 71% to 88%
Client verification is another area where the report provides comparative data.
The KYC approval rate reached 88% in H1 2026, compared with 71% in H2 2025. This represents an increase of 17 percentage points.
The report also states that the company’s automated identity verification process takes less than 30 seconds on average.
That metric specifically refers to the automated identity verification process. It should not be interpreted as meaning that every KYC case, including those requiring additional documents or enhanced review, will necessarily be completed within 30 seconds.
The main reasons verification could not be completed successfully on the first submission were duplicate accounts, document image or authenticity issues, and incomplete, damaged or non-compliant identity documents.
The report also notes that duplicate-account cases increased during H1 2026 and contributed to unsuccessful applications.
ePlanet Brokers states that it applies a risk-based verification approach. Depending on the circumstances, this can involve additional documentation or enhanced due diligence.
Deposit Success Reaches 99%
Deposits were another area of improvement during the reporting period.
ePlanet Brokers reported a 99% deposit success rate in H1 2026, compared with approximately 95% in H2 2025.
Average deposit processing time was approximately one minute, although the report notes that processing varies depending on the payment method.
The overall average reflects the fact that most deposits use faster payment methods.
The report also identifies reasons why deposits may fail.
For cryptocurrency deposits, examples include incorrect wallet information or selection of an incorrect blockchain network. For bank-related deposits, unsuccessful transactions may result from incorrect or mismatched information or transactions returned by the banking system.
The broker also states that deposits should generally originate from a source belonging to the client and that verification, AML and KYC controls may apply.
Order Execution Success Reaches 99.9%
Beyond payments and verification, the report includes data on trading infrastructure.
ePlanet Brokers reported an order execution success rate of 99.9% during H1 2026, compared with approximately 98% during H2 2025.
Average execution speed was approximately 110 milliseconds, down from approximately 150 milliseconds in the previous six-month period.
That represents an improvement of approximately 26.7%.
Again, the definition matters.
Execution speed is defined as the time between an eligible order reaching the trading server and its execution. It is therefore a specific infrastructure measurement rather than a guarantee that every trade will be executed in exactly 110 milliseconds.
The report also acknowledges that execution can be affected by factors including market volatility, available liquidity, price movements, trading-session conditions and technical or communication issues.
This qualification is particularly relevant during periods of rapid market movement, when execution conditions may differ significantly from averages recorded over a six-month reporting period.
What Does the Reliability Data Show?
System availability provides another way to assess operational infrastructure.
Here, there is an important difference in the reporting periods.
Unlike several other figures in the report, the infrastructure availability statistics are presented on a 2026 year-to-date basis, rather than strictly as H1 2026 figures.
Trading-platform uptime was reported at more than 99.997% for 2026 YTD, compared with approximately 99.98% for full-year 2025.
Client Portal uptime was reported above 99.982% for 2026 YTD, while payment-system availability was reported at 100% over the same YTD period.
The company’s stated target for trading-platform uptime across the full 2026 calendar year is above 99.992%, corresponding to total trading-platform downtime of less than 40 minutes.
The distinction between H1 and YTD figures is important when making comparisons and is explicitly reflected in the report’s methodology.
Customer Support Response Times Also Improved
Operational transparency also extends beyond payments and trading infrastructure.
ePlanet Brokers provides 24/7 customer support alongside dedicated account management.
According to the report, average support first-response time decreased from 248 seconds in H2 2025 to 181 seconds in H1 2026, representing a reduction of approximately 27%.
Average resolution time also declined, from 80 minutes to 67 minutes, an improvement of approximately 16%.
These figures provide a quantitative view of support performance, but averages should again be interpreted carefully. A straightforward support request and a complex account or compliance case may require very different resolution times.
Formal Complaint Rate Falls to 0.2%
Complaints are another area where transparency can be particularly relevant.
ePlanet Brokers reported that formal complaints represented 0.2% of active clients during H1 2026, compared with 0.3% during H2 2025.
The broker also reported a formal complaint resolution rate above 99%.
The report identifies two principal categories of client concern.
The first involves account restrictions following trading or account reviews. According to the report, a limited number of cases involved suspected or confirmed activity potentially breaching the company’s Terms and Conditions, including prohibited arbitrage, fraudulent activity or multiple-account activity.
The second category involves market volatility and trading outcomes. Rapid price movements, wider spreads, slippage and changing market conditions can affect execution and trading results.
It is important not to overinterpret the complaint resolution figure.
A resolution rate above 99% means formal complaints were processed and resolved through the company’s complaint-handling framework. It does not necessarily mean every complainant received the outcome they requested or that every complaint was determined in the client’s favor.
Similarly, the 0.2% figure refers specifically to formal complaints as a percentage of active clients. It does not represent every support conversation, public review or social media comment involving the broker.
Legal and Regulatory Context
Operational transparency does not replace the need to examine a broker’s legal and regulatory arrangements.
According to the Transparency Report, ePlanet Brokers operates within established regulatory frameworks across multiple jurisdictions, including Vanuatu and the Comoros Union.
The company states that these arrangements form part of its broader framework for responsible business practices, operational transparency and standards across its brokerage activities.
Clients conducting due diligence should examine the relevant legal entities, applicable jurisdictions, client agreements and regulatory information rather than relying solely on operational statistics.
ePlanet Brokers provides further information regarding its legal entities, registration details and regulatory framework here.
What the H1 2026 Numbers Do Not Show
Transparency reporting is useful only when its limitations are understood.
The ePlanet Brokers report explicitly states that aggregated operational performance does not guarantee an individual client or transaction outcome.
Processing times generally represent internal processing unless otherwise specified. External banks, payment providers, blockchain networks and other third parties may affect total processing times.
Trading metrics are based on eligible orders. Infrastructure availability is calculated using recorded system availability. Complaint metrics refer specifically to formal complaints recorded by the company.
The report also notes that some figures are rounded and uses terms such as “approximately,” “more than,” “less than” and “under” deliberately where the underlying figures represent estimates, thresholds or rounded values.
These qualifications matter because operational statistics can otherwise appear more definitive than they actually are.
Why Future Reports Will Matter
One transparency report provides a snapshot. A series of comparable reports can provide a trend.
That distinction may ultimately be more important than any individual H1 2026 figure.
ePlanet Brokers has now published benchmarks for withdrawal success and processing time, withdrawal automation, KYC approval, deposit success, execution performance, system availability, support response times and formal complaints.
It has also published forward-looking targets in areas such as withdrawal processing and automation.
Future reports can therefore be assessed against a measurable baseline.
For example, traders will be able to see whether the targeted sub-five-minute average withdrawal processing time was achieved, whether automation reached 50%, and whether improvements in execution, support and infrastructure reliability were maintained.
Consistency will be important. Metrics are most useful when definitions remain sufficiently stable to allow meaningful comparisons across reporting periods.
Transparency as a Measurable Process
Broker transparency cannot be established by publishing a single document, and operational statistics should not replace independent due diligence.
However, publishing measurable performance data can give traders additional information beyond marketing claims.
For H1 2026, ePlanet Brokers has disclosed a withdrawal success rate above 95%, approximately eight-minute average internal withdrawal processing, 88% KYC approval, 99% deposit success, 99.9% order execution success, approximately 110-millisecond average execution speed, improved support response times and a formal complaint rate of 0.2% of active clients.
Just as importantly, the report provides definitions and limitations explaining how those numbers should be interpreted.
The next test will be consistency: whether future disclosures continue to use comparable methodologies, whether the reported improvements are sustained, and whether the targets announced for the remainder of 2026 are met.
For traders assessing a broker, that kind of longitudinal operational data can be more informative than any isolated performance claim.
Author Profile