Forex Trading Strategies for Beginners
In order to trade the markets effectively and profitably, you need an edge. That edge is usually a carefully crafted strategy. A strategy, by definition, should enable you to take advantage of opportunities while avoiding potential threats. A strategy is your approach to achieving your goals in the market, and success comes with proper strategic planning and execution.
Your strategy can rely on technical signals alone (that is, it relies on chart patterns and signals from technical indicators), or it can rely on both technical and fundamental types of analysis. Either way, it is important to test your strategy on a demo account before going live with it. A strategy is only an experiment until you have actual evidence of the results.
Matching the right trading strategies with the right pairs
There is a plethora of trading strategies out there to choose from, but not all strategies have optimal outcomes. Furthermore, the strategy you eventually choose to implement will have to be compatible with the pairs you trade it on. For example, usually, strategies that are based on trend following will generally work better on the Japanese Yen pairs, since they tend to trend more often. On the other hand, strategies that are based on trading within support and resistance levels work better on other pairs generally. This is not to say that you should not implement a specific strategy on a specific currency pair if you have tested it and are comfortable with the results.
Below are a few strategies you can start using today, and which will hopefully work on most, if not all, pairs.
The first strategy for beginners: The breakout strategy
The breakout strategy requires only a plain chart. You can use an oscillating indicator with it, but that is not always necessary unless you want an added confirmation. To implement this strategy, you need to follow the steps below.
- Draw a trend line that touches at least three tops (highs) or bottoms (lows). Ensure the tops or bottoms are spread apart. In other words, ensure there are at least 4 or 5 candles between every two tops or bottoms. Your trend line won’t be meaningful if you consider tops or bottoms that are too close to one another (i.e. just one or two candles apart).
- Wait for the price to break out of the trend line. If it is a rising trend line, wait for the price to break to the downside. If it is a declining trendline, wait for the price to break to the upside. In either case, this breakout would mean that the price movement pattern has changed.
- Ensure that the breakout candle closed outside of the trendline before entering the trade. This is important to avoid a false breakout.
- You can use an oscillator such as the RSI or CCI or MACD for added confirmation, but usually, if the break has happened on a higher time frame (daily, weekly), this may be unnecessary. If you want to use the RSI, for example, and want to enter a long (bullish) position, make sure that the indicator has moved from an oversold situation and surpassed the 30 level higher. This ensures that the momentum is moving in your favor.
- You can wait for a retest of the trendline after the breakout to confirm the actual breakout. However, sometimes the market moves strongly and does not give you a chance to enter on a retest.
- Set the stop loss above or below the most recent swing before the breakout took place. The target should be at least at double the distance from the stop loss, giving you a good risk to reward ratio of 1:2.
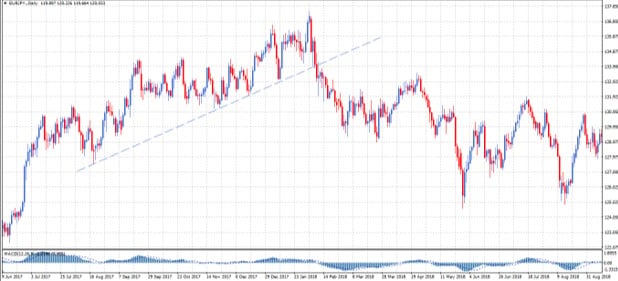
In the above daily chart of EURJPY, you can see how the price was moving in an uptrend first, then it broke out, and the downside movement began. You can see how the price movement pattern has changed and the market reversed direction.
Risks associated with the above strategy:
- Not all breakouts are meaningful. Sometimes the price will break out of the trendline and the candle will close outside of the trendline, but the market won’t continue in the direction of the breakout. This can happen on smaller timeframes and is less frequent on higher time frames since often breakouts on higher timeframes are more meaningful.
- False breakouts can occur where the candle will break out of the trend line, but then it will reverse, and you will only see the tail of the candle outside of the trendline. You can avoid this risk by waiting for the breakout candle to close outside of the trendline.
The second trading strategy for beginners: The RSI breakout strategy
This strategy uses somewhat the same principles as the normal breakout strategy mentioned earlier, but with a little exception: the breakout must happen on the RSI momentum indicator, rather than the actual price movement. You can actually use another momentum indicator for confirmation in this strategy. However, it relies on RSI as the main indicator giving the signal.
To implement this strategy, you need to add the RSI indicator to your chart with default settings first. Then, you will need to draw a trend line on the indicator itself, not on the price chart. In order to draw a trend line, you will need three tops or bottoms on the indicator. It is highly recommended not to draw lines with less than three points, as the line then will be less reliable. It is also recommended to use the most recent tops or bottoms.
Once you draw the trendlines, you will need to wait for the indicator to break out of that trend line. This should happen on the RSI indicator. The main idea behind this strategy is that a breakout on the RSI indicates a change in momentum, and thus a change in the direction of price movement. It is also important to wait for the breakout candle to close before entering a trade.
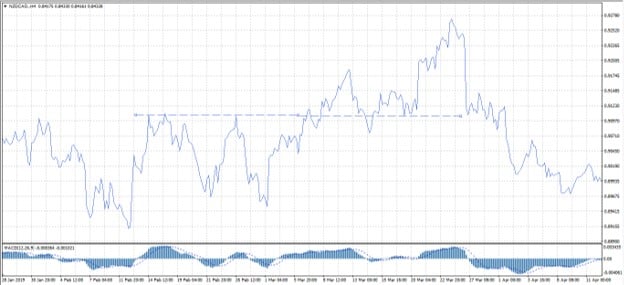
If executed well, this strategy can help you catch quick market moves and make fast gains. However, it is important that the conditions mentioned above are met to increase the chances of success.
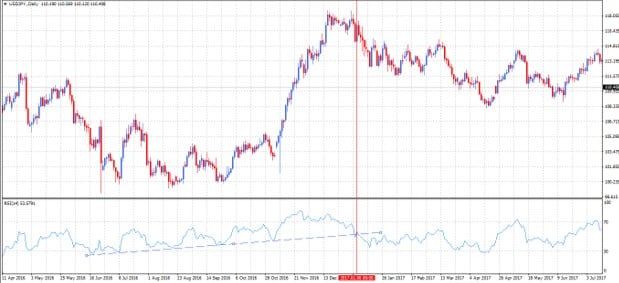
In the above chart, it can be seen that the RSI has been trending upwards, along with the price. Then the RSI pointed downwards and broke out of its previous trend, signaling that the momentum has changed. The market then moved downwards although it was moving strongly upwards before that took place.
Risks associated with this strategy
- Just like in the previous strategy, the breakout on the RSI can be short-lived. Not all breakouts on the RSI translate into positive trades, although it is a good signal in general. To minimize this risk, it would be better to analyze price action and combine the RSI signal with other signals.
- Sometimes the price moves in the direction of the breakout but does not reach your target at 1:2 risk to reward ratio. In this case, you can move the stop loss to breakeven or half the distance to lock in your profits.
The third trading strategy for beginners: The Ichimoku and CCI strategy:
This strategy is a trend following strategy. If implemented correctly, it should enable you to catch strong trends. The strategy uses two indicators which are the Ichimoku cloud and the Commodity Channel Index (CCI). The default settings are used for Ichimoku could, whereas you can use the period 20 for the CCI. This is higher than the default 14 but it should give you less frequent and more reliable signals. To implement the strategy, follow the steps below:
- Plot the ichimoku cloud with the default settings. Wait for the ichimoku momentum indicator to be above the cloud for a bullish trade, and below the cloud for a bearish one. Do not enter just yet. The entry in this strategy is based on the signal from the CCI.
- Plot the commodity channel index but set the period at 20 instead of the default 14 to get fewer signals. Wait for the CCI indicator to cross the 0 line from below to the top for a bullish entry, and from above to the bottom for a bearish entry.
- Implement this strategy on higher timeframes, such as the 4h, daily, and perhaps the weekly timeframe if you have the patience for it.
- Set the stop loss either above the recent swing up for a bearish entry, or below the most recent swing down for a bullish entry.
- You can also set the stop loss above the cloud for a bearish entry, and below the cloud for a bullish one. Move your stop loss as the cloud changes position.
- Set the target at twice the distance from the stop loss to have a healthy risk to reward ratio.
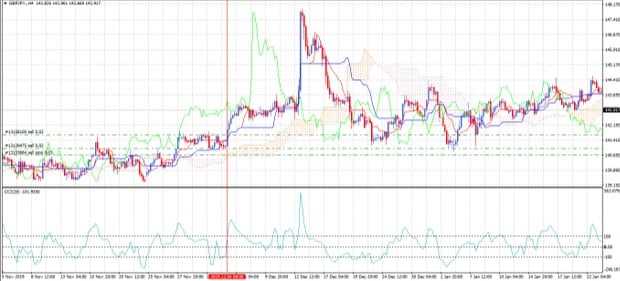
In the above chart, you can see how the price went up after the CCI (20) went above the 0 line from below, and the momentum indicator on the Ichimoku was above the cloud. The market then moved strongly upwards.
Risks associated with this strategy:
- Weak movement following the signals. It is important to move the stop loss to breakeven or halfway through to lock in some profit.
- The price may not respect the Ichimoku cloud, in which case you should wait for a breakout to have a confirmation before entering.
The fourth trading strategy for beginners: The M (or W) shape strategy
For this strategy, you can use the line chart instead of the candlesticks chart. The line chart will make the M shaped pattern easier to detect. In this strategy, you will be looking for a pattern in which the market makes two tops (or bottoms), and then reverses direction. This will result in an M shape (or a W shape).
The idea behind this strategy is that it enables you to detect the double-top or double-bottom pattern and trade it.
To trade this strategy, follow these rules:
- Change the chart type form the candlestick chart to the line chart.
- Choose the time frame that you prefer. This strategy should work on all time frames beginning from the 5 minutes and upwards.
- Look for the M pattern (or W pattern) on the chart or wait for it to occur.
- Wait for the pattern to become complete before you enter a trade.
- After you see the complete M-shaped pattern, wait for the price to retest the neckline, as shown in the chart.
- Enter the trade upon a retest of the neckline.
- Set the stop loss above the two tops of the M shaped pattern.
- Set the target profit at an equal or at double the distance from the stop loss. The risk to reward ratio on this trade is 1:1, or 1:2.
In the chart above, you can see that the market moved in a W shape. The two bottoms are not exactly at the same price level, but patterns are not always perfect. You can also see the retest and then the upside movement.
Risks associated with this strategy:
- This strategy often results in a 1:1 risk to reward ratio, which is not very attractive.
- It can be difficult to determine which M or W shapes you should trade. Therefore, you should seek confirmation from higher timeframes.
Final words:
Strategies based on technical signals can be very helpful, but they come with a wide variety of risks. Many technical signals can be a result of market volatility rather than an actual change in direction, and thus those signals can be misleading. Therefore, it is often useful to look at other fundamental indicators before entering a trade such as inflation rates and retail sales of each economy. This will often help you in minimizing your losses and averting costly mistakes.
Moreover, the success of any strategy is often the result of the quality of execution in addition to the quality of the strategy itself. Often people make mistakes when implementing strategies, which distorts their outcome, although the results of the back-testing were positive. Thus, it is vital to pay attention to the quality of execution and use wise money management techniques while trading, to ensure a superior outcome.
Author Profile

Fat Finger
My name is Phat Fin Ge, but most people just call me Fat Finger or Mr. Finger.
Many years ago, I was a trader on the Hong Kong Stock Exchange. I became so successful that my company moved me to their offices on Wall Street. The bull market was strong, but my trading gains always outperformed market averages, until that fateful day.
On October 28th, 1929, I tried to take some profits after Charles Whitney had propped up the prices of US Steel. I was trying to sell 10,000 shares, but my fat finger pressed an extra key twice. My sell order ended up being for 1,290,000 shares. Before I could tell anyone it was an error, everyone panicked and the whole market starting heading down. The next day was the biggest stock market crash ever. In early 1930, I was banned from trading for 85 years.
I went back to Hong Kong to work at my family's goldfish store. Please come and visit us at Phat Goldfish in Kowloon, only a 3 minute walk from the C2 MTR entrance.
I thought everyone would forget about me and planned to quietly return to trading in 2015. To my horror, any error in quantity or price which cause a problem kept getting blamed on Fat Finger, even when it was a mix up and not an extra key being pressed. For example, an error by a seller on the Tokyo Stock Exchange was to sell 610,000 shares at ¥6 instead of 6 shares at ¥610,000. That had nothing to do with me or with how fat the trader's finger was, but everyone kept yelling, "Fat Finger! Fat Finger!" In 2016, people blamed a fat finger for a 6% drop in the GBP. It really was a combination of many things, none to do with me or anyone else who had a wider than average finger.
Now that I can trade again, I'm finding forex more interesting than stocks. I've been doing some research on trading forex and other instruments and I'll be sharing it here.
If you see any typing errors, you can blame those on my fat finmgert. If you see any strange changes in price, it's not my fault.
Info
1466 Views 0 CommentsComments
Table of Contents
Recent
-
Bitcoin Fundamental Briefing, March 2024 Demystifying Cryptocurrency Nodes: Deep Dive into Polygon Node Ecosystem Strategies for Trading Forex on a Budget Bitcoin Fundamental Briefing, February 2024 Bitcoin Fundamental Briefing, January 2024 Strategic Asset Allocation Techniques for Currency Traders Bitcoin Fundamental Briefing, December 2023 Bitcoin Fundamental Briefing, November 2023