Decoding Forex: Institutional Insights, Technical Analysis, and Profitable Forex Cashback Strategies

The forex market is the world’s largest financial market, with a daily trading volume of $7.5 trillion as of the last report from the Bank of International Settlements (BIS). Navigating this behemoth of a market can be overwhelming. So, let’s consider how we can gain clarity and perception to improve trading profits and how ArtisGain’s cashback program can enhance your overall performance.
We’re going to examine how traders all over the world, from institutional to retail, use technical analysis to establish entry and exit points. Technical analysis has been used for decades, and with the advent of the personal computer has become more accessible to retail traders also.
Technical analysis uses the principle that human behavior is repetitive. Because of this phenomenon, you can spot repetitive patterns on charts and create indicators that can advise when price levels are overbought or oversold.
There’s more to technical analysis, and we’ll go through it in more detail further down. Another important factor that drives forex price action is that of major institutions that make up the currency market.
The marketplace is made up of many players from a wide variety of backgrounds. Indirect market players include importers, exporters, and asset managers. However, the direct market players, like banks, hedge funds, and other financial institutions, carry the most weight.
These institutions tend to have homogenous views on the forex markets, independently of what their clients might be doing. When specific data hits the headlines, analysts and traders across institutions will usually come to the same conclusions.
Hence creating price pressure for a currency pair as they are mostly on the same side of a trade. We’ll also look at the role of institutional players in more detail further on. For now, let’s get back to the technical analysis of forex markets and how they play a large part in the decision-making process.
The Science Behind Technical Analysis
Based on the earlier-mentioned principle that human behavior is repetitive and that history tends to repeat itself, technical analysis establishes that previous patterns are likely to lead to the same outcomes when they show up.
Efficient market theory tells us that all prices in the market already include all the information available. What we mean here is that any data available is factored into the price, including bullish or bearish sentiment, import and export lows, or central bank activity and comments.
The last comment serves as a basis for technical analysis to be independent of fundamental analysis. This is why sometimes the two analyses may contradict each other. The first comment creates credibility in the reliability of the technical analysis.
There are many types of technical tools; they can be chart patterns that appear on the chart directly or indicators that run on the chart or in another chart below the main one. Some of the most popular and most used chart patterns include:
- Head and shoulders
- Triangle
- Double top or bottom
We have a diverse array of technical indicators, and various analysts put together new ones almost every month. However, the most popular and the most used are still a handful. This is because indicators need a lot of time to show their reliability. Of these, some of the most used include:
- Moving averages
- MACD – Moving Average Convergence Divergence
- RSI – Relative Strength Index
Using technical analysis can greatly improve your market timing for entry and exit and, therefore, your trading returns. Adding ArtsGain to the picture will bring an extra element of performance through our cashback program.
Pattern Examples
H&S
Below is a diagram with an example of a head and shoulders (H&S) pattern. Let’s take note of what a perfect H&S pattern should look like. The left shoulder is lower than the head, and the right shoulder is higher than the left one but lower than the head.
The whole pattern should rest upon an upward-sloping line (black line) known as the neckline, formed by the two troughs of the shoulders. A sell signal is given once the market price breaks below the neckline. However, there may be a retracement after the break, but it should not go above the neckline.

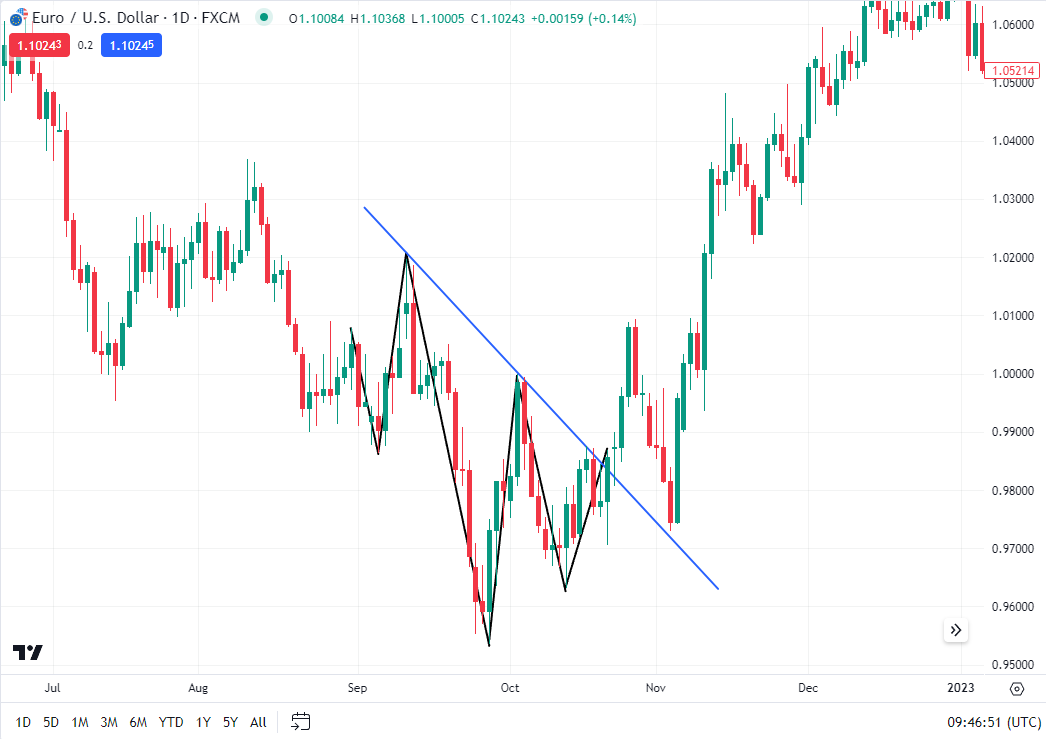
Another version of the H&S is the Inverse H&S, which is the same pattern as the H&S, just turned upside down. It represents a bullish formation if the market price breaks above the neckline. The chart below shows an Inverse H&S in the EURUSD market.
You can see how the market broke above the neckline (blue line), creating a breakout, retraced towards the neckline, and then set off in a bull trend over several weeks.
Triangles
The triangle is another popular chart pattern as it tends to be reliable, especially in longer time frames. The triangle can have any particular shape, as in right-angled or isosceles. The main concept is that when the market breaks out from the shape of the triangle, it’s most likely an indication of further price action in that direction.
The chart below shows the EURUSD where a triangle (highlighted in yellow) formed over several weeks. The triangle came after several weeks of a rally for the euro. When the market broke to the downside of the triangle, a signal was triggered that there would probably be further price action to the downside.

The general consensus of how these patterns are likely to produce the next move in the market helps cement market trends. As mentioned before, many traders, institutional and retail, use technical analysis tools and are seeing the same shapes appear on the chart.
So, we can see how these tools can help improve your decision-making process and create profitable trades. While ArtsGain can help you add profitability to your trading with its cashback program by amplifying your wins and reducing your losses.
Double Bottom or Top
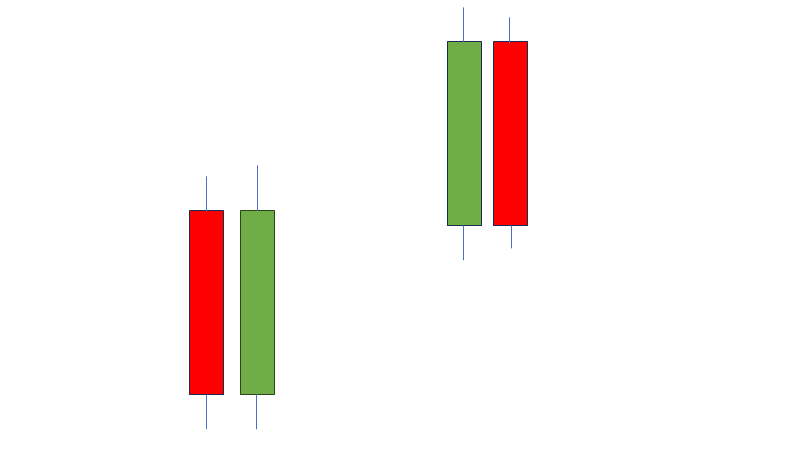
Let’s take a look at another popular chart pattern that is often used to find reversal points, the double top or bottom. This chart pattern is often misunderstood as simply two candles with the same close and open and more or less the same candle length. See the image below:
But it’s a little more sophisticated than that. The double bottom occurs when the market touches a low level, preferably with no previous price action on the chart to the left of the latest candle. The market then bounces off that level for several candles to then return back down.
When the market returns to the low level reached previously, it should not break through the previous low and return trading upwards.
The chart below shows a EURUSD daily chart. The horizontal black line shows where the double bottom occurred and how the market bounces off the same level twice to then move north. The double top works in the same way, only it appears after a bull run when the market reaches a level with no candles to the left of the last candle.

Indicator examples
Moving Averages
There are too many indicators to mention, but without a doubt, the most popular among traders are the three that we mentioned above. Let’s start with the simplest yet also effective; moving average.
The moving average (MA) is calculated by taking a number of closes, say 21, and calculating the average price for the period. It’s then plotted on the chart, and price action above the MA line is considered bullish, while price action below it is considered bearish.
Most traders will add a second MA line to have what is called slow- and fast-moving averages. The chart below shows a 21-period slow MA (light green) and an 8-period fast MA (blue). The fast MA acts as a signal trigger.
When the fast MA crosses above the slow MA, it indicates a buying opportunity. On the other hand, when the fast MA crosses below the slow MA, it indicates there may be more downward action.
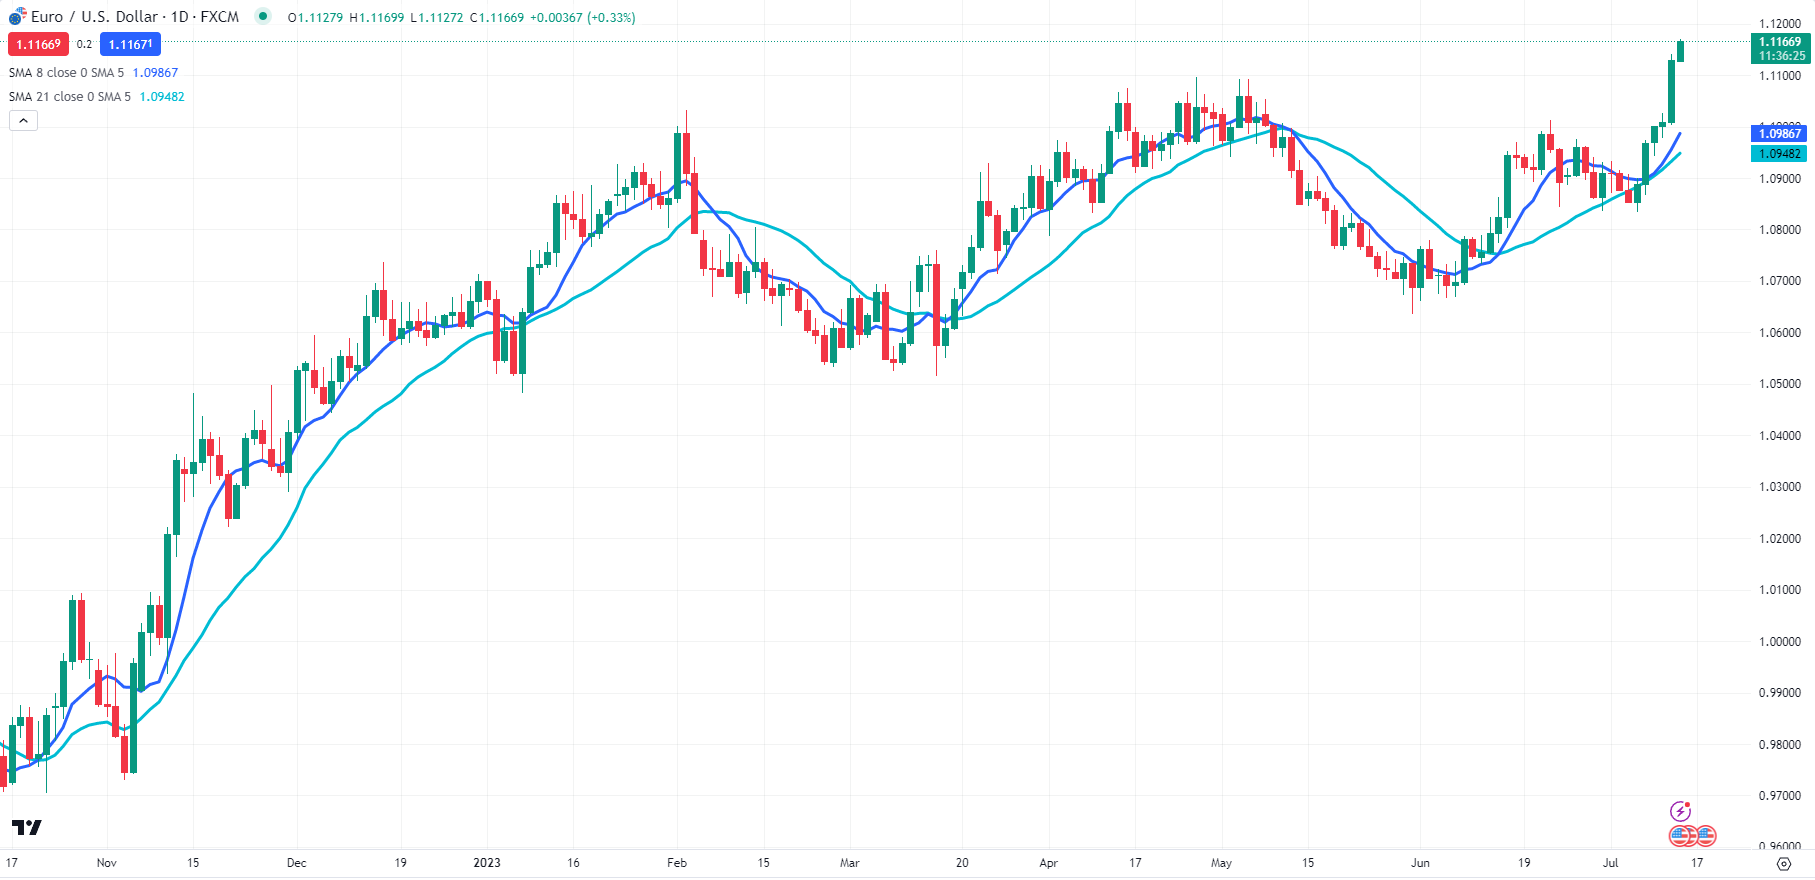
This MA indicator, known as a moving average crossover, tends to work best in trending markets. With sideways markets, you are likely to get a lot of false signals.
Moving Average Convergence Divergence (MACD)
The MACD (pronounced Macadee) is also very popular and is calculated using two exponential moving averages (EMA), typically for 12 and 26 periods. A third line called the signal line, is then calculated using the 9-period EMA of the MACD line.

When the MACD line is above zero and crosses below the signal line, it signals bearish momentum. Reversely, when the MACD line is below zero and crosses above the signal line, it indicates bullish momentum.
The histogram bars are the graphical representation of the MACD line minus the signal line. This number indicates the strength of the momentum and is bullish when the bars are green and bearish when the bars are red.
Adding technical analysis to your trading decisions allows you to improve your win rate, and profit per trade, and decrease your losses. Together with ArtsGain’s cashback program, you can improve all those ratios and gain an edge.
Institutional Impact on the Forex Market
Institutional traders have a massive impact on the forex market and, as we shall see, make up the vast majority of currency trades. Banks and other reporting dealers make up 46% of the market. While other financial institutions contribute 48% of all trades.
The non-financial participants, which include retail traders, make up only 6% of the market. You can see in the chart below how financial institutions are further broken down. Hedge funds also account for 7% of all trades.
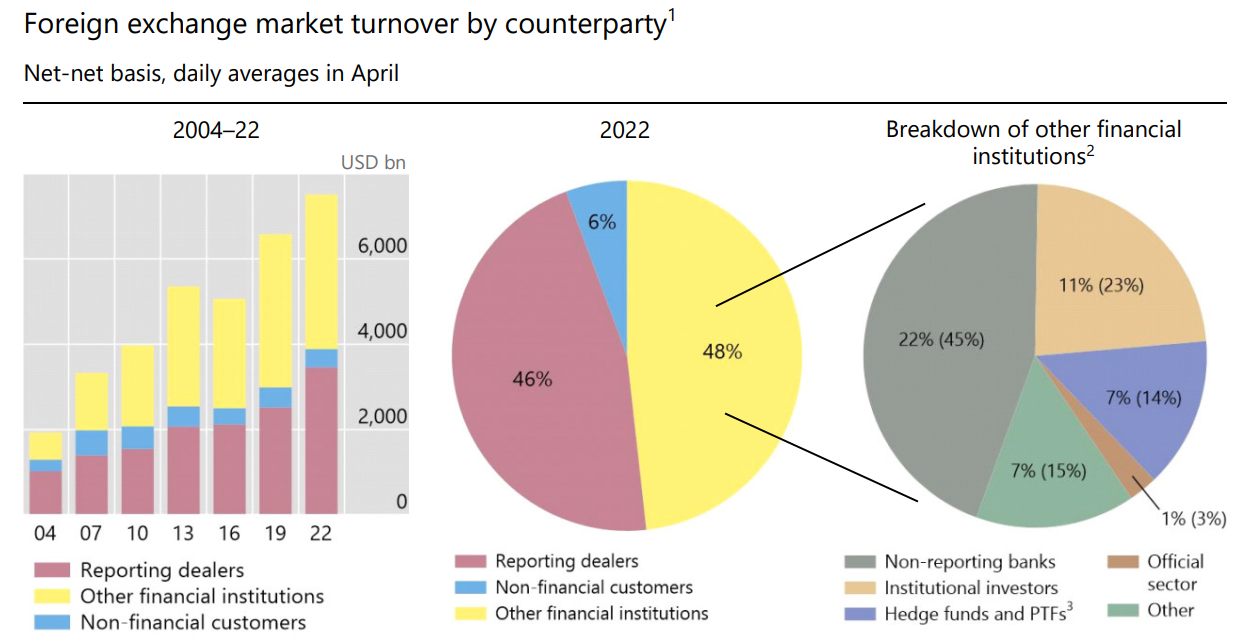
Source BIS Triennial Survey 2022
You can see how financial institutions, in a broad description, are involved in the largest number of trades. Due to their sheer size and the size of their trades, banks and hedge funds are likely to create trends or extend ongoing ones when specific news enters the market.
For example, when employment data is released in the US on the 1st Friday of every month, banks and hedge funds will come to the same conclusion in a very timely fashion. The market will be driven by overall consensus, and retail traders must learn how to follow suit. Unless they simply want to get crushed.
Liquidity and Volatility
The other side of the coin shows how useful some of these institutions are, the dealer banks, also known as market makers, are the ones that provide liquidity. Meaning these institutions supply the market with constant prices for just about any currency pair.
This allows all the other players to be able to place a trade as and when needed, as there will always be a price. Of course, the other side of the coin is that when the type of data mentioned before hits the market, prices tend to jump by many pips with little to no trading.
This is because all the market makers are aware of the effect the new data will have and tend to adjust prices in an exaggerated manner. So, it’s good as these players supply liquidity to the whole market. However, they can also drain it and create spikes of significant volatility.
It’s necessary to be aware of major economic data releases and avoid having trades open as the data is released.
The Psychology of Institutional Trading
Institutional traders manage large positions, and all act according to the same protocol. Risk management, market evaluation, and strategy formulation play a big part in how they enter and exit trades.
Many are also market makers and obligated under normal conditions to quote prices. This is a difficult job but, at the same time, rewarding. To start with, they see all the customer flows. Not all importers and exporters will have the same interests in exchanging currency at the same time.
However, the asset manager clients, which make up a large portion of the market, can give market makers great insight as to where the market might be headed next. When market makers see a consensus in one market, they can also follow suit, further amplifying the trend.
Then, market makers are also rewarded with the bid-offer spread. This creates an income stream that they basically collect from traders. With ArtsGain’s cashback program, you can alleviate the effects of paying the bid-offer spread.
Institutional traders end up being repetitive by nature because of the information they receive and the protocols they must abide by. All data is immediately available to the market in forex. And given the structure of banks and hedge funds, they are likely to come to the same conclusions.
Technical Analysis: A Tool to Track Institutional Activities
The influence of big institutional players in the forex market is undeniable, with a trading volume that can shape market trends and volatility. It’s challenging for retail traders to match the financial firepower of these entities.
However, observing the volume and speed of price change can greatly help retail traders understand when the big guns are in town. A large spike in volume can indicate the current trend may likely continue. In the same way, sharp drops or increases in price levels can also be a warning.
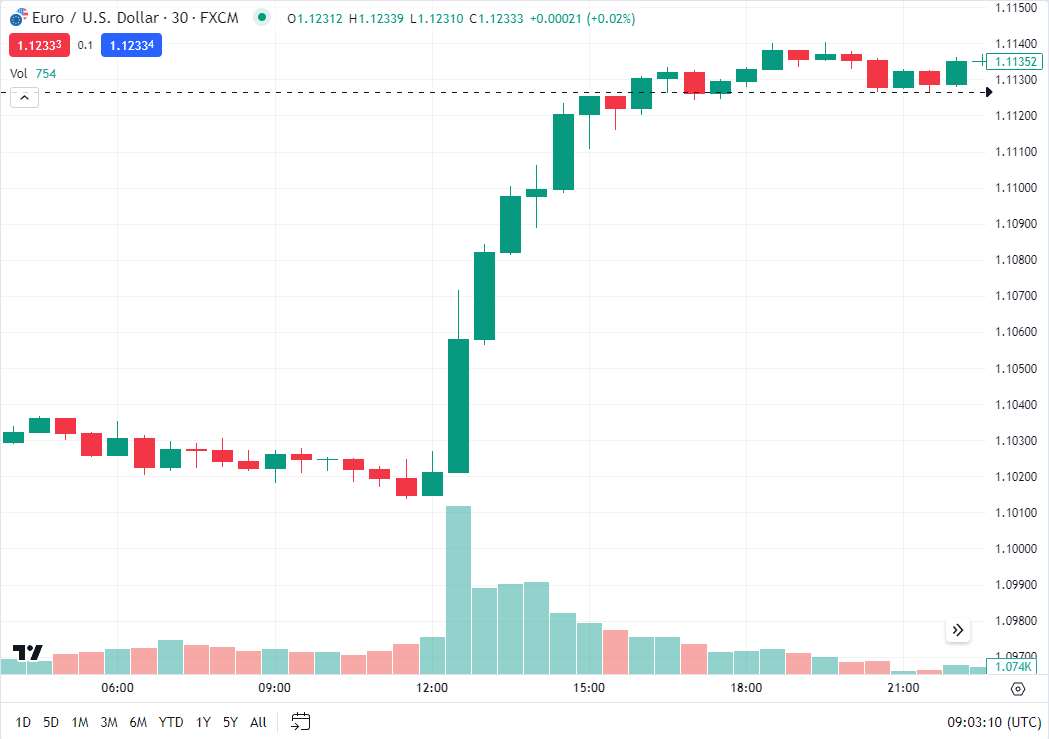
The chart below shows EURUSD 30-minute candles with a volume histogram directly below. We can see that at 12:30 pm GMT, the market shot up after the release of economic news. The volume bar at 12:30 pm is approximately 4 times the average of the previous bars.
There is a clear indication that a lot of traders are stepping up to the plate and that they have plenty of firepower. The higher-than-usual volume continued for several bars, and when volume receded, so did the advance in price for the euro.
You can try to observe and interpret their activities through the lens of technical analysis. Technical analysis can serve as a radar, detecting the tell-tale signs of institutional activities and enabling retail traders to navigate the market effectively.
One common way to detect institutional activity is by studying support and resistance levels. These levels often form when a large number of institutional traders agree on a certain price area, creating a noticeable impact on the price chart.
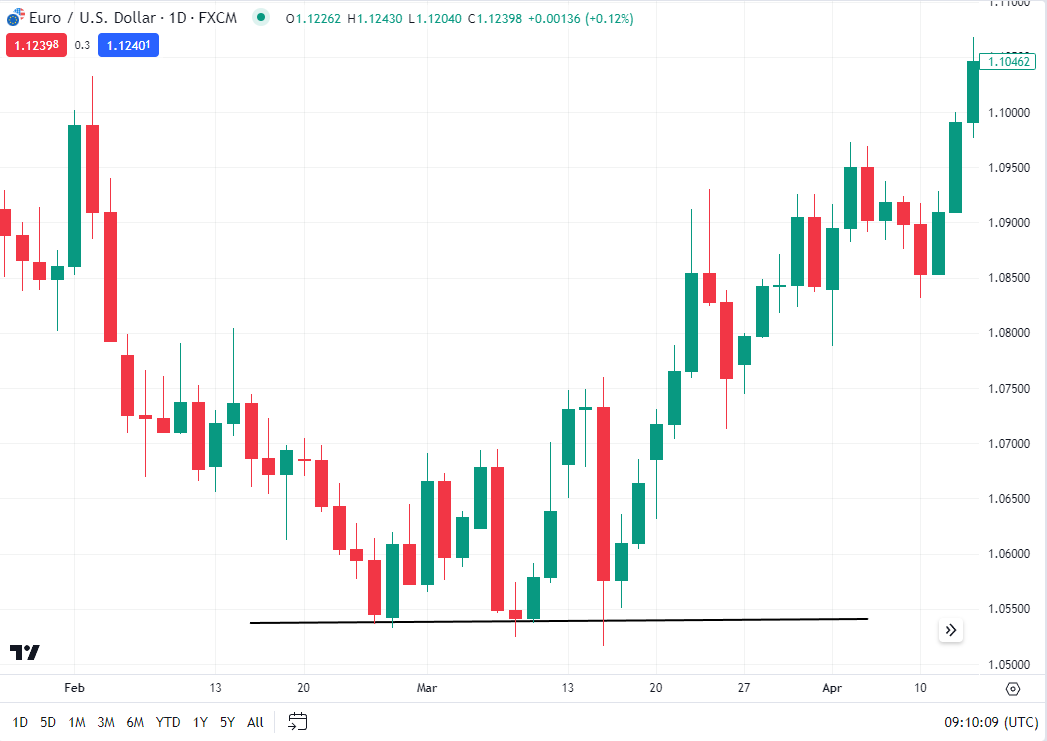
For example, if institutional traders decide to accumulate a large position in a specific currency pair at a particular price point, it could lead to the formation of a support level. This is because each time the price falls to this level, the institutional buying pressure would resist further price drops.
The daily chart for EURUSD below shows a typical example of this type of formation. The black horizontal line shows a level of support that was not broken on 3 attempts. Eventually, the market moved back up again.
In a similar way, the use of technical indicators, such as the MACD or RSI, can hint at institutional activities. Sudden large-scale institutional trading can cause these indicators to move dramatically, providing clues about potential market directions.
Consider a case where the MACD of a currency pair prints a very sharp bullish crossover, where the MACD line crosses way above the signal line. This could be a result of institutional traders initiating large-scale buying, driving up the short-term moving average faster than the long-term moving average.
In another scenario, suppose the RSI of a currency pair rapidly moves above 70, entering overbought levels, and remains there. This could indicate that institutional traders have been aggressively buying, potentially pushing the price into previously unsustainable levels.
Thinking Like an Institutional Trader: A Strategy Guide for Retail Traders
Even though you don’t have the resources offered to institutional traders, you can still navigate the forex market with sophistication and mimic them. The key is to adapt their strategies and mindset to simulate the tactics of these financial juggernauts.
First, a rigorous analysis of the markets, both technically and fundamentally, is crucial. Technical analysis enables you to interpret past market data and identify patterns or trends. Fundamental analysis, on the other hand, helps you understand the broader economic factors that influence currency values.
Rigorous risk management is another fundamental component of trading like an institutional trader. Never expose your portfolio to risks beyond your acceptable limits. A solid risk management strategy involves setting hard stop-loss orders to limit potential losses, taking into account factors like market volatility and your financial capability.
A well-devised trading strategy is as vital as a ship’s compass in the stormy sea of forex trading. Stick to your strategy even when the market seems erratic. Institutional traders are known for their discipline and adherence to their strategies, even when the market moves against them.
Understanding economic data releases and their potential impact on the market is another fundamental aspect of institutional trading. Familiarize yourself with economic calendars, and know when key data like GDP, employment figures, or central bank announcements are due. Understand what these data mean for the currencies you’re trading.
Lastly, remember the golden rule of trading: Trend is your friend. Always trade with the trend and not against it. Trends often reflect the collective activities of institutional traders. Trying to go against these trends can be highly detrimental to your financial health.
Key-terms you should always refer to:
Market Analysis: Conduct both technical and fundamental analysis to understand the market condition and potential trends.
Risk Management: Set a maximum acceptable loss for each trade and set stop-loss orders to ensure you don’t exceed this limit.
Strategy Formulation: Develop a trading strategy based on your analysis and risk tolerance. This could involve identifying potential support & resistance levels or spikes in volume.
Understanding Economic Data: Keep track of important economic data releases and understand how they might impact the market.
Trading with the Trend: Identify the market trend and make trading decisions that align with this trend.
Trade Execution: Execute your trade according to your strategy, ensuring that you’ve placed a stop-loss order.
Post-Trade Evaluation: After the trade, review your decisions and the outcome to learn and improve your future trading.
Trading the Smart Way: Harnessing Technical Analysis and Cashback
Enhancing your trading performance goes beyond just understanding the technical analysis and applying it consistently. There’s an additional layer to the trading equation that can further optimize your trading results – a cashback program, such as the one offered by ArtsGain.
In the world of forex trading, cashback programs serve as a valuable tool to increase your earnings, regardless of whether a trade is profitable or not. These programs allow traders to receive a rebate for their trading volume, which can considerably boost overall trading profitability.
The way this works is simple: for every trade you place, a small portion of the spread or commission is returned to you, hence the term cashback. Think of it as a frequent flyer program for forex traders. The more you trade, the more you earn in cashback.
Implementing a forex cashback program into your trading strategy, like the one offered by ArtsGain, can present several benefits:
- Increased Profitability: Cashback is received for all trades, win or lose. This means that it can provide a buffer against losses and add to your profits.
- Risk Mitigation: By receiving cashback, you can effectively reduce the cost of your trades, lowering your overall trading risk.
- No Restrictions: Cashback is usually provided without any constraints. You can withdraw it or use it for further trading.
- Rewarding Volume Trading: Cashback is given per trade, so high-volume traders can find these programs particularly beneficial.
- Ease of Use: Once set up with your broker, the cashback process typically operates smoothly, with rebates automatically calculated and applied to your account.

By integrating the ArtsGain cashback program into your trading strategy, you can harness the power of technical analysis while also reaping the financial benefits of a cashback program. This combination can lead to more informed trading decisions, a reduction in trading costs, and an overall improvement in trading performance.
Conclusion
Forex trading is an intricate dance between understanding the past, anticipating the future, and acting decisively in the present. Technical analysis emerges as a powerful tool in this dynamic, offering invaluable insights into market patterns and potential future price movements.
The influence of institutional trading on forex markets cannot be overstated. These big players, with their colossal trading volumes, significantly shape market trends, liquidity, and volatility. By harnessing the power of technical analysis, retail traders can learn to follow the footprints of these institutions, identify potential trends and turning points, and trade with increased confidence and foresight.
But technical analysis is not the only arrow in a trader’s quiver. Strategic decisions such as employing rigorous risk management, sticking to a well-formulated trading strategy, understanding key economic data, and trading in line with market trends can also contribute to a successful trading journey.
Furthermore, innovative financial solutions like the ArtsGain cashback program offer an additional avenue for boosting profitability. By integrating such a program into your strategy, you can earn rebates on your trades, effectively reducing trading costs and enhancing overall performance. Learn more about our program on our FAQs page.
Author Profile
ArtisGain.com
Info
586 Views 0 CommentsComments
Table of Contents
Recent
-
Bitcoin Trading Tips for Managing Volatility Bitcoin Fundamental Briefing, May 2024 The Future of Money: How Bitcoin is Changing Personal Finance Skills Bitcoin Fundamental Briefing, April 2024 Bitcoin Fundamental Briefing, March 2024 Demystifying Cryptocurrency Nodes: Deep Dive into Polygon Node Ecosystem Strategies for Trading Forex on a Budget Bitcoin Fundamental Briefing, February 2024