Sive Morten
Special Consultant to the FPA
- Messages
- 18,669
Monthly
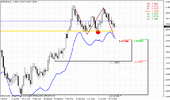
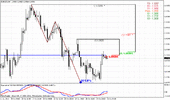
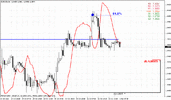
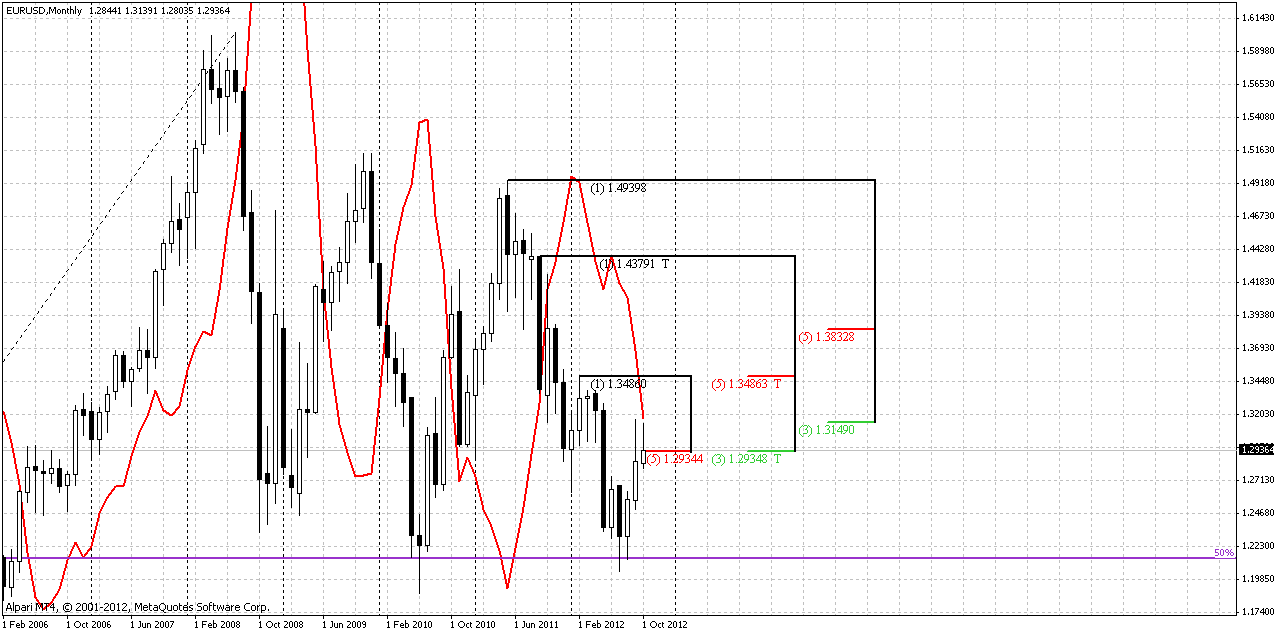
That’s almost the same picture as on previous week. Market shows next regular pullback from Confluence resistance area. Trend holds bearish. October is still an inside month for September bar. All that we can see here is that market stands at long-term strong resistance. And I start to feel that this could be an end of upward retracement. Market still was not able to show higher upward swing, than previous downward one. It must be bear trend is still valid here.
Weekly
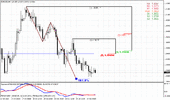
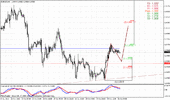
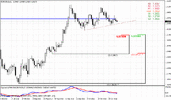
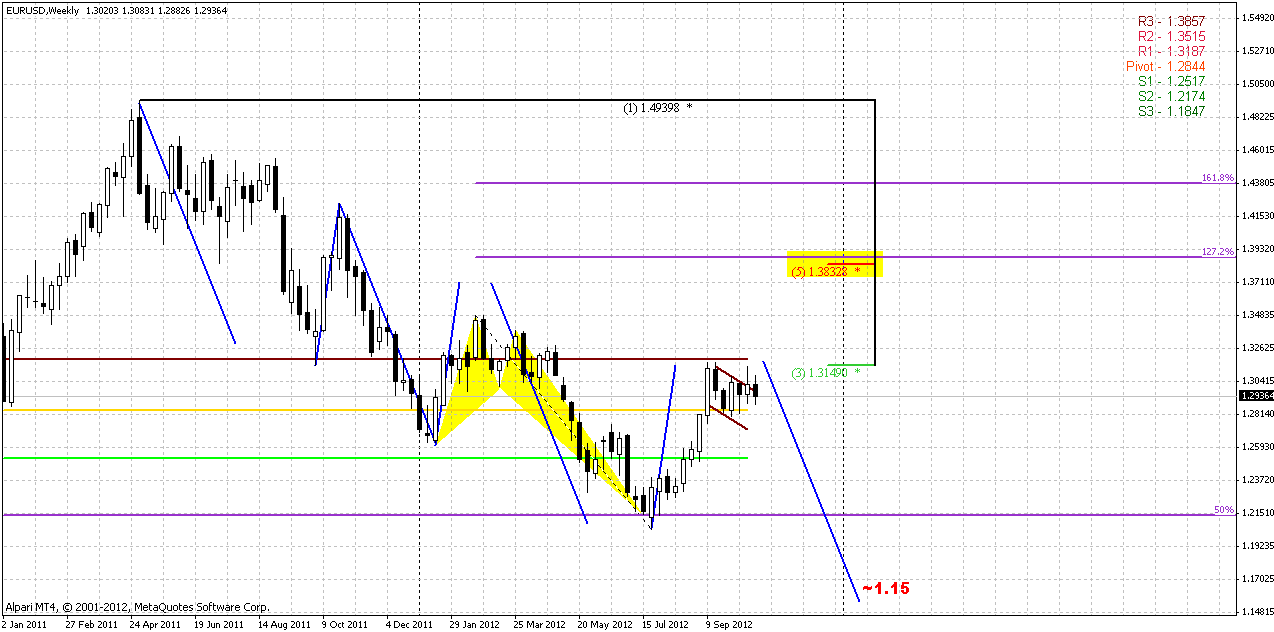
Weekly chart is most interesting at my point of view. I’ve drawn a lot of different stuff here, so let’s get through them. Trend is still bullish at weekly time frame. Market stands at resistance – major 3/8 Fib level and MPR1. First of all let’s talk about former potential bullish flag. I don’t want to rely on it. The price action that has followed to its breakout looks bearish. That is much like classical bullish trap, this is not the way how flag’s breakout should looks like. Probably we could adjust the line so that we have no breakout, but I suppose not in this time. This resistance is absolutely clear on daily time frame. The price return right back in the flag’s body tells that we should be ready for donward move, and this move on weekly time frame could be strong. Flag per se is amount of overlapping bars, some sort of indecision. Usually such stagnation is followed by acceleration and I think that it has more downward chances.
Second moment is MPR1. We know that when market shows retracement on bear trend, usually MPR1 holds it. That has happened.
Finally, take a look at blue lines. They were cloned. Downward swings are cloned from initial swing down, while upward swings from first upward retracement. Take a look what a harmony! Yes, on second couple of swings, upward retracement was slightly smaller, but downward swing was either. If we count both of them from “correct” point (as it shown on the chart), then they will finish in the same point as actual swings. Now we have equal upward retracement completed. If we suggest that this harmony will continue further, market should show swing to ~1.15. When I’ve seen this number, I’m suddenly recalled our quarterly analysis that we’ve done in November 2011 where we said about long-term forecast 1.16.
https://www.forexpeacearmy.com/forex-forum/sives-analysis-archive/17534-forex-pro-weekly-october-31-november-04-2011-a.html
So, may be now it looks not as impossible as it was couple weeks ago... Anyway, guys, I probably more gravitate to conclusion that bears overweight bulls right now.
Daily
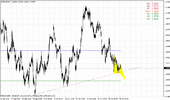
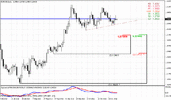
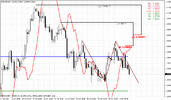
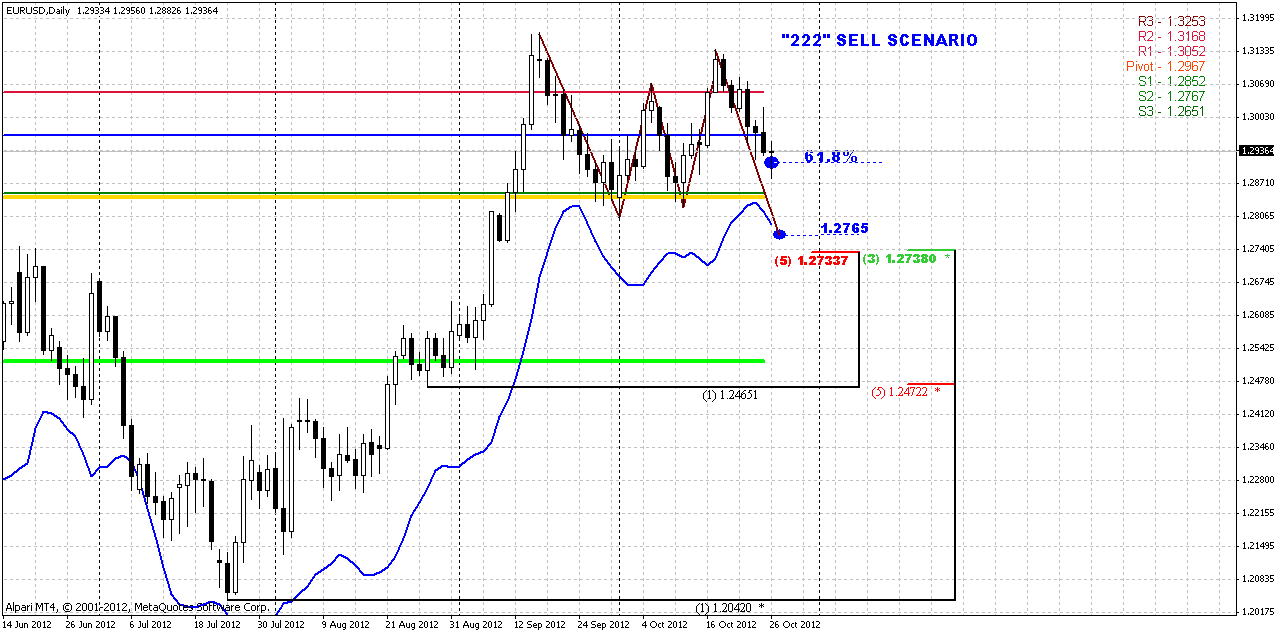
Trend holds bearish here. If you let me, I will not speak about Butterfly “Sell” scenario here that we’ve discussed previously. It probably hardly will come to live in nearest future. Now we see that market stands in progress of downward AB=CD pattern and “222”. It has hit first target – 0.618 extension, we’ve discussed it as well in our daily updates. Next target is 1.2765 that is very close to daily oversold and K-support area. But between current market and this target stands significant support level - WPS1=1.2852 and MPP. That is also previous swing low. Personally I do not like such neighborhood, because it could lead to ping-pong action and probably will demand farer stops if we will decide to enter short.
Speaking about possible bullish development…well, for that we need significant upward acceleration, preferably above WPR1, some unnaturally deep upward retracement after just 0.618 target hitting. Currently I do not see any signs of it.
4-hour
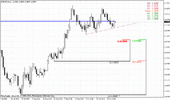
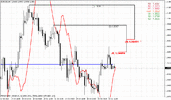
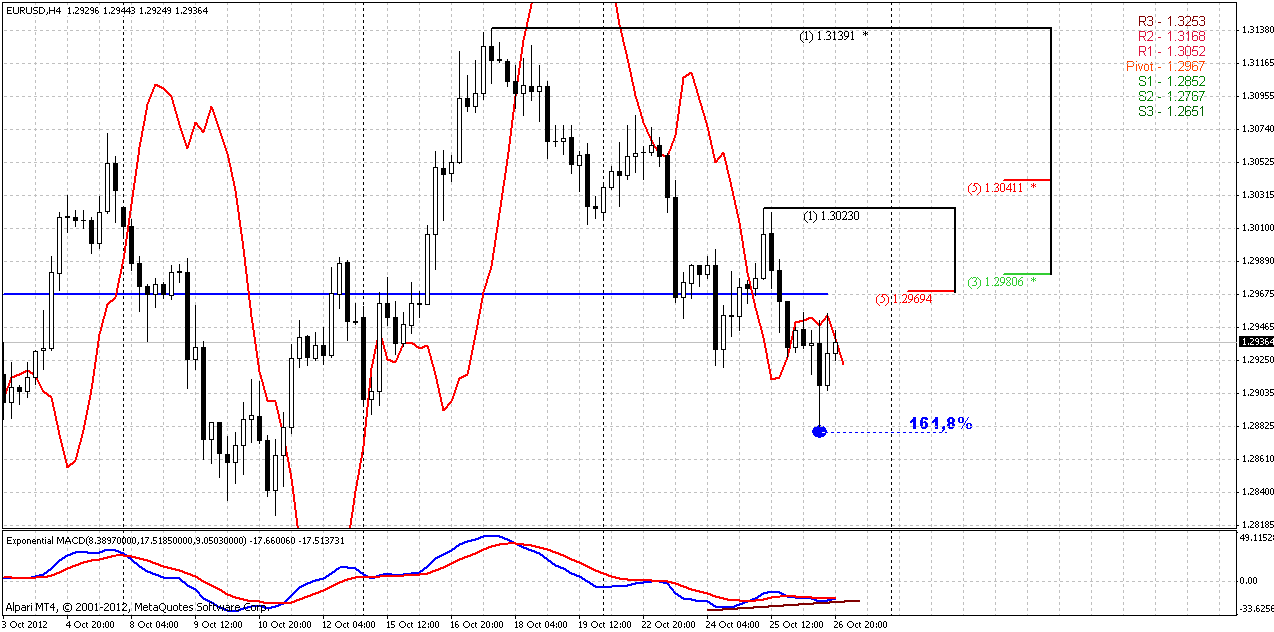
Trend holds bearish here. We have a bit tricky situation. Form one point of view price stands at support and has shown some bounce from daily target in a way of W&R of previous low. From the other side, market has not quite hit 1.618 extension and has formed multiple stop grabbers. So, retracement probably will happen, but has it started already or we will see last leg down first? It is difficult to say something definite. Anyway, first level to watch as significant resistance si 1.2970-1.2980 K-resistance and WPP. Since this is only 0.618 target has been hit on daily, we do not want to see too extended retracement up. Prefferably, if it will finish right around 1.2980 area.
On hourly chart I do not see much to add, only may be divergence is clear looking there.
Conclusion:
In longer term price action does not look bullish. We’ll see, but I suppose that market could start downward continuation.
In short term perspective market stands at support, so, some bounce could follow in the beginning of the week. But it should be too deep up. If it will be the case, then probably we will have to take some pause, because that will be not in a row with overall picture and will tell us that reality is different from our view.
The technical portion of Sive's analysis owes a great deal to Joe DiNapoli's methods, and uses a number of Joe's proprietary indicators. Please note that Sive's analysis is his own view of the market and is not endorsed by Joe DiNapoli or any related companies.
That’s almost the same picture as on previous week. Market shows next regular pullback from Confluence resistance area. Trend holds bearish. October is still an inside month for September bar. All that we can see here is that market stands at long-term strong resistance. And I start to feel that this could be an end of upward retracement. Market still was not able to show higher upward swing, than previous downward one. It must be bear trend is still valid here.

Weekly
Weekly chart is most interesting at my point of view. I’ve drawn a lot of different stuff here, so let’s get through them. Trend is still bullish at weekly time frame. Market stands at resistance – major 3/8 Fib level and MPR1. First of all let’s talk about former potential bullish flag. I don’t want to rely on it. The price action that has followed to its breakout looks bearish. That is much like classical bullish trap, this is not the way how flag’s breakout should looks like. Probably we could adjust the line so that we have no breakout, but I suppose not in this time. This resistance is absolutely clear on daily time frame. The price return right back in the flag’s body tells that we should be ready for donward move, and this move on weekly time frame could be strong. Flag per se is amount of overlapping bars, some sort of indecision. Usually such stagnation is followed by acceleration and I think that it has more downward chances.
Second moment is MPR1. We know that when market shows retracement on bear trend, usually MPR1 holds it. That has happened.
Finally, take a look at blue lines. They were cloned. Downward swings are cloned from initial swing down, while upward swings from first upward retracement. Take a look what a harmony! Yes, on second couple of swings, upward retracement was slightly smaller, but downward swing was either. If we count both of them from “correct” point (as it shown on the chart), then they will finish in the same point as actual swings. Now we have equal upward retracement completed. If we suggest that this harmony will continue further, market should show swing to ~1.15. When I’ve seen this number, I’m suddenly recalled our quarterly analysis that we’ve done in November 2011 where we said about long-term forecast 1.16.
https://www.forexpeacearmy.com/forex-forum/sives-analysis-archive/17534-forex-pro-weekly-october-31-november-04-2011-a.html
So, may be now it looks not as impossible as it was couple weeks ago... Anyway, guys, I probably more gravitate to conclusion that bears overweight bulls right now.

Daily
Trend holds bearish here. If you let me, I will not speak about Butterfly “Sell” scenario here that we’ve discussed previously. It probably hardly will come to live in nearest future. Now we see that market stands in progress of downward AB=CD pattern and “222”. It has hit first target – 0.618 extension, we’ve discussed it as well in our daily updates. Next target is 1.2765 that is very close to daily oversold and K-support area. But between current market and this target stands significant support level - WPS1=1.2852 and MPP. That is also previous swing low. Personally I do not like such neighborhood, because it could lead to ping-pong action and probably will demand farer stops if we will decide to enter short.
Speaking about possible bullish development…well, for that we need significant upward acceleration, preferably above WPR1, some unnaturally deep upward retracement after just 0.618 target hitting. Currently I do not see any signs of it.

4-hour
Trend holds bearish here. We have a bit tricky situation. Form one point of view price stands at support and has shown some bounce from daily target in a way of W&R of previous low. From the other side, market has not quite hit 1.618 extension and has formed multiple stop grabbers. So, retracement probably will happen, but has it started already or we will see last leg down first? It is difficult to say something definite. Anyway, first level to watch as significant resistance si 1.2970-1.2980 K-resistance and WPP. Since this is only 0.618 target has been hit on daily, we do not want to see too extended retracement up. Prefferably, if it will finish right around 1.2980 area.
On hourly chart I do not see much to add, only may be divergence is clear looking there.

Conclusion:
In longer term price action does not look bullish. We’ll see, but I suppose that market could start downward continuation.
In short term perspective market stands at support, so, some bounce could follow in the beginning of the week. But it should be too deep up. If it will be the case, then probably we will have to take some pause, because that will be not in a row with overall picture and will tell us that reality is different from our view.
The technical portion of Sive's analysis owes a great deal to Joe DiNapoli's methods, and uses a number of Joe's proprietary indicators. Please note that Sive's analysis is his own view of the market and is not endorsed by Joe DiNapoli or any related companies.
