- Forex, Gold, BTC Market Analysis | Trading Signals
- Sive Morten- Currencies, Gold, Bitcoin Daily Video
You are using an out of date browser. It may not display this or other websites correctly.
You should upgrade or use an alternative browser.
You should upgrade or use an alternative browser.
FOREX PRO WEEKLY October 21-25, 2013
- Thread starter Sive Morten
- Start date
SonicYouth
Private
- Messages
- 16
Nice analyses there Sive!
I've been developing a new fibonacci method for the last 3 years and I am looking forward to sharing with everyone here on FPA very soon.
What is very interesting about my method is that it generally coincides with your analyses.
About medium/long term my method provides me with the following important levels:
- Support area: 1.3580 / 1.35982
- Main target: 1.37381 / 1.37624
I am also expecting a pullback before main target is reached.
Main spike got around my first main target. Second target was reached and after 2 or 3 attempts it was broken. Next OSA Fibo (the indicator I am about to introduce to you) resistance levels are 1.38305 / 1.38346.
Let's see how market interacts with them! Let's also see if dailly bar closes above 1.37624.
SonicYouth
Private
- Messages
- 16
I'm sorry, maybe I am flooding a bit this topic but I really am an enthusiast
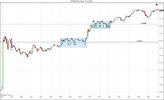
In this image you see the price interaction with my levels. Feel free to tell me if you think this is just pure coincidence or if it seems to you that the market interacts with my levels in a special way.View attachment 11785
How do you get this levels?
SonicYouth
Private
- Messages
- 16
How do you get this levels?
I am unemployed so I have much time to think. For the last 3 years I studied 123 patterns and the way fibo levels works with them. I am working on a video to post here so you can learn my method.
I am unemployed so I have much time to think. For the last 3 years I studied 123 patterns and the way fibo levels works with them. I am working on a video to post here so you can learn my method.
123 break? Joe Ross?
Lolly Tripathy
Sergeant Major
- Messages
- 515
thank you very much sive sir..
i am really very happy..
i am really very happy..
Hello
As Sive stated today it is not for long although spike is possible...
First would like to share big picture: on 6M clearly one wave from 1,2042 bottom, Q shows there was something going on and cooking in the move but no swings yet, M has swings which must be analysed
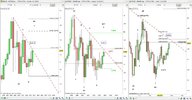
Weekly: same move up on M from 1,2042 low - two possible structures; I except both for my analysis and in near future will be clear which one will be in play; move down from 1,3711 high = question = phony impulse? = I take it as corrective wave; last move up from 1,2745 low I understand as Zig Zag pattern and can be treated either as normal Zig Zag (left) either as Zig Zag with motive wave as ending diagonal C leg (right); in this moment cannot tell which structure is in play but I am more enthusiastic for second (right) option
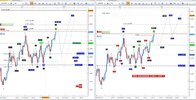
Daily (just last leg from 1,3103 low):
- left weekly option,where C leg is growing has 2 possible development on daily = motive wave as either impulse either as ending diagonal
- right weekly option where 3rd wave of ED is growing has to be ZigZag pattern so expected structure is ABC and C can be either impulse either ending diagonal and even double ZigZag could develop (take a look at right previous picture!!)
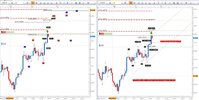
And here is the catch because both options started development same and soon price action will tell which structure will create following price action and moves. It is time to switch to H4 and H1 and wait if not in trade yet; atm we are in the middle so patience is the most important.
I am sure I have not told everything I intended and would like to but hope enough for now and will be glad to answer to your questions, observations, suggestions,if any (* added).
Good trading!
As Sive stated today it is not for long although spike is possible...
First would like to share big picture: on 6M clearly one wave from 1,2042 bottom, Q shows there was something going on and cooking in the move but no swings yet, M has swings which must be analysed

Weekly: same move up on M from 1,2042 low - two possible structures; I except both for my analysis and in near future will be clear which one will be in play; move down from 1,3711 high = question = phony impulse? = I take it as corrective wave; last move up from 1,2745 low I understand as Zig Zag pattern and can be treated either as normal Zig Zag (left) either as Zig Zag with motive wave as ending diagonal C leg (right); in this moment cannot tell which structure is in play but I am more enthusiastic for second (right) option

Daily (just last leg from 1,3103 low):
- left weekly option,where C leg is growing has 2 possible development on daily = motive wave as either impulse either as ending diagonal
- right weekly option where 3rd wave of ED is growing has to be ZigZag pattern so expected structure is ABC and C can be either impulse either ending diagonal and even double ZigZag could develop (take a look at right previous picture!!)

And here is the catch because both options started development same and soon price action will tell which structure will create following price action and moves. It is time to switch to H4 and H1 and wait if not in trade yet; atm we are in the middle so patience is the most important.
I am sure I have not told everything I intended and would like to but hope enough for now and will be glad to answer to your questions, observations, suggestions,if any (* added).
Good trading!
Last edited:
Similar threads
- Replies
- 7
- Views
- 241
- Replies
- 5
- Views
- 188
- Replies
- 7
- Views
- 127
- Replies
- 10
- Views
- 238
- Replies
- 8
- Views
- 266
- Forex, Gold, BTC Market Analysis | Trading Signals
- Sive Morten- Currencies, Gold, Bitcoin Daily Video
