Sive Morten
Special Consultant to the FPA
- Messages
- 18,669
Monthly
As markets have got relief from government and gradually return to their own, EUR has continued an aprreciation. In short-term perspective it looks cloudless, but on longer term there are some risk factors that could lead to significant changes. Yes, turmoil around debt ceil has finished (at least till December), but we still have unreleased NFP report and that is more important – FOMC meeting on 30th of October. This is in fact major risk factor. Fed even will not need to announce QE contraction. On current stage it will be significant just to hint on it, slightly change a rethoric that will assume increasing probability of QE contraction and that could stop USD fall. The reason, why I’ve thought about it is a picture on JPY, particularly on weekly chart. If you will take a look at it, you’ll see simmetrical triangle after significant thrust up and bullish dynamic pressure. Trend on weekly JPY holds bearish by MACD, but price action does not drop and continues to form higher lows. Well, Yen itself could be a reason for that, not neccesary it has to be dollar, but who knows. If it will be a dollar, then EUR/USD appreciation will get some problems. Second reason – recall our long-term analysis of GBP that we’ve done in our Forex Military School in chapters dedicated to Elliot Waves analysis. Please, re-read it. Currently we stand in 4th big correction wave. It has changed a bit the shape since our analysis, but the function of this wave is still the same. In two words speaking, current move up could be a final splash in 4th wave and after that downward continuation all time thrust down should happen as a 5th wave. Our forum member Minimax, as an expert on Elliot waves probably could clarify this better. https://www.forexpeacearmy.com/forex-forum/chapter-16/17463-chapter-16-part-v-trading-elliot-waves.html We’ve made it 2 years ago and now it is approaching to culmination.
Despite how it will turn, this is a moment, that we should keep in mind and having potentially contradictive situation on another pair. In such circumstances I do not see much reasons to plan action far ahead. Better to focus on perspective of next week.
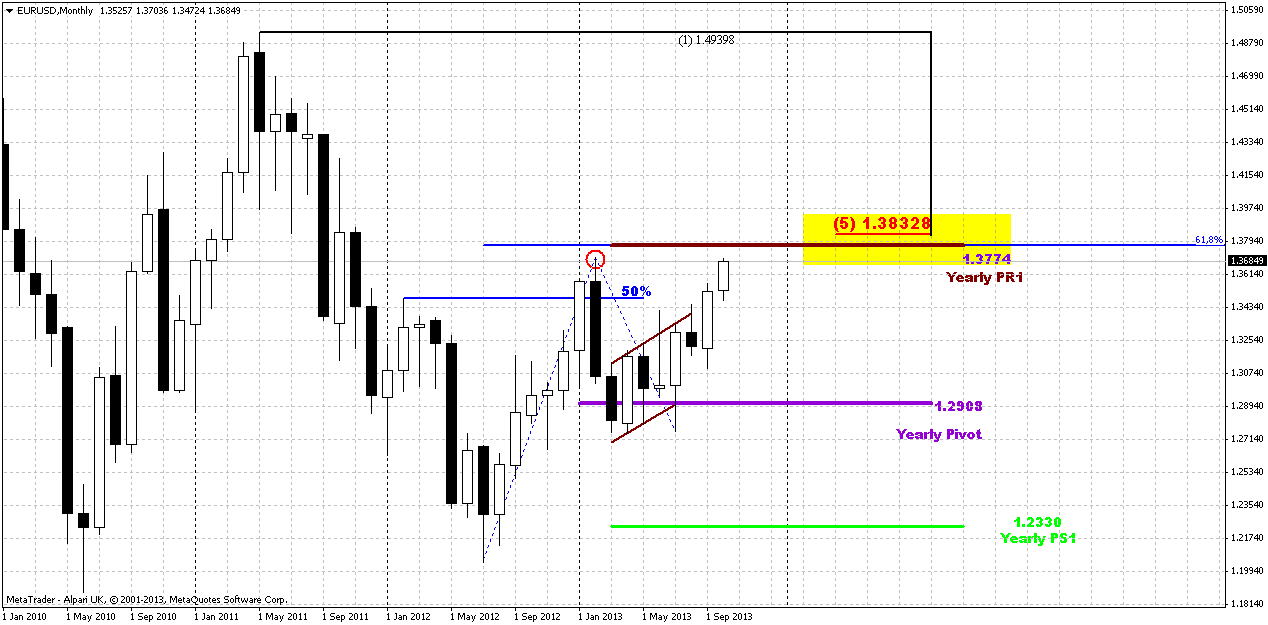
Monthly chart looks so as if there was no debt ceil turmoil at all. It just continues with our analysis that suggests move to yearly pivot resistance 1. As market has held above yearly pivot and passed through previous high and broken flag in opposite direction, 2-3 weeks ago we’ve made a suggestion that upward action should continue probably. And that is what we see now. Yesterday price has stopped within 7 pips from previous highs and hardly market will leave them intact. Our target that includes yearly pivot resistance 1, minor 0,618 AB=CD target and major 5/8 Fib resistance at 1.3830 makes us think that market still have ~250 pips of cloudless upside potential. But then, I suspect, the moment when it will reach this target will coincide with FOMC meeting. And then we will see, what will happen next...
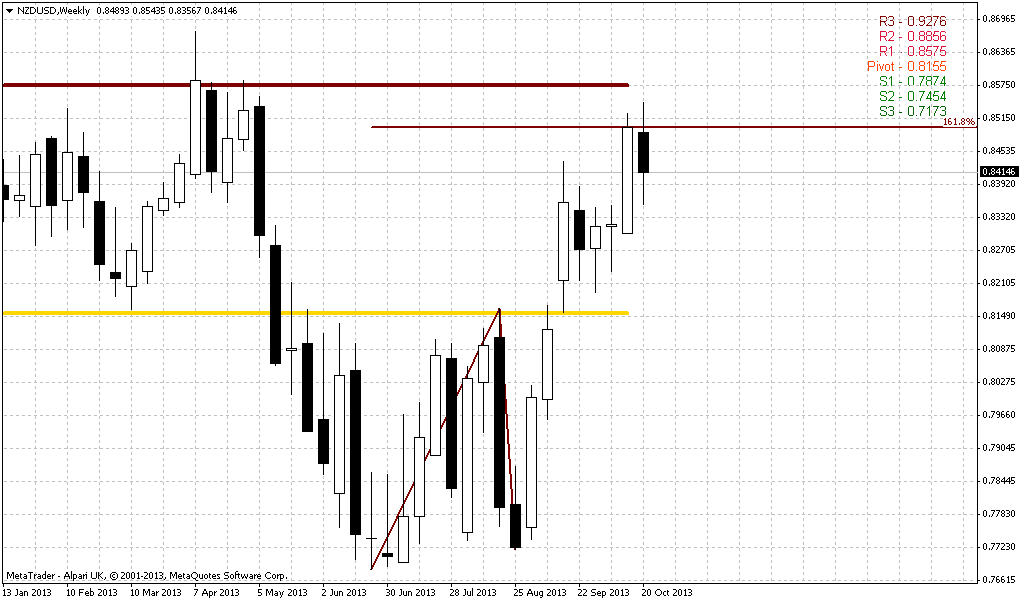
Weekly
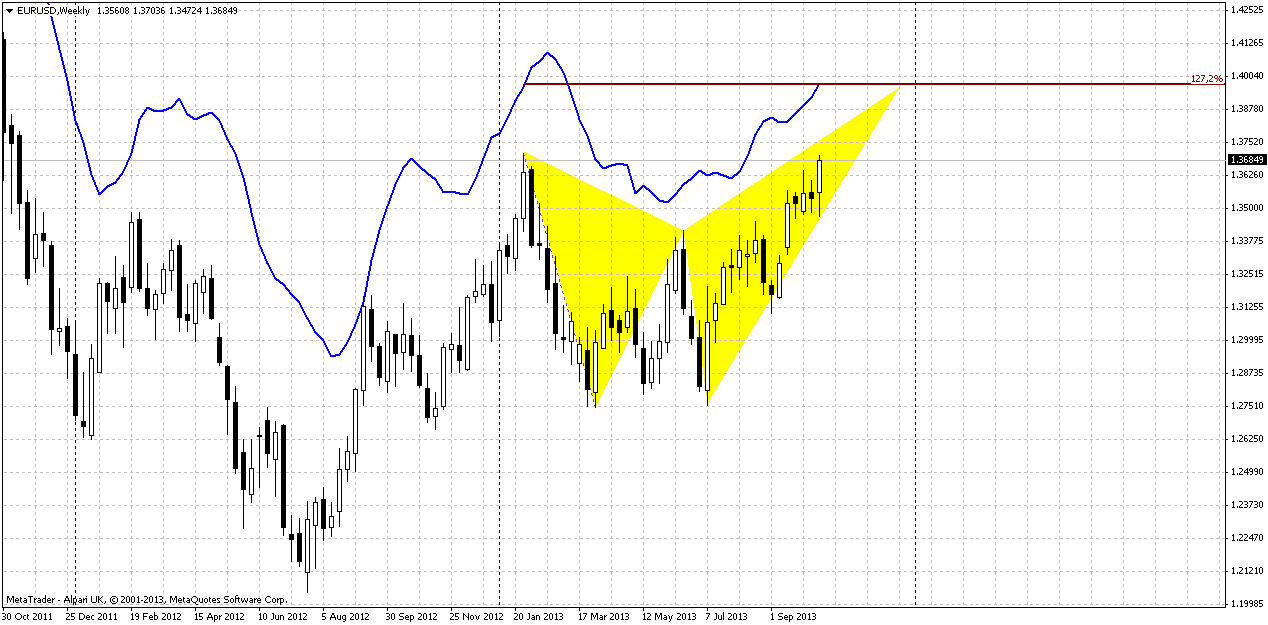
Weekly chart gives us slightly higher beacon – 1.27 target of Butterfly around 1.40 level. Trend holds bullish here. If we check the level of piercing of yearly pivot point, then we’ll see that 50-100 pips is not very significant distance for monthly chart. Thus, market still could accomplish this pattern and yearly pivot resitance 1 will still valid.
Here is another moment that is interesting within a context that we’ve specified above. I mean JPY and other thoughts. Why market continues move up here by reversal patttern? Other words, appearing of reversal pattern here is a warning sign that is fatefully agrees with our suspicions concerning possible stopping of upward action.
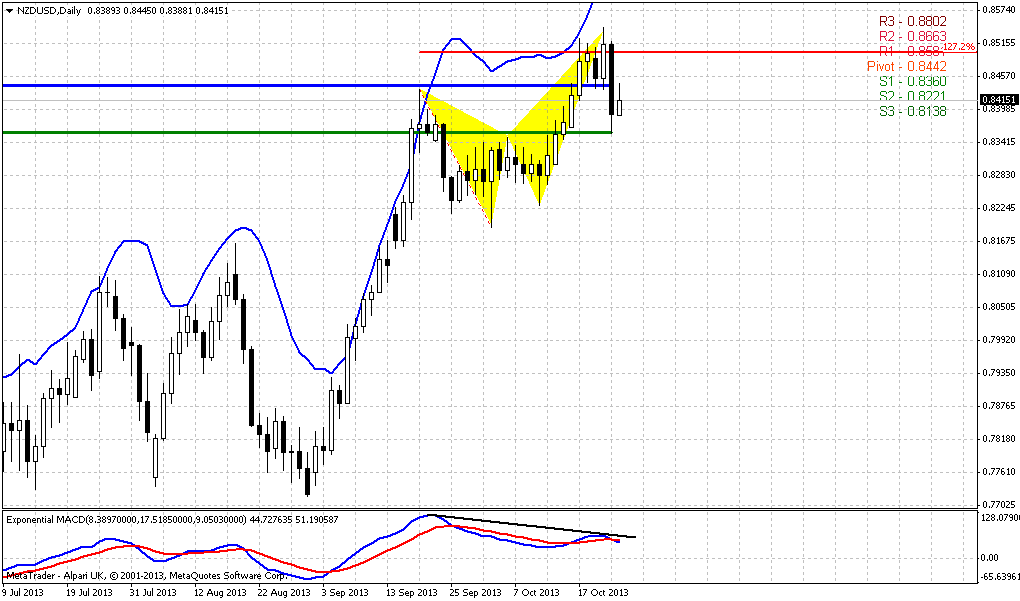
Daily
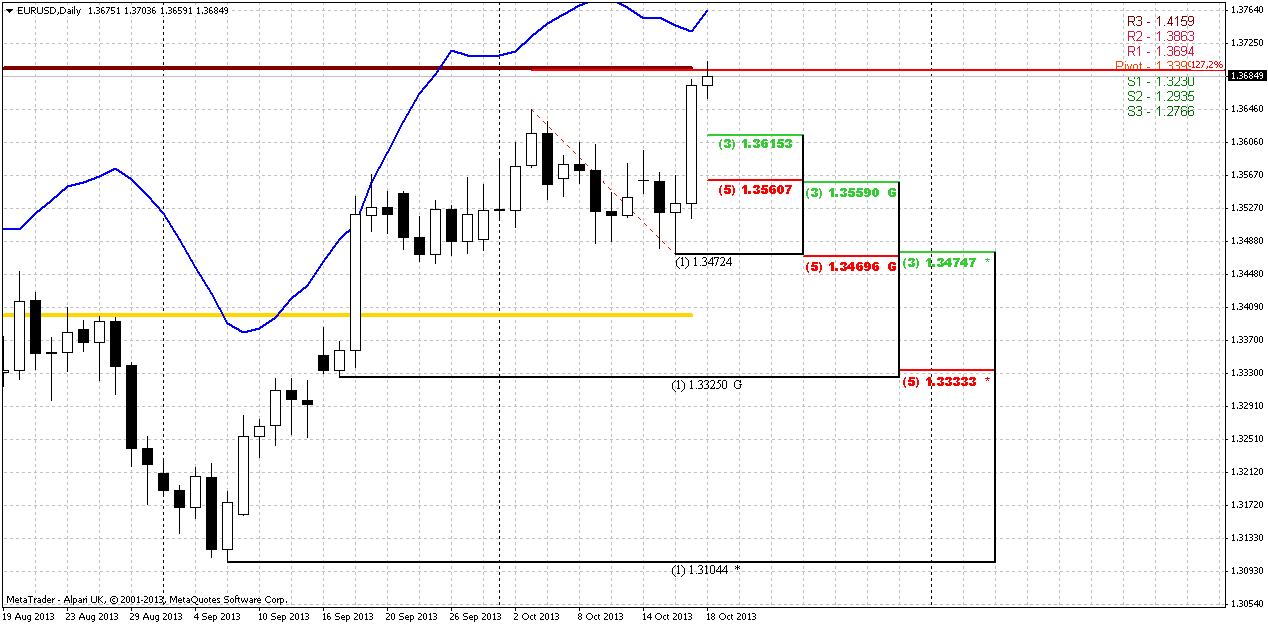
Now, as we have bullish setup for coming week at least, or may be even for a bit longer period, let’s see how we can take a position. Trend has turned bullish here and market is not at overbought. In fact it has ~ 100 pips handicap on Monday. Thus, as nothing presses on market right now, and as market just has passed through previous highs, we should not get too extended retracement down. If market has not shown retracement to 1.3470 K-support area when H&S pattern was in progress, then hardly it will start it right now. Thus, the most reasonable levels of retracement are 1.3615 nearest Fib level and 1.3560 K-support. They are reasonable. Any deeper move down will put under question whole recent thrust up and if market will reach next K-support, it will erase move up totally. So, if real bullish power exists here, we do not want to see this deep move, only to 1.3560 as maximum.
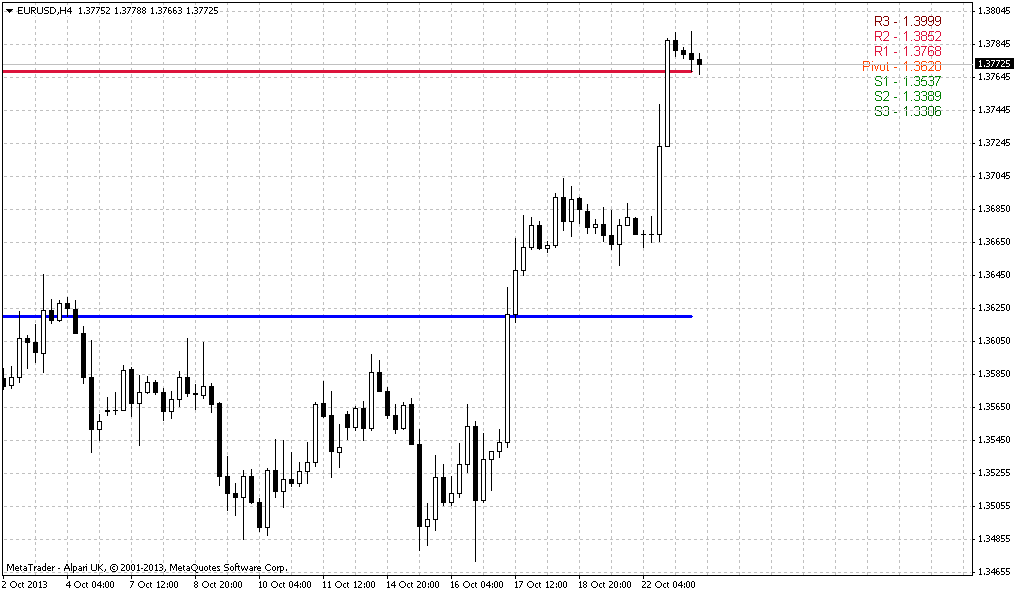
4-hour
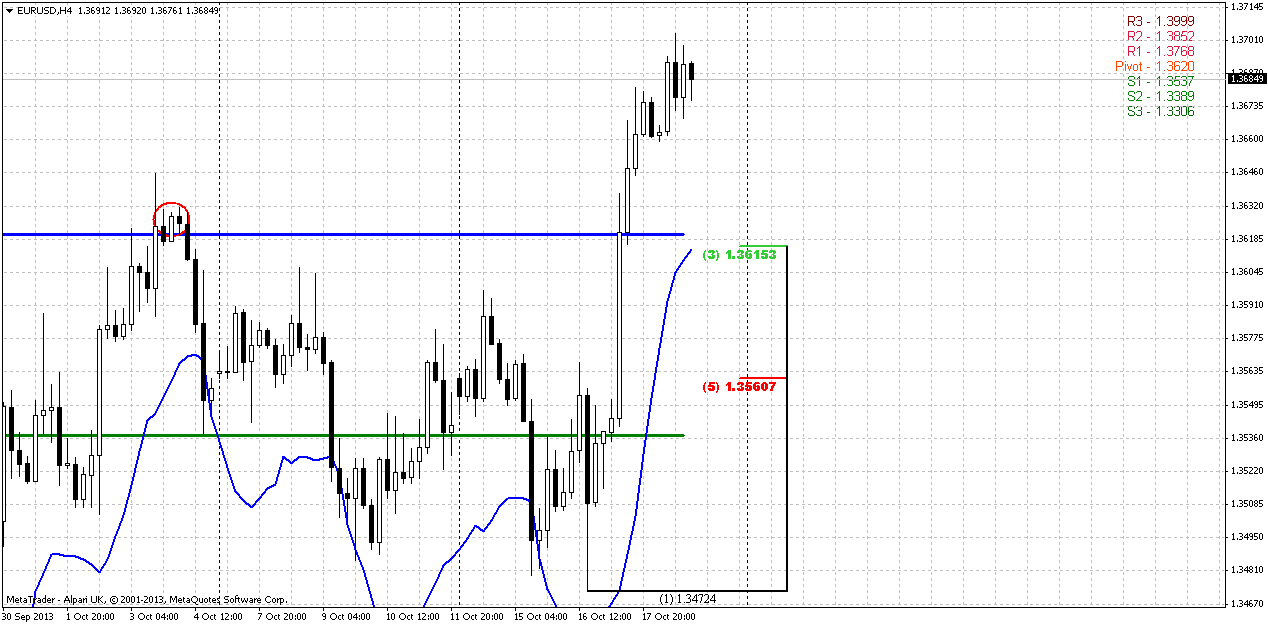
Here we have another great assistance. Market will open above WPP and retracement right down to it has solid odds. Interestingly that our first Fib support coinsides with WPP, previous broken highs and 4-hour oversold level. Personally I do not look at intraday OB/OS levels very often, but as you, guys, have asked me to show it, then I fulfill your request. What does it mean? It means that we probably should take some part of long position right at 1.36-1.3615, because some bounce will happen after it, or even market will continue move up. Also, by this picture now we know that reaching of 1.3560 K-support level will be possible by only compounding retracement down, for example in the shape of AB=CD. Because market will have to at least bounce up from 1.3615. And if deeper retracement will follow, this bounce should become a BC leg of potential downward AB=CD. WPS1, by the way, also important and stands slightly lower then daily K-support area.
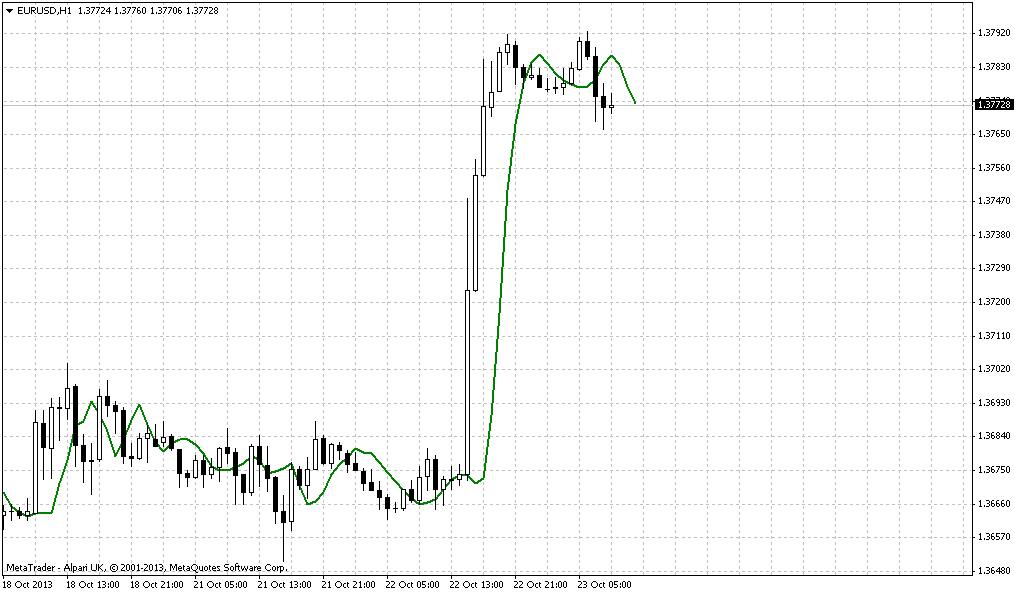
60-min
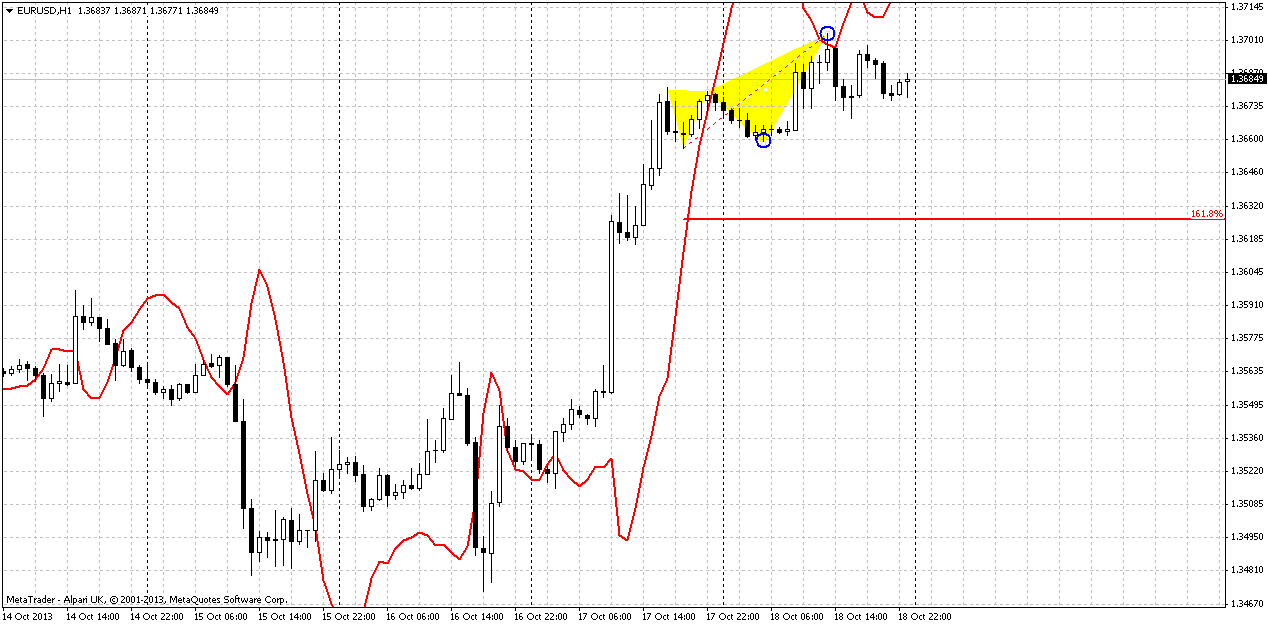
Well, here guys, to be honest, I see nothing really valuable, just some hints. Thus, our Friday butterfly has done well and market has hit our previous week target. The ultimate target to the downside of the same butterfly stands at 1.3625 – area around broken highs. Also, we have very short-term bearish stop grabber here, that suggests taking out 1.3660 butterfly’s lows. So, as you can see hints are not superb, but they give a bit more confidence that price will have chances to reach at least 1.3615 support by possible retracement down.
Conclusion:
Longer term perspective stands under curtain of nearest FOMC meeting and possible end of USD weakness. Still, market has ~250 pips of free space to upside and we will try to use them.
There are two suitable levels for long entry on Monday – 1.3615 and 1.3560 and some part of total position should be taken at nearest one, because currently it is unclear whether market will proceed to 1.3560 or not. You may add more, if this will happen. At the same time, as market is not at overbought we do not want to see deeper retracement down. Also, as usual, we do not want to see nasty black candles within our retracement. Do not enter Long, if you will see them. Upward target will stand in the range of 1.38-1.40 probably, depending on what patterns market will form there. Now we have just levels on monthly chart and butterfly “Sell” on weekly as beacons.
The technical portion of Sive's analysis owes a great deal to Joe DiNapoli's methods, and uses a number of Joe's proprietary indicators. Please note that Sive's analysis is his own view of the market and is not endorsed by Joe DiNapoli or any related companies.
As markets have got relief from government and gradually return to their own, EUR has continued an aprreciation. In short-term perspective it looks cloudless, but on longer term there are some risk factors that could lead to significant changes. Yes, turmoil around debt ceil has finished (at least till December), but we still have unreleased NFP report and that is more important – FOMC meeting on 30th of October. This is in fact major risk factor. Fed even will not need to announce QE contraction. On current stage it will be significant just to hint on it, slightly change a rethoric that will assume increasing probability of QE contraction and that could stop USD fall. The reason, why I’ve thought about it is a picture on JPY, particularly on weekly chart. If you will take a look at it, you’ll see simmetrical triangle after significant thrust up and bullish dynamic pressure. Trend on weekly JPY holds bearish by MACD, but price action does not drop and continues to form higher lows. Well, Yen itself could be a reason for that, not neccesary it has to be dollar, but who knows. If it will be a dollar, then EUR/USD appreciation will get some problems. Second reason – recall our long-term analysis of GBP that we’ve done in our Forex Military School in chapters dedicated to Elliot Waves analysis. Please, re-read it. Currently we stand in 4th big correction wave. It has changed a bit the shape since our analysis, but the function of this wave is still the same. In two words speaking, current move up could be a final splash in 4th wave and after that downward continuation all time thrust down should happen as a 5th wave. Our forum member Minimax, as an expert on Elliot waves probably could clarify this better. https://www.forexpeacearmy.com/forex-forum/chapter-16/17463-chapter-16-part-v-trading-elliot-waves.html We’ve made it 2 years ago and now it is approaching to culmination.
Despite how it will turn, this is a moment, that we should keep in mind and having potentially contradictive situation on another pair. In such circumstances I do not see much reasons to plan action far ahead. Better to focus on perspective of next week.
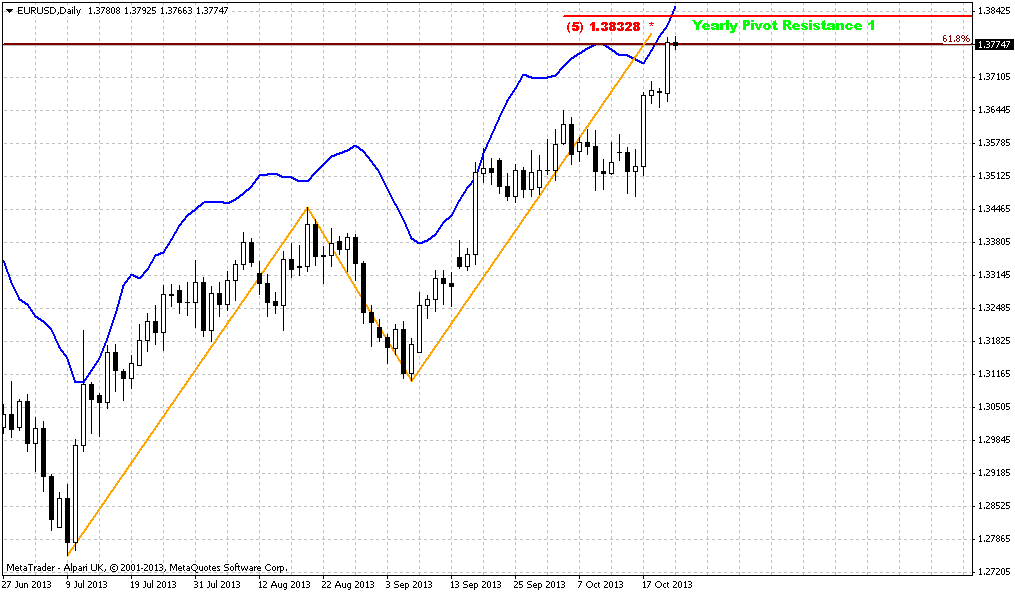
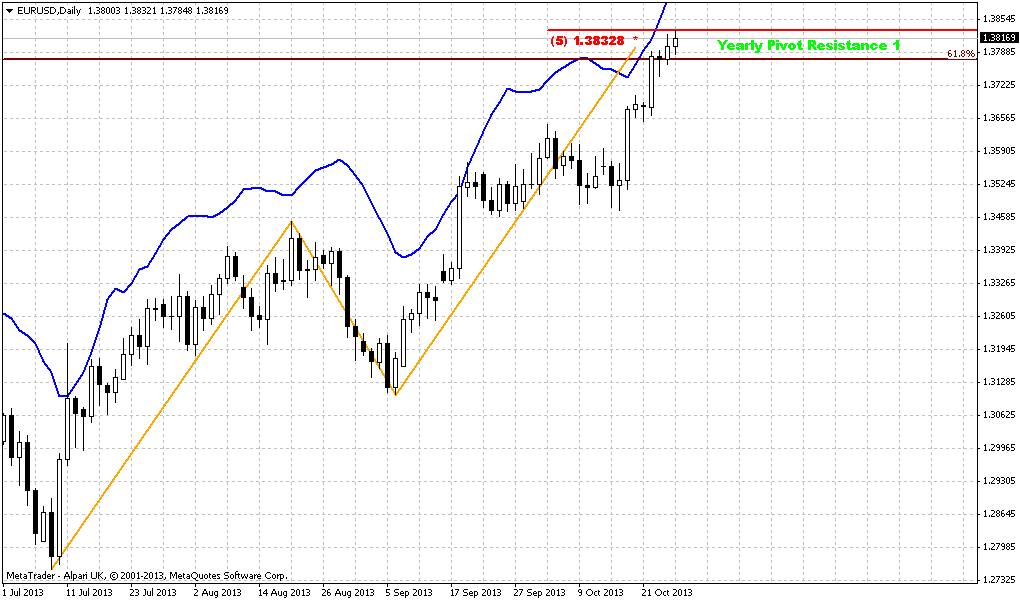
Monthly chart looks so as if there was no debt ceil turmoil at all. It just continues with our analysis that suggests move to yearly pivot resistance 1. As market has held above yearly pivot and passed through previous high and broken flag in opposite direction, 2-3 weeks ago we’ve made a suggestion that upward action should continue probably. And that is what we see now. Yesterday price has stopped within 7 pips from previous highs and hardly market will leave them intact. Our target that includes yearly pivot resistance 1, minor 0,618 AB=CD target and major 5/8 Fib resistance at 1.3830 makes us think that market still have ~250 pips of cloudless upside potential. But then, I suspect, the moment when it will reach this target will coincide with FOMC meeting. And then we will see, what will happen next...
Weekly
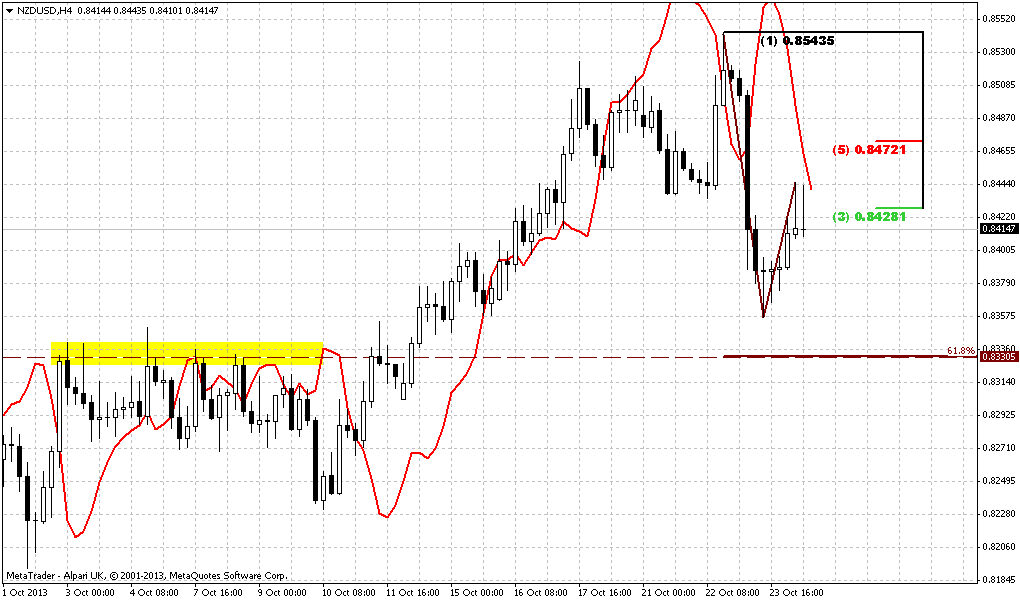
Weekly chart gives us slightly higher beacon – 1.27 target of Butterfly around 1.40 level. Trend holds bullish here. If we check the level of piercing of yearly pivot point, then we’ll see that 50-100 pips is not very significant distance for monthly chart. Thus, market still could accomplish this pattern and yearly pivot resitance 1 will still valid.
Here is another moment that is interesting within a context that we’ve specified above. I mean JPY and other thoughts. Why market continues move up here by reversal patttern? Other words, appearing of reversal pattern here is a warning sign that is fatefully agrees with our suspicions concerning possible stopping of upward action.
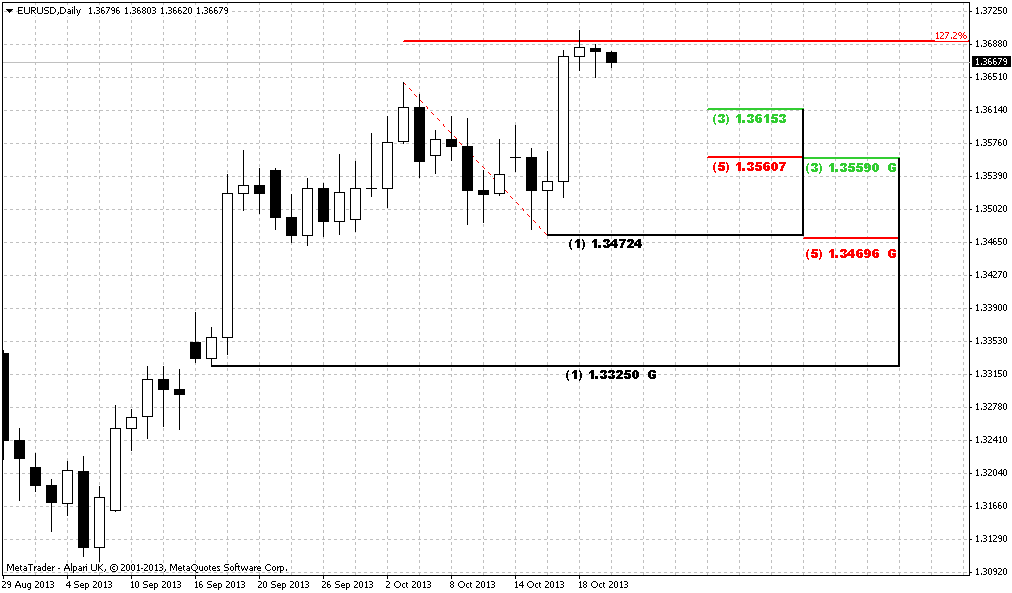
Daily
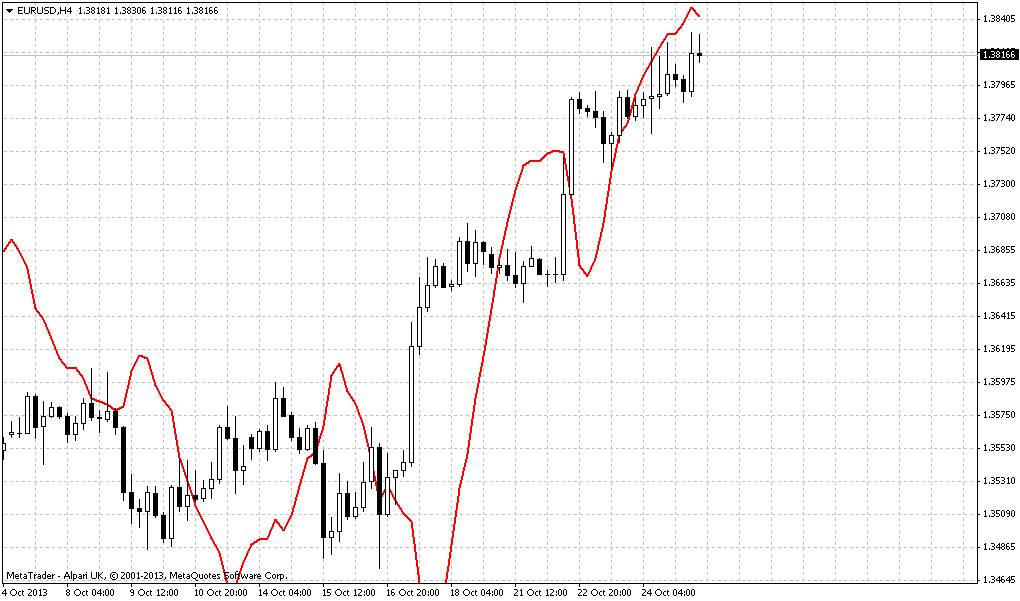
Now, as we have bullish setup for coming week at least, or may be even for a bit longer period, let’s see how we can take a position. Trend has turned bullish here and market is not at overbought. In fact it has ~ 100 pips handicap on Monday. Thus, as nothing presses on market right now, and as market just has passed through previous highs, we should not get too extended retracement down. If market has not shown retracement to 1.3470 K-support area when H&S pattern was in progress, then hardly it will start it right now. Thus, the most reasonable levels of retracement are 1.3615 nearest Fib level and 1.3560 K-support. They are reasonable. Any deeper move down will put under question whole recent thrust up and if market will reach next K-support, it will erase move up totally. So, if real bullish power exists here, we do not want to see this deep move, only to 1.3560 as maximum.
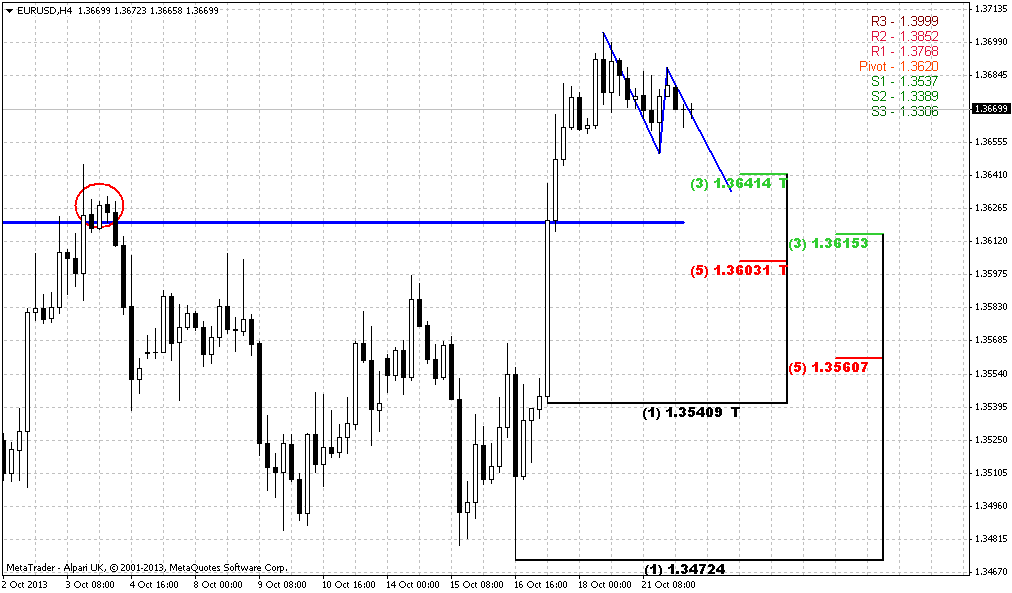
4-hour
Here we have another great assistance. Market will open above WPP and retracement right down to it has solid odds. Interestingly that our first Fib support coinsides with WPP, previous broken highs and 4-hour oversold level. Personally I do not look at intraday OB/OS levels very often, but as you, guys, have asked me to show it, then I fulfill your request. What does it mean? It means that we probably should take some part of long position right at 1.36-1.3615, because some bounce will happen after it, or even market will continue move up. Also, by this picture now we know that reaching of 1.3560 K-support level will be possible by only compounding retracement down, for example in the shape of AB=CD. Because market will have to at least bounce up from 1.3615. And if deeper retracement will follow, this bounce should become a BC leg of potential downward AB=CD. WPS1, by the way, also important and stands slightly lower then daily K-support area.
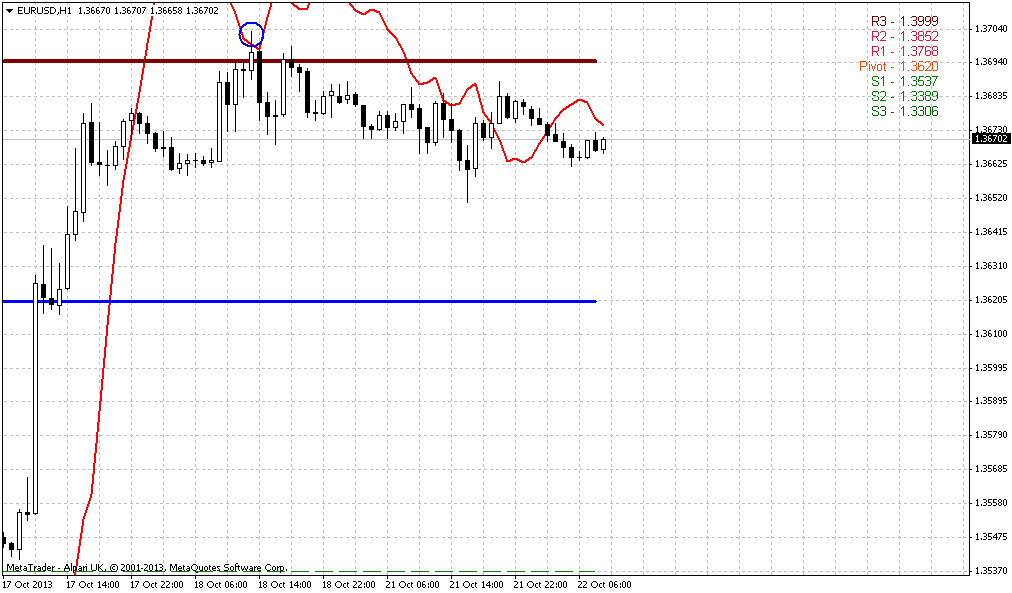
60-min
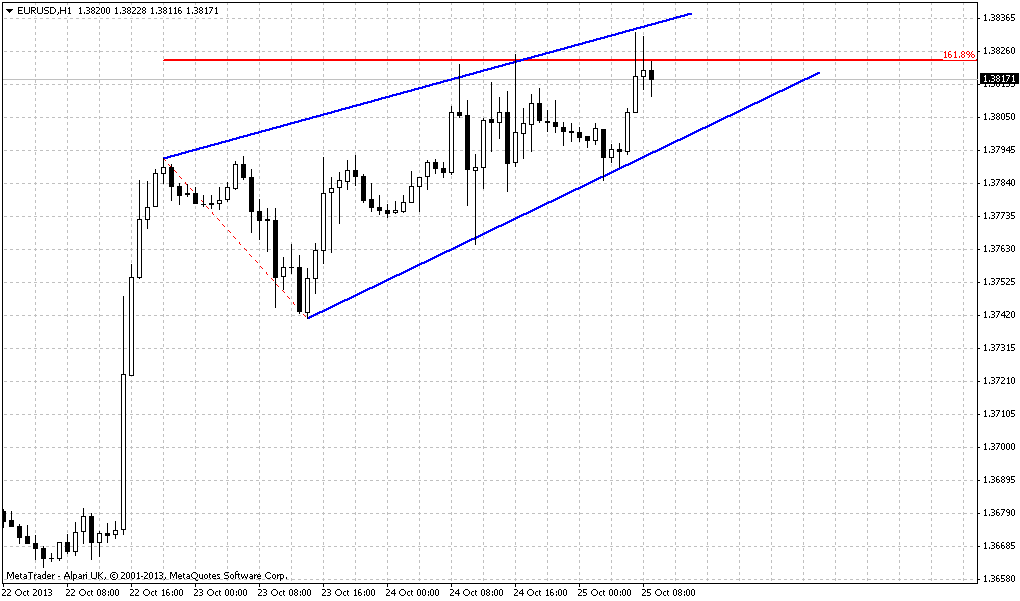
Well, here guys, to be honest, I see nothing really valuable, just some hints. Thus, our Friday butterfly has done well and market has hit our previous week target. The ultimate target to the downside of the same butterfly stands at 1.3625 – area around broken highs. Also, we have very short-term bearish stop grabber here, that suggests taking out 1.3660 butterfly’s lows. So, as you can see hints are not superb, but they give a bit more confidence that price will have chances to reach at least 1.3615 support by possible retracement down.
Conclusion:
Longer term perspective stands under curtain of nearest FOMC meeting and possible end of USD weakness. Still, market has ~250 pips of free space to upside and we will try to use them.
There are two suitable levels for long entry on Monday – 1.3615 and 1.3560 and some part of total position should be taken at nearest one, because currently it is unclear whether market will proceed to 1.3560 or not. You may add more, if this will happen. At the same time, as market is not at overbought we do not want to see deeper retracement down. Also, as usual, we do not want to see nasty black candles within our retracement. Do not enter Long, if you will see them. Upward target will stand in the range of 1.38-1.40 probably, depending on what patterns market will form there. Now we have just levels on monthly chart and butterfly “Sell” on weekly as beacons.
The technical portion of Sive's analysis owes a great deal to Joe DiNapoli's methods, and uses a number of Joe's proprietary indicators. Please note that Sive's analysis is his own view of the market and is not endorsed by Joe DiNapoli or any related companies.