FOREX PRO WEEKLY October 21-25, 2013

Hi Sive, great analyses as always. I am also using Oscillator Predictor, but I am not quit sure about the values. Do you input max and min values for last cca 150 periods, or some averages as you explained in the Military School for Detrended Oscillator (80% or 90% of average of 3 extreme points). When I input my values I do have to adjust always a little to get them same as yours.

Thank you.

Hi, just an ideia. When setting up oscillators' periods I usually use the numbers that allow me to get the results that fit the current market influence.
In other words:

Imagine that I am currrently trading an ABC pattern and I want to add an SMA to my price action analyses. Let's say the A of the ABC occured 21 bars ago. If I really think the market is under a deep influence of this ABC pattern I would set my SMA period to some number around 21 (the number of bars ago that this influencing pattern started).
 
Hello,

here is my point of view on cable. I hope you will understand what I want to tell.

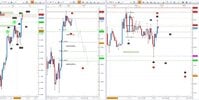
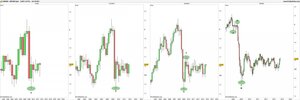
First, I want to say that when with fractal finished swing on higher time frame gets opposite swing (not neccessary fractal labeled, just has 2 lower/higher candles on its left side) I count inner wave on smaller time frame finished as it is seen. Example: Yearly & 6Months have no swings up, just wave down, swing finished with fractal,Quarterly has nice swings.
Picture01: cable Yearly/6Months/Quarterly/Monthly
20131020_cable01.jpg

Whole price action is developing for fourth year in the price range of 2009 candle and it is not neccessary that price action must make high above 2009 to go down. So far Quarterly is the nicest and it is my base TF. Because of limitation on ProRealTime charting software I will show my counts on FXCM, Monthly TF. I want to warn you on high/low levels because are not the same: for example Monthly high January 2013: FXCM = 1,63412, PRT = 1,6381, so do check your broker! The structure is same, and should be, just price leveles are not.

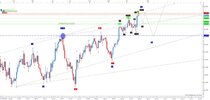
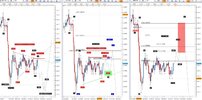
I found 3 different possible patterns.
First = very bearish = contracting triangle is done and we already made first move down and currently we are in retrace; based on structure I think it could be start of 3rd wave of ending diagonal; exceeding 1,63412 high puts this count under question.
Second = short term (more) bullish,long term berish = we are in D leg of CT; so far on Monthly A and B had nicely seen abc structure, C was complex (this is often), so we might expect D to make abc structure; the main question is timing = how much time we ought to spend to make both legs, to finish D,go down into E and up; this takes several months, based on Quarterly not before April 2014…
Third = bulish = we are in c leg of correction, based on structure ending diagonal could be in play..
Picture02: cable 3 Monthly charts
cablemonthly.jpg

I think that market is ready for quick and strong reaction so I am not very enthusiastic about the second/middle analysis which takes the most time to unfold and as drawn even could go in wrong direction.
As Sive already stated – everything is possible so intraday set ups are the best.
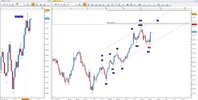
Daily: Weekly made swing fractal high and on Daily I see 2 possible counts; based on structure I am looking for short set ups..what I like is also nice low on weekly which could predict reversal into retrace if not something bigger…
Picture03: cable Weekly/Daily
cableweeklydaily.jpg
 
Hello again

Here is some reading about stock market, how phony is this growth...WHO will pay (again!) when this baloon burst?...stupid question!!!..tax payers around the world - who else!!

Money is not in consumer area, is not spend for products, more or less with some exceptions...
Globalization sucks! All we got from it, generally, is to work harder for less money, more labour force just means lower labour price, more competition does not mean progress in production/service but higher profits for share holders and owners. Bad & sad picture,really.
 
minimax dear.. what abt eur.?>??
share ur thoughts.. m waiting..:)

Hello Lolly,

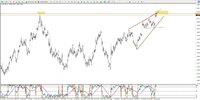
well, I do not know what exactly you ment with these trend lines; as drawn I could think you see a wedge but if so it is not ok, because in wedge waves overlap but we have not got low which would enter into current lower highs yet.

Here is the picture of alternative count to expanding triangle on which based my analysis and short trades; here is possible double zigzag which will very probable break 1,3711 high; as seen in my previous post I expect retrace but if developes into something bigger, so much better. TF is daily but main labeling is weekly except last wave up in progress.

I draw TLs and channels from swing fractals which I consider main in the construction but much more important and real are horizontal lines based on main fractals.

20131021Daily_weekly.jpg
 
Hello,

here is my point of view on cable...

Hi Minimax,
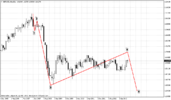
well, personally i like 2 and 3 monthly picture. And why you count drastic plunge down on monthly as corrective a-b-c action? Why it couldn't be 1-2-3 -now is 4th - and then 5th down?
What do you think about it?
gbpusdmonthly.png
 
Hi Minimax,
well, personally i like 2 and 3 monthly picture. And why you count drastic plunge down on monthly as corrective a-b-c action? Why it couldn't be 1-2-3 -now is 4th - and then 5th down?
What do you think about it?
View attachment 11762

Hi Sive

One of rules or maybe better recommendations of EW analysis is: when in doubt switch to higher TF. I really never and nowhere found exactly written that my approach is the only one possible & correct but I found it most logical: bigger TF wave consists 5 or 3 waves and so the count comes not logical on Q TF because it has 3 monthly waves and so should be labeled as corrective wave.

But in this particular case we get one almost same target level; let´s assume that last monthly high will be established as in your picture and will touch 62% from top of 2nd and pierced 50% from very top:
1. You see & count an impulse from the very top, target of 5th wave, a motive wave (!), would be 100,162 and 262% expansion of wave 1 and only 262 is bellow LL;
2. I see Flat correction as part of more complex correction and target of Y, a motive wave (!), would be 62, 100, 162, 262 expansion of whole move down;
As seen your 162 confluences with my 62 almost in pip; your move should end here, my could go lower and then we would really know whose count was in play. If move really stops and turns there, we will not get the answer, both counts will be ok, especially if we would be both short from last top, either labeled 4 either X, hehe.

201310220915_cableMonthly.jpg

ps: if we would later switch to yearly there would be abc = ABCD = 3 wave pattern, so I was correct
 
Last edited:
Hehe, this is really something! Everything is up: DAX, SP, euro...market expects more QE & money printing...
 
Back
Top