Lolly Tripathy
Sergeant Major
- Messages
- 515
HI sive sir,, thank you very much for the reply..
i got an article from a forum and sharing here..
what do you think about relief rally>>
U.S. Debt Ceiling: History Repeats Itself?
Word on Wall Street is that the U.S. Senate has passed the bill to raise the nation’s debt ceiling. Wait a minute, this is exactly what happened a couple of years ago!
Back in 2011 when Miley Cyrus was just a teenage pop star partying in the U.S.A., the U.S. came close to hitting its debt ceiling of 14.3 trillion USD. At that time, Democrats were pushing for spending cuts AND tax hikes while Republicans insisted on relying on spending cuts alone. Just a few hours before the deadline, Senators struck a deal and passed the bill to raise the debt ceiling by 2.4 trillion USD over the next three years. Sound familiar?
Fast forward to 2013 with Miley Cyrus swinging around on a wrecking ball, Uncle Sam is moving dangerously close to hitting its debt ceiling once again. After days of bickering, lawmakers were able to reach a compromise on the eleventh hour and pass a bill to raise the limit and avoid a debt default.
In particular, the Senate and Congress agreed to extend the debt deadline to February 7 with current spending levels allowed until January 15. This basically gives lawmakers a few extra months to come up with a better plan to trim spending and fix the government’s budget problems.
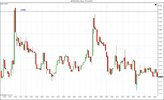
With history repeating itself, we might be able to predict future USD behavior by taking a look at how the currency reacted to the debt ceiling deal a couple of years ago. Lemme show you a snapshot of the U.S. dollar index
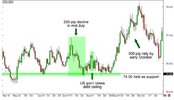
As you can see, the Greenback suffered a selloff similar to what we’ve been seeing lately when news of the debt ceiling deadline hit the airwaves. Hopes that U.S. lawmakers would be able to reach a deal were enough to provide support for the dollar in the days closer to the deadline, yet the U.S. currency retreated and consolidated soon after the debt ceiling was raised.
Later on, the U.S. dollar staged a strong relief rally and even broke past its previous highs. Should we expect the same reaction this time?
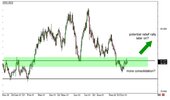
The USDX chart looks a little different now compared to 2011, as the dollar is testing an area of interest rather than an actual support level. Further consolidation could mean that USDX would continue to tread below the 81.00 handle or possibly bounce off the next support level around 79.70. Later on, a strong break above the 81.00 level suggests that a strong relief rally is underway.
Of course, reviewing past price action is only one of the many ways to predict future currency movements. Bear in mind that there are plenty of other factors that could affect dollar behavior for the last stretch of the year
i got an article from a forum and sharing here..
what do you think about relief rally>>
U.S. Debt Ceiling: History Repeats Itself?
Word on Wall Street is that the U.S. Senate has passed the bill to raise the nation’s debt ceiling. Wait a minute, this is exactly what happened a couple of years ago!
Back in 2011 when Miley Cyrus was just a teenage pop star partying in the U.S.A., the U.S. came close to hitting its debt ceiling of 14.3 trillion USD. At that time, Democrats were pushing for spending cuts AND tax hikes while Republicans insisted on relying on spending cuts alone. Just a few hours before the deadline, Senators struck a deal and passed the bill to raise the debt ceiling by 2.4 trillion USD over the next three years. Sound familiar?
Fast forward to 2013 with Miley Cyrus swinging around on a wrecking ball, Uncle Sam is moving dangerously close to hitting its debt ceiling once again. After days of bickering, lawmakers were able to reach a compromise on the eleventh hour and pass a bill to raise the limit and avoid a debt default.
In particular, the Senate and Congress agreed to extend the debt deadline to February 7 with current spending levels allowed until January 15. This basically gives lawmakers a few extra months to come up with a better plan to trim spending and fix the government’s budget problems.
With history repeating itself, we might be able to predict future USD behavior by taking a look at how the currency reacted to the debt ceiling deal a couple of years ago. Lemme show you a snapshot of the U.S. dollar index

As you can see, the Greenback suffered a selloff similar to what we’ve been seeing lately when news of the debt ceiling deadline hit the airwaves. Hopes that U.S. lawmakers would be able to reach a deal were enough to provide support for the dollar in the days closer to the deadline, yet the U.S. currency retreated and consolidated soon after the debt ceiling was raised.
Later on, the U.S. dollar staged a strong relief rally and even broke past its previous highs. Should we expect the same reaction this time?

The USDX chart looks a little different now compared to 2011, as the dollar is testing an area of interest rather than an actual support level. Further consolidation could mean that USDX would continue to tread below the 81.00 handle or possibly bounce off the next support level around 79.70. Later on, a strong break above the 81.00 level suggests that a strong relief rally is underway.
Of course, reviewing past price action is only one of the many ways to predict future currency movements. Bear in mind that there are plenty of other factors that could affect dollar behavior for the last stretch of the year
