Sive Morten
Special Consultant to the FPA
- Messages
- 18,776
Fundamentals
Weekly Gold Tading Report prepared by Sive Morten exclusively for ForexPeaceArmy.com
Reuters reports, Gold rebounded from a one-month low on Friday, as weaker-than-expected U.S. manufacturing data counteracted the impact of a stronger dollar, but still looked set to post its third straight weekly loss.
The turn upward came after the Institute for Supply Management said its index of national factory activity fell to 55.5 in December.
That was the lowest reading in six months and well below expectations, raising speculation that the U.S. Federal Reserve would delay raising interest rates as economic weakness abroad begins to hamper the U.S. economy, said Eli Tesfaye, senior market strategist for RJO Futures in Chicago.
"Any kind of slowing down is bullish for the precious metals," Tesfaye said. "Gold is still showing a sign of strength even with a strong dollar."
The rebound came after spot gold fell to a one-month low at $1,168 an ounce as the dollar rose to its highest level in nearly five years, mostly due to a lower euro, which hit a 4-1/2 year low after the European Central Bank fanned expectations it would take bolder steps on monetary stimulus later this month.
Bullion ended 2014 down nearly 2 percent, following a 28 percent slump the previous year. Anticipated U.S. interest rate hikes and a recovering economy may strengthen the dollar's appeal in 2015. A stronger dollar makes gold more expensive for holders of foreign currencies.
With an 11 percent jump, palladium was the best-performing precious metal in 2014, mostly on supply concerns from top producer Russia. Prices were up 0.54 percent at $792.72 an ounce.
Most recent CFTC data stands on 23rd of December and unfortunately it does not let us to gauge on current investors’ behavior, whether they are started return on markets or not yet. Thus, data on 23rd shows just more closing of positions and nothing more.
Here is detailed breakdown of speculative positions:
Open interest:
 Shorts:
 Longs:

Also guys, I want to share with you on rumors that have appeared around CME. Rumors tell that CME has adopted new trading rule that put more limitations on single day price changing on gold options and futures:
http://www.cmegroup.com/content/dam/cmegroup/tools-information/lookups/advisories/ser/files/SER-7258.pdf
It raises some questions. Most radical traders think that CME is preparing to unprecedented gold rally and tries to insure and protect itself in advance. Personally I’ve not studied this document with scrutiny yet, but probably I will have to do it soon. It will be great if you will take a look at it and share with your opinion on forum.
So, guys, recent chill out in upside rally looks worrying. It has started rather well, but faded out rather fast. Currently it is not quite clear whether the reason is Xmas and end of financial year or indeed it was just retracement. It is difficult to argue with the facts – SDPR is stagnating, CFTC also does not support yet big shift that have happened 3 weeks ago and finally - spot market in Asia gives discounts to London quotes. This is not typical situation at all. Big players still expect that gold will remain under pressure. That’s being said it looks like our major target is to not overestimate recent events. It could happen so that bearish positions will be re-established in January, but if they not – this indeed will be sign of shifting sentiment on gold market.
Technicals
Monthly
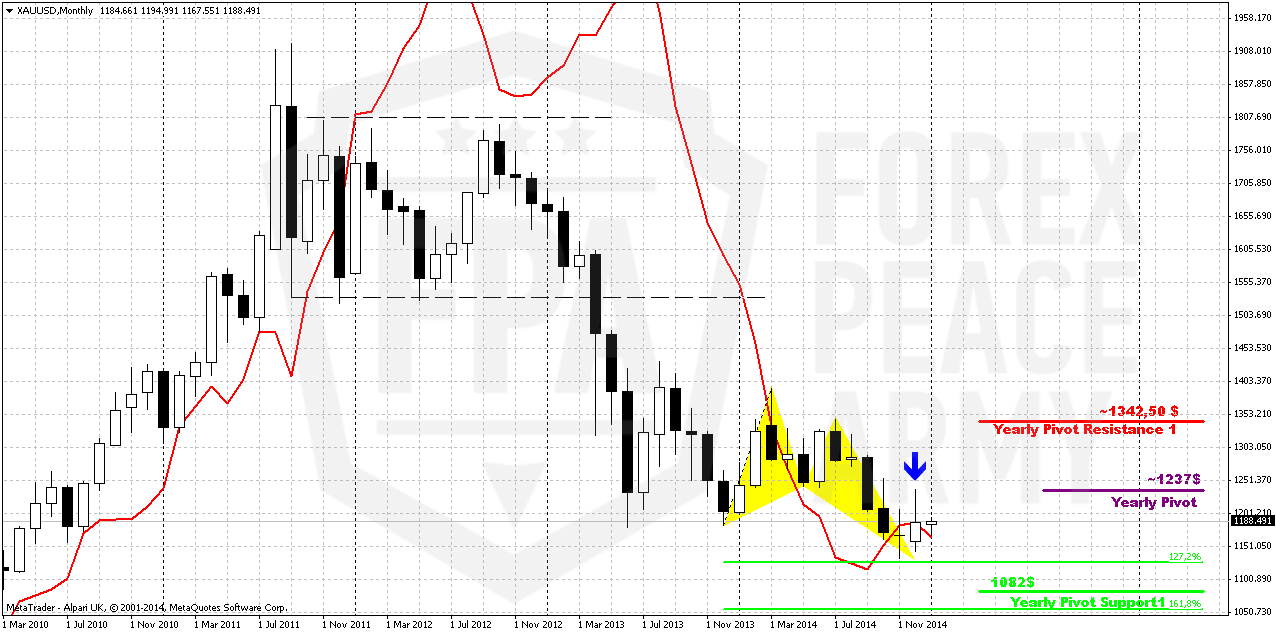
As New Year has started we’ve got some new inputs on monthly chart. Thus, we’ve got new yearly pivots. Most important thing here is shifting up of YPS1. In 2014 it stand at 1020, while in 2015 it stands at 1082$. This is very close to our ultimate 1050 target and in fact coincides with 1.618 butterfly target on monthly chart.
Second important issue – we’ve got bearish grabber on monthly chart as result of December close. I do not know how to match it with worries on new CME regulation act, but this is just a rumor yet and it is possible that this rumor is overestimated. But grabber is a pattern that we have in place. Still they do not contradict to each other, because market could reach lower targets first and only after that turn to upside rally…
Here we still have last big pattern in progress that is Volatility breakout (VOB). It suggests at least 0.618 AB-CD down. And this target is 1050$. This pattern could take shape of butterfly, if it will proceed to 1.618 target.
The major driving factor for Gold is inflation and particularly here US economy has problem. Although recent report has shown shy increase in wages, but inflation still stands flat. Accompanied by positive NFP numbers increasing chances on sooner rate hiking will be negative combination for gold. That’s why currently we do not see reasons yet to cancel our 1050$ target. Analysts of different big banks also think that gold will remain under pressure in the first half of 2015 and announce close targets around 1000-1100$.
January should become a month where we could get real sentiment. As investors will start to return back on market and re-establish positions, make bets on 2015 action – we should get a clue whether December mass short covering, increasing longs and SDPR storage just was occasional or this is first step of some big shifts. Right now situation on market mostly confirms that this was just scheduled position covering at the end of the year to fix assets value for booking and bonuses calculation…
Weekly
On weekly chart we do not see big changes. Previous week has almost the same placement and range as week before. Due holidays market just has made an attempt to move higher, re-test MPP and returned right back up. Trend holds bullish here. The only new issue could appear here is bearish dynamic pressure. Although trend has turned bullish, price action is not hurry to show upside acceleration.
Initial reaction of AB=CD completion point and monthly Agreement now looks not as impressive as previously. It is slowed and become more choppy with long shadows as to upside as to downside. Market has returned right back down below MPR1. Now it does not look really as upside impulse action and reversal, right? Taking into consideration recent fundamental data and existence of untouched butterfly and 1.618 AB-CD targets, downward continuation seems not impossible. Besides, recent action is starting to remind flag shape that suggests downside continuation. That’s being said, when market reaches significant support area but reaction on this event is mild – logically to suggest possible further downward continuation. Market really looks heavy and can’t just jump off from support area.
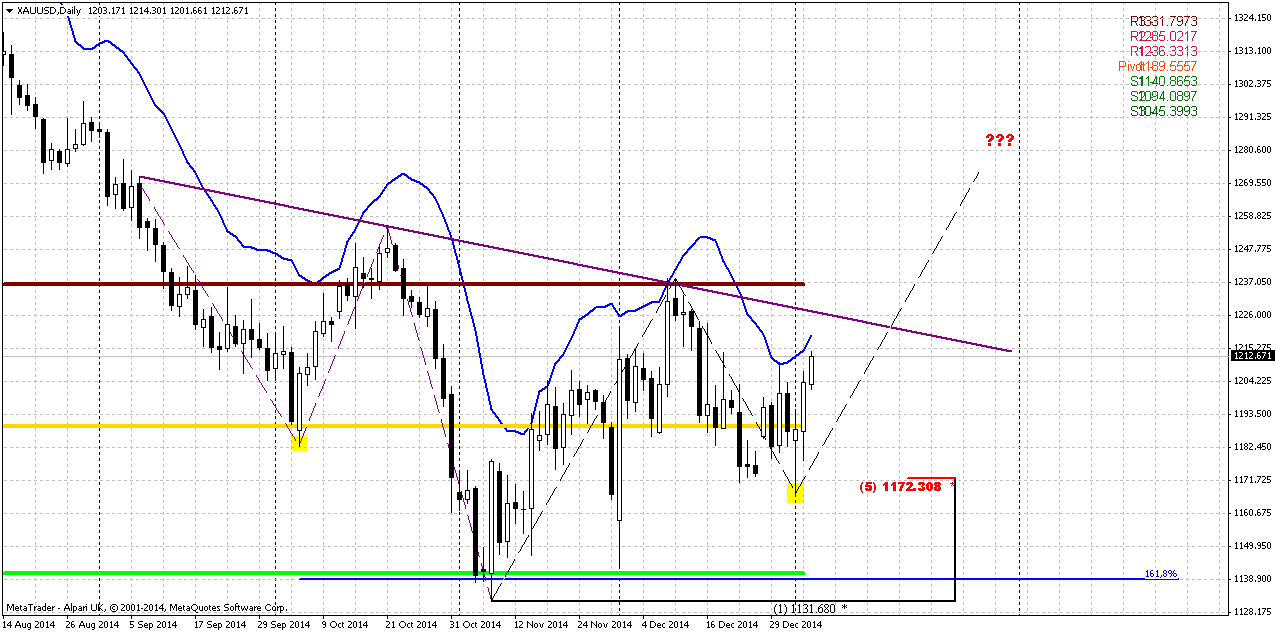
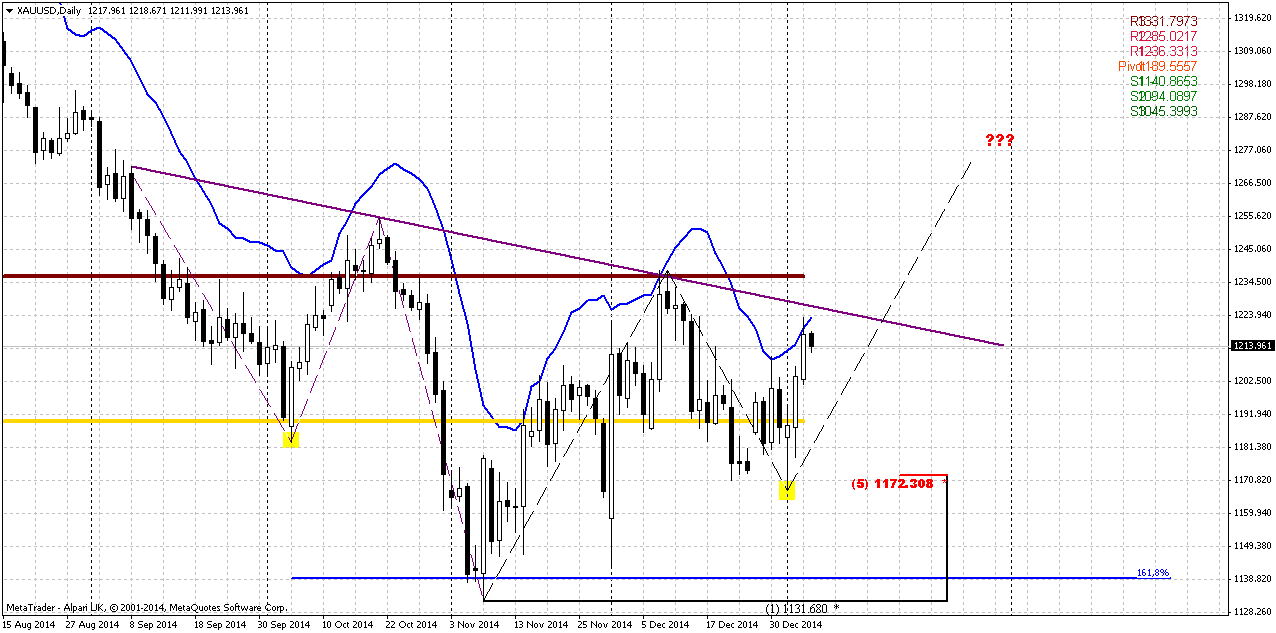
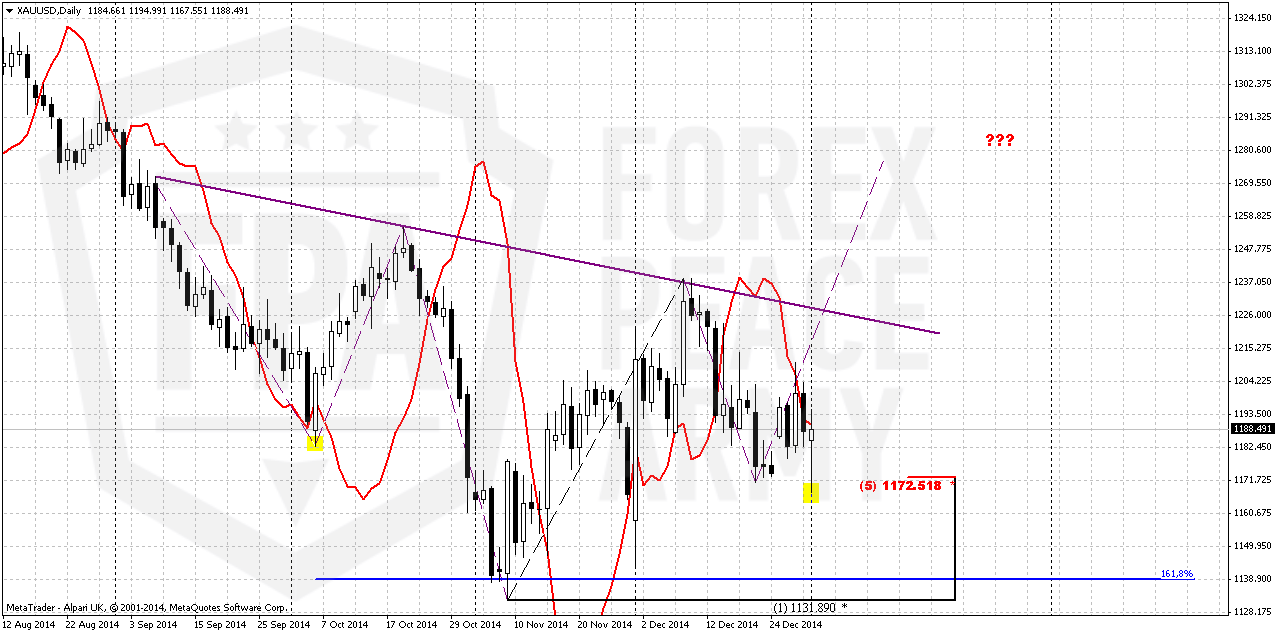
Daily
Most interesting chart right now is daily one. Our concerns that we’ve announced in previous daily update looks like were reasonable. When gold has started to show behavior that it should not show in current moment – it has pointed on possible problems of upside action in general and H&S pattern in particular. That’s why we’ve called for taking short position. Now situation on gold is a bit tricky. Daily grabber has done their job and led market to previous lows, cleared it out. But as Michigan sentiment numbers were released – it has provided some relief and market bounced back up. So, here we can’t exclude that this could be a kind of W&R and definitely we can say that 1170 support has not been broken yet.
As recent action takes the shape of hammer – we should treat it correspondingly. Pattern treats as valid until market will not take out its lows. Grabbers are done right now and we should not take any new shorts until this will happen. In fact this is new tactical setup. And what about longs? May be… Let’s see what we have inside of hammer on intraday charts…
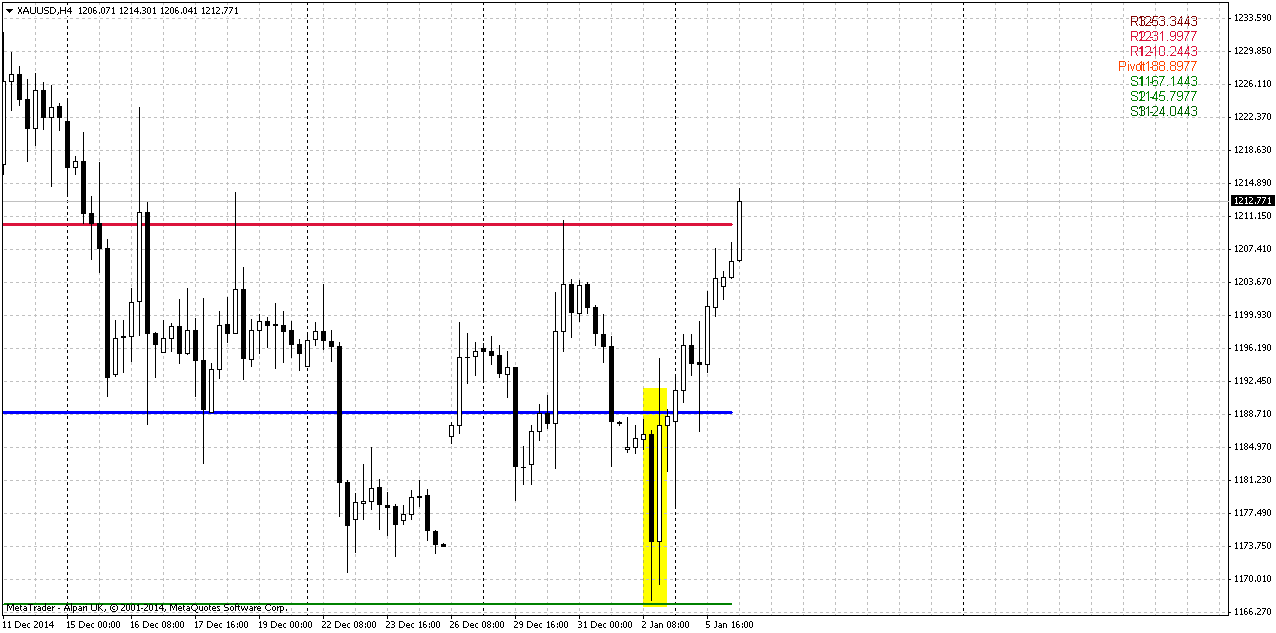
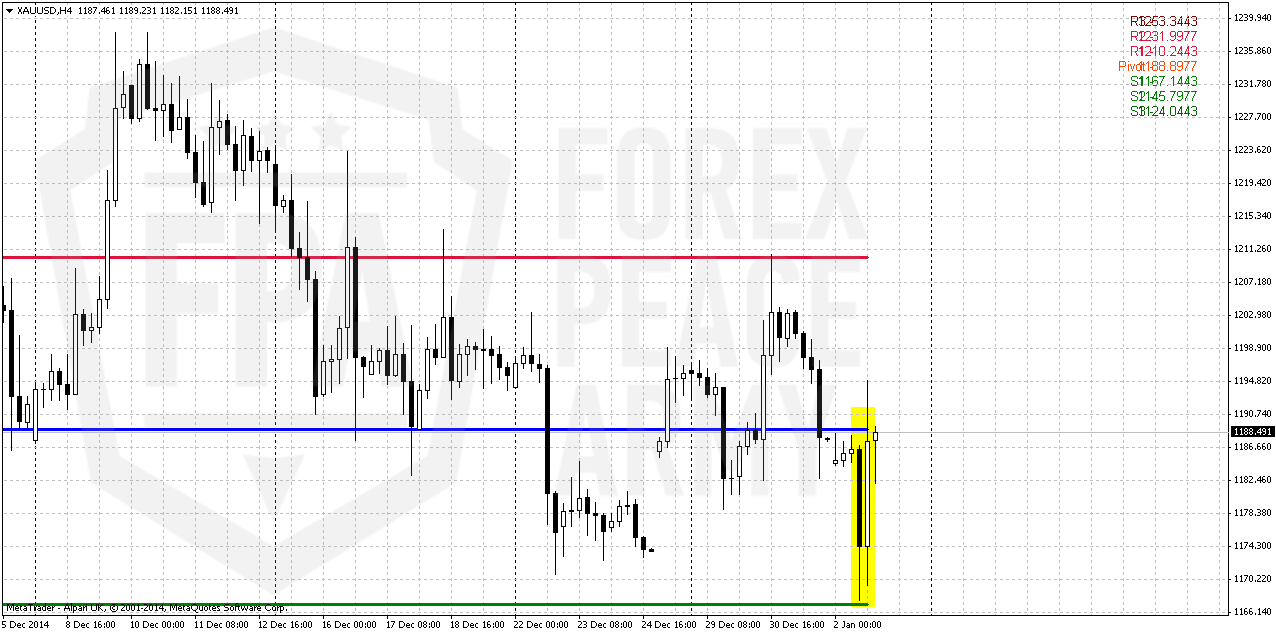
4-hour
This chart shows that our thought was correct – indeed, we’ve got classical shape of W&R by long engulfing pattern. It means that on coming week market could reach WPR1, since minimum target of this pattern is length of its bars. Invalidation point stands below its lows. Thus, it seems that we really could take short-term long trade, but need to take entry point as closer to lows as possible.
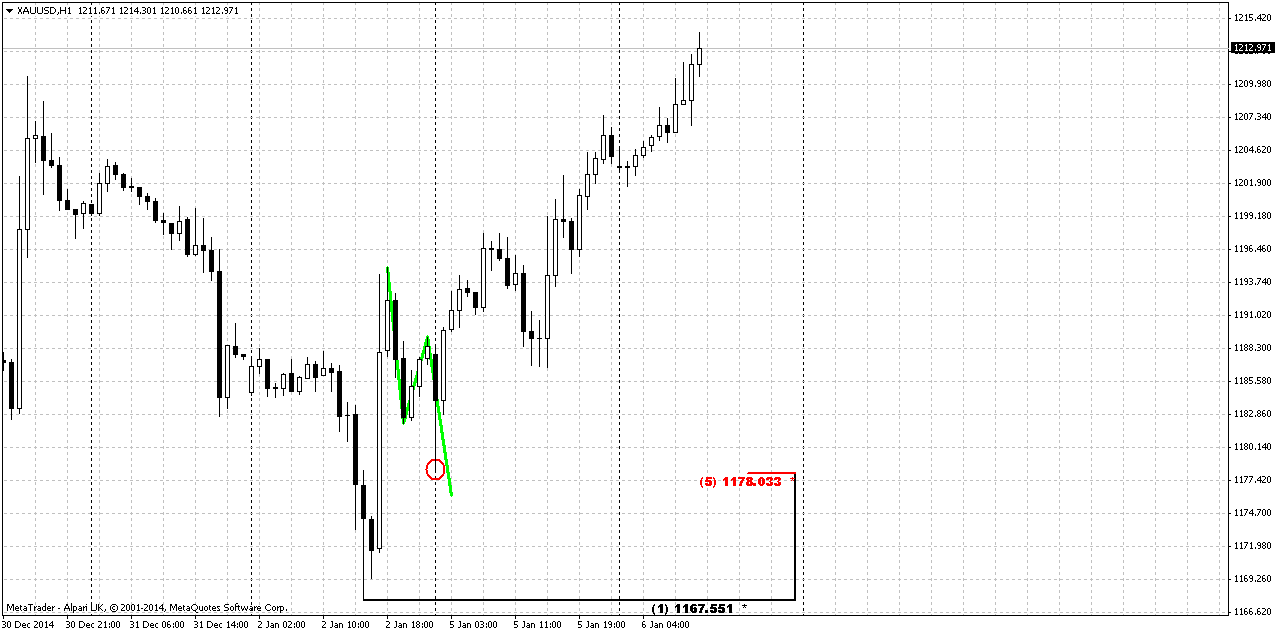
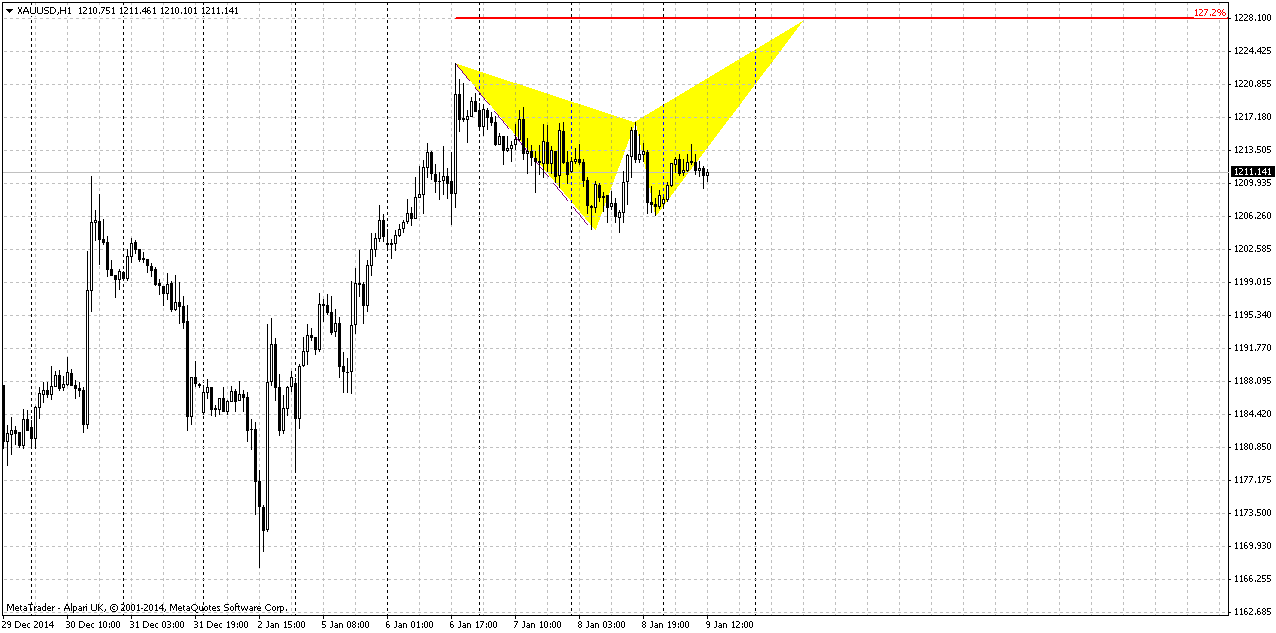
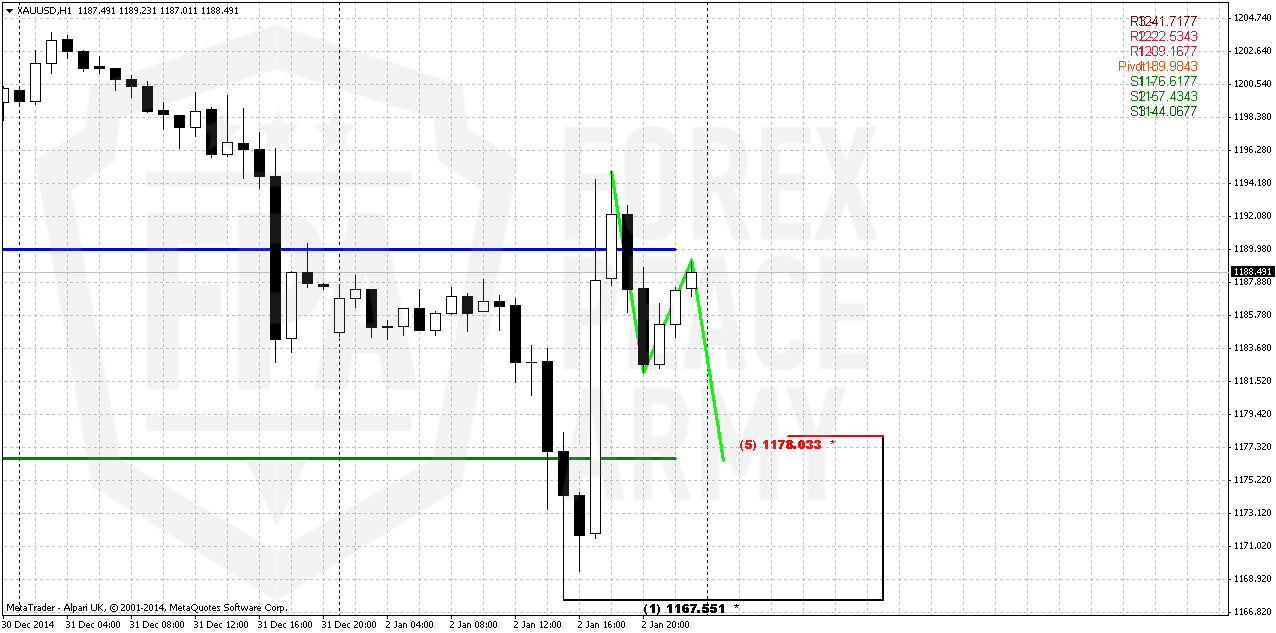
Hourly
Let’s start our journey, guys, with this short-term setup from hourly picture. Market should open near WPP. Also recent upside action is reversal swing. As deep retracement usually comes after reversal swing as gold has a habit to show deep retracement per se – we probably should keep an eye first on 5/8 Fib support @ 1178, that also could be an Agreement and at WPS1. This is first step of our plan. Depending on how market will behave on Monday we will decide what to do next…
Conclusion:
Since market still keeps normal bearish tendency we should not refuse our 1050 target yet. Recent data shows some chill out in further upside sentiment. Currently it is not quite clear whether the reason is just end of the year and Xmas or really something is changing in big sentiment. Recent data suggests that first variant is more probable by far. Technical picture also does not look rock hard bullish. January will probably clarify some moments.
In short-term perspective market points on possible action to WPR1 @ 1211. Let’s see how this setup will work…
The technical portion of Sive's analysis owes a great deal to Joe DiNapoli's methods, and uses a number of Joe's proprietary indicators. Please note that Sive's analysis is his own view of the market and is not endorsed by Joe DiNapoli or any related companies.
Weekly Gold Tading Report prepared by Sive Morten exclusively for ForexPeaceArmy.com
Reuters reports, Gold rebounded from a one-month low on Friday, as weaker-than-expected U.S. manufacturing data counteracted the impact of a stronger dollar, but still looked set to post its third straight weekly loss.
The turn upward came after the Institute for Supply Management said its index of national factory activity fell to 55.5 in December.
That was the lowest reading in six months and well below expectations, raising speculation that the U.S. Federal Reserve would delay raising interest rates as economic weakness abroad begins to hamper the U.S. economy, said Eli Tesfaye, senior market strategist for RJO Futures in Chicago.
"Any kind of slowing down is bullish for the precious metals," Tesfaye said. "Gold is still showing a sign of strength even with a strong dollar."
The rebound came after spot gold fell to a one-month low at $1,168 an ounce as the dollar rose to its highest level in nearly five years, mostly due to a lower euro, which hit a 4-1/2 year low after the European Central Bank fanned expectations it would take bolder steps on monetary stimulus later this month.
Bullion ended 2014 down nearly 2 percent, following a 28 percent slump the previous year. Anticipated U.S. interest rate hikes and a recovering economy may strengthen the dollar's appeal in 2015. A stronger dollar makes gold more expensive for holders of foreign currencies.
With an 11 percent jump, palladium was the best-performing precious metal in 2014, mostly on supply concerns from top producer Russia. Prices were up 0.54 percent at $792.72 an ounce.
Most recent CFTC data stands on 23rd of December and unfortunately it does not let us to gauge on current investors’ behavior, whether they are started return on markets or not yet. Thus, data on 23rd shows just more closing of positions and nothing more.
Here is detailed breakdown of speculative positions:
Open interest:
Also guys, I want to share with you on rumors that have appeared around CME. Rumors tell that CME has adopted new trading rule that put more limitations on single day price changing on gold options and futures:
http://www.cmegroup.com/content/dam/cmegroup/tools-information/lookups/advisories/ser/files/SER-7258.pdf
It raises some questions. Most radical traders think that CME is preparing to unprecedented gold rally and tries to insure and protect itself in advance. Personally I’ve not studied this document with scrutiny yet, but probably I will have to do it soon. It will be great if you will take a look at it and share with your opinion on forum.
So, guys, recent chill out in upside rally looks worrying. It has started rather well, but faded out rather fast. Currently it is not quite clear whether the reason is Xmas and end of financial year or indeed it was just retracement. It is difficult to argue with the facts – SDPR is stagnating, CFTC also does not support yet big shift that have happened 3 weeks ago and finally - spot market in Asia gives discounts to London quotes. This is not typical situation at all. Big players still expect that gold will remain under pressure. That’s being said it looks like our major target is to not overestimate recent events. It could happen so that bearish positions will be re-established in January, but if they not – this indeed will be sign of shifting sentiment on gold market.
Technicals
Monthly
As New Year has started we’ve got some new inputs on monthly chart. Thus, we’ve got new yearly pivots. Most important thing here is shifting up of YPS1. In 2014 it stand at 1020, while in 2015 it stands at 1082$. This is very close to our ultimate 1050 target and in fact coincides with 1.618 butterfly target on monthly chart.
Second important issue – we’ve got bearish grabber on monthly chart as result of December close. I do not know how to match it with worries on new CME regulation act, but this is just a rumor yet and it is possible that this rumor is overestimated. But grabber is a pattern that we have in place. Still they do not contradict to each other, because market could reach lower targets first and only after that turn to upside rally…
Here we still have last big pattern in progress that is Volatility breakout (VOB). It suggests at least 0.618 AB-CD down. And this target is 1050$. This pattern could take shape of butterfly, if it will proceed to 1.618 target.
The major driving factor for Gold is inflation and particularly here US economy has problem. Although recent report has shown shy increase in wages, but inflation still stands flat. Accompanied by positive NFP numbers increasing chances on sooner rate hiking will be negative combination for gold. That’s why currently we do not see reasons yet to cancel our 1050$ target. Analysts of different big banks also think that gold will remain under pressure in the first half of 2015 and announce close targets around 1000-1100$.
January should become a month where we could get real sentiment. As investors will start to return back on market and re-establish positions, make bets on 2015 action – we should get a clue whether December mass short covering, increasing longs and SDPR storage just was occasional or this is first step of some big shifts. Right now situation on market mostly confirms that this was just scheduled position covering at the end of the year to fix assets value for booking and bonuses calculation…
Weekly
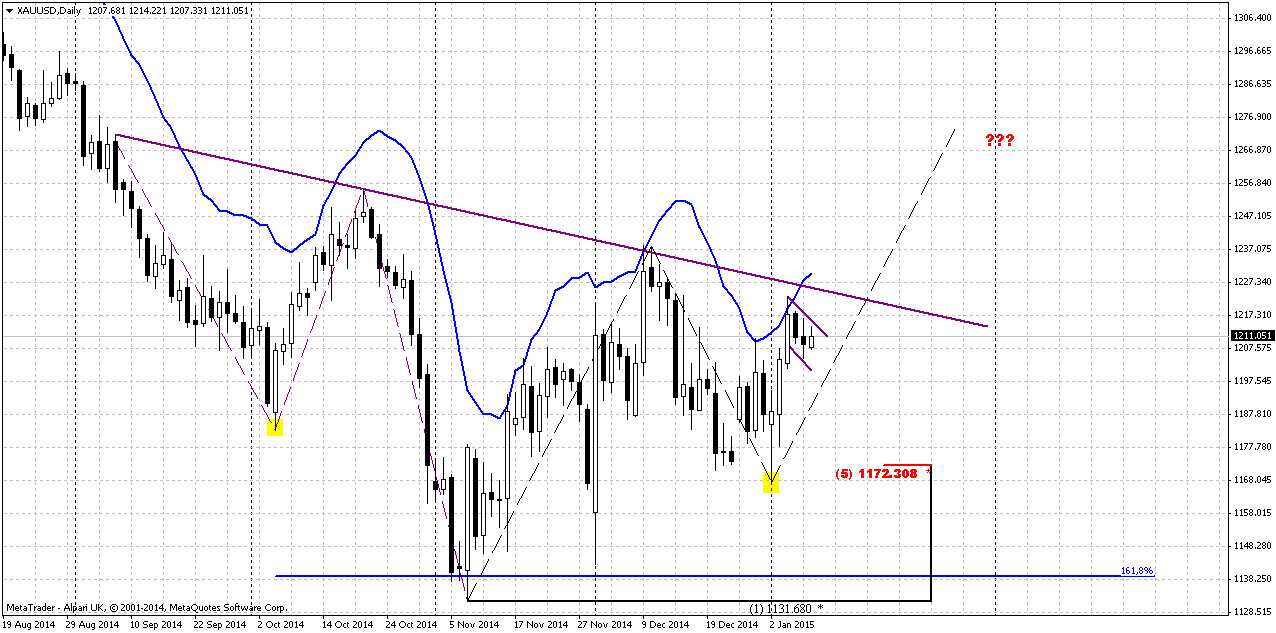
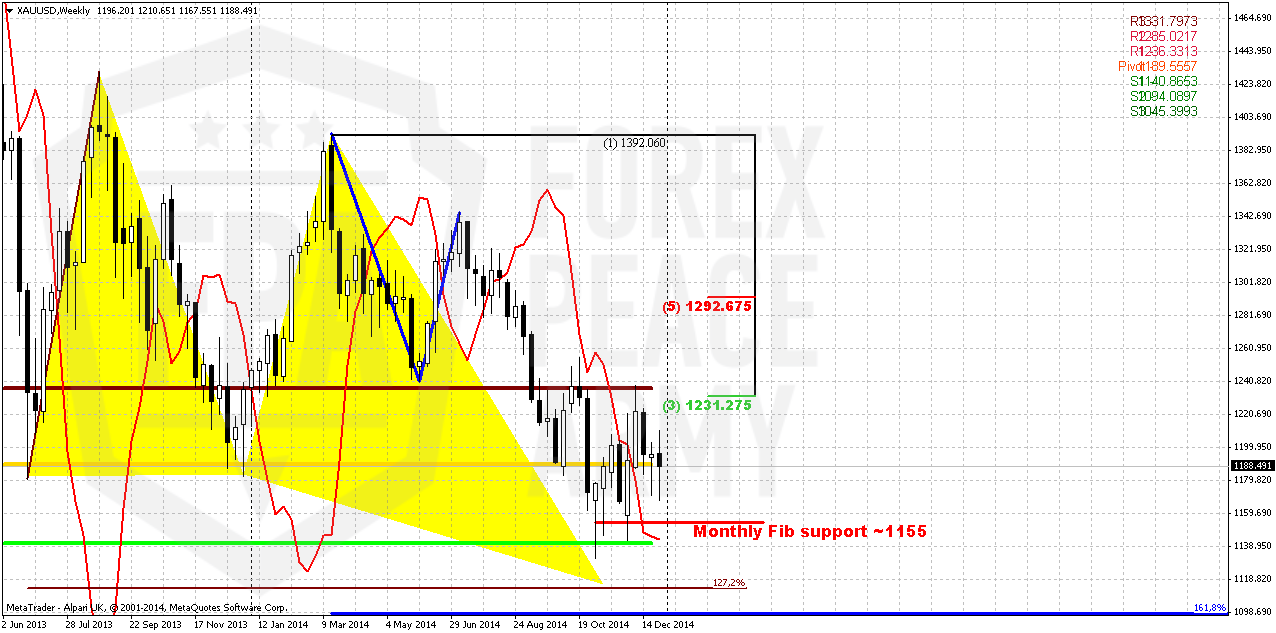
On weekly chart we do not see big changes. Previous week has almost the same placement and range as week before. Due holidays market just has made an attempt to move higher, re-test MPP and returned right back up. Trend holds bullish here. The only new issue could appear here is bearish dynamic pressure. Although trend has turned bullish, price action is not hurry to show upside acceleration.
Initial reaction of AB=CD completion point and monthly Agreement now looks not as impressive as previously. It is slowed and become more choppy with long shadows as to upside as to downside. Market has returned right back down below MPR1. Now it does not look really as upside impulse action and reversal, right? Taking into consideration recent fundamental data and existence of untouched butterfly and 1.618 AB-CD targets, downward continuation seems not impossible. Besides, recent action is starting to remind flag shape that suggests downside continuation. That’s being said, when market reaches significant support area but reaction on this event is mild – logically to suggest possible further downward continuation. Market really looks heavy and can’t just jump off from support area.
Daily
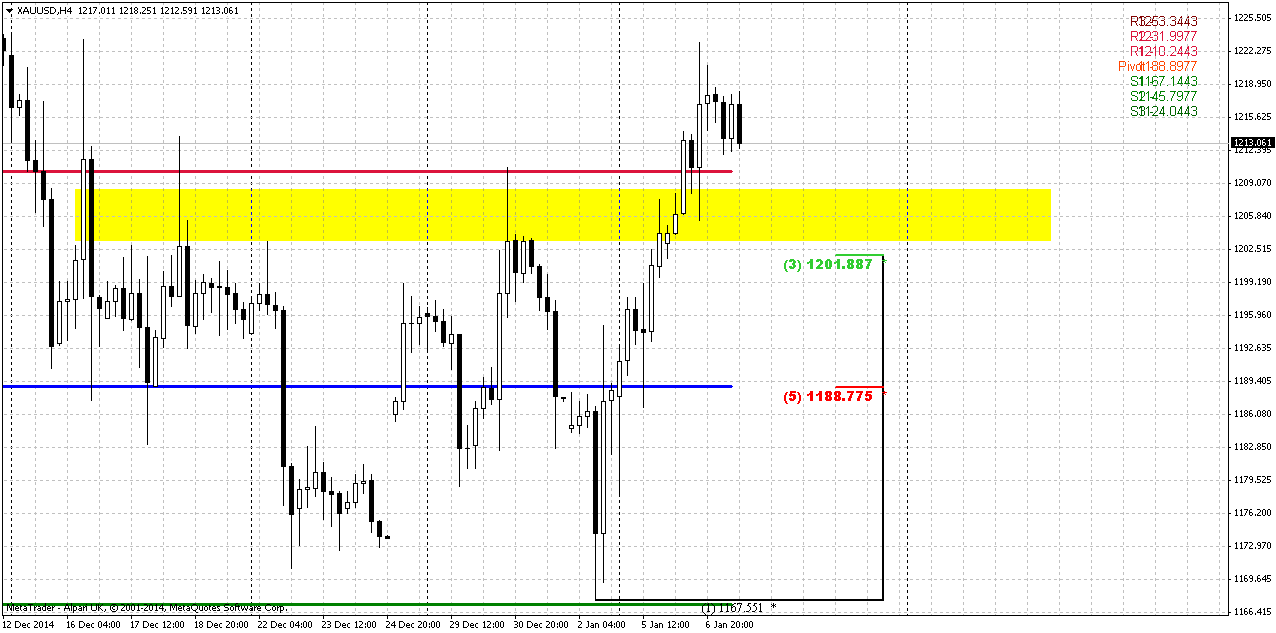
Most interesting chart right now is daily one. Our concerns that we’ve announced in previous daily update looks like were reasonable. When gold has started to show behavior that it should not show in current moment – it has pointed on possible problems of upside action in general and H&S pattern in particular. That’s why we’ve called for taking short position. Now situation on gold is a bit tricky. Daily grabber has done their job and led market to previous lows, cleared it out. But as Michigan sentiment numbers were released – it has provided some relief and market bounced back up. So, here we can’t exclude that this could be a kind of W&R and definitely we can say that 1170 support has not been broken yet.
As recent action takes the shape of hammer – we should treat it correspondingly. Pattern treats as valid until market will not take out its lows. Grabbers are done right now and we should not take any new shorts until this will happen. In fact this is new tactical setup. And what about longs? May be… Let’s see what we have inside of hammer on intraday charts…
4-hour
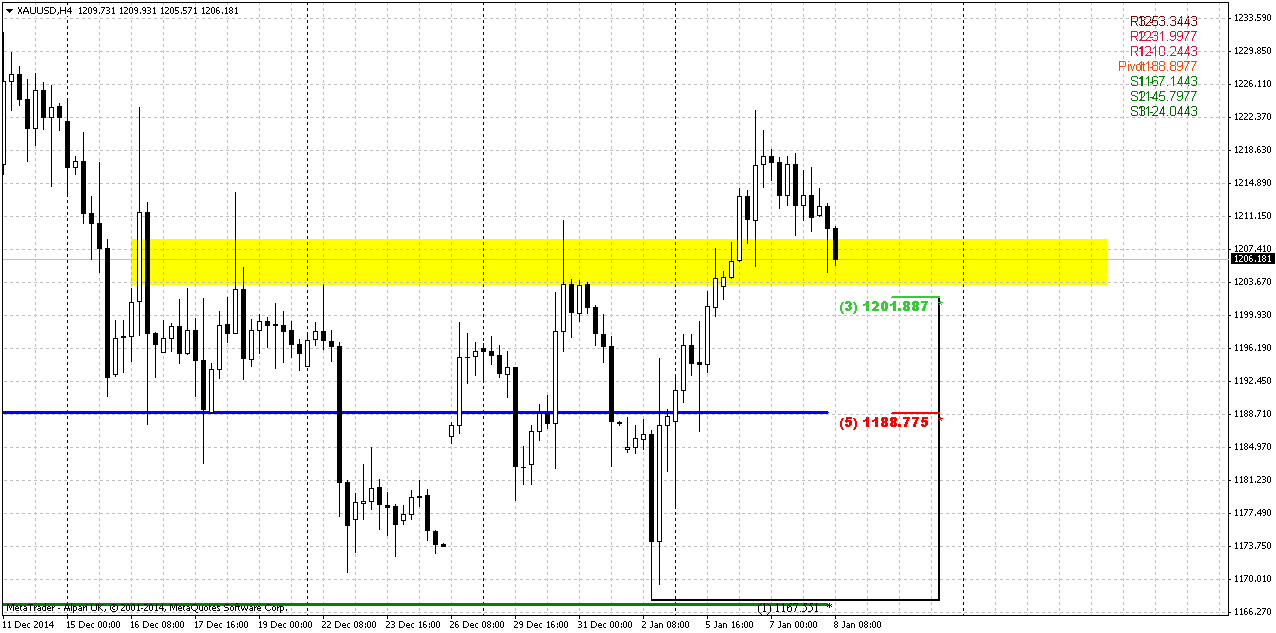
This chart shows that our thought was correct – indeed, we’ve got classical shape of W&R by long engulfing pattern. It means that on coming week market could reach WPR1, since minimum target of this pattern is length of its bars. Invalidation point stands below its lows. Thus, it seems that we really could take short-term long trade, but need to take entry point as closer to lows as possible.
Hourly
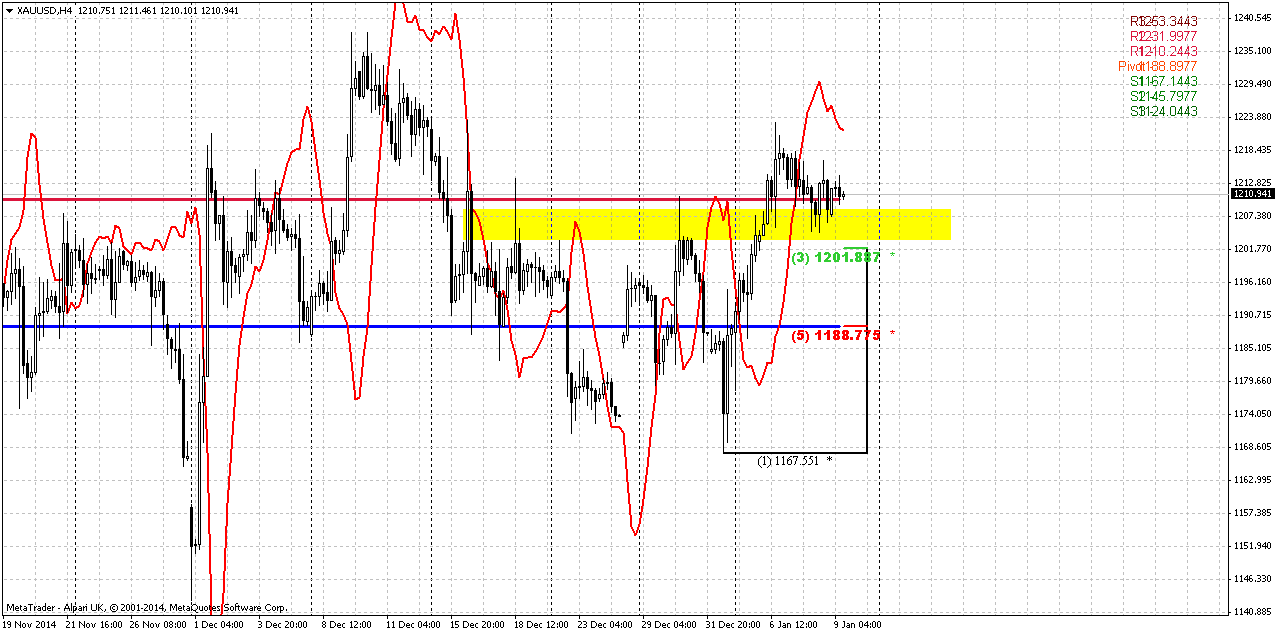
Let’s start our journey, guys, with this short-term setup from hourly picture. Market should open near WPP. Also recent upside action is reversal swing. As deep retracement usually comes after reversal swing as gold has a habit to show deep retracement per se – we probably should keep an eye first on 5/8 Fib support @ 1178, that also could be an Agreement and at WPS1. This is first step of our plan. Depending on how market will behave on Monday we will decide what to do next…
Conclusion:
Since market still keeps normal bearish tendency we should not refuse our 1050 target yet. Recent data shows some chill out in further upside sentiment. Currently it is not quite clear whether the reason is just end of the year and Xmas or really something is changing in big sentiment. Recent data suggests that first variant is more probable by far. Technical picture also does not look rock hard bullish. January will probably clarify some moments.
In short-term perspective market points on possible action to WPR1 @ 1211. Let’s see how this setup will work…
The technical portion of Sive's analysis owes a great deal to Joe DiNapoli's methods, and uses a number of Joe's proprietary indicators. Please note that Sive's analysis is his own view of the market and is not endorsed by Joe DiNapoli or any related companies.