Sive Morten
Special Consultant to the FPA
- Messages
- 18,819
NZD/USD Possition point of view
Good morning,
I think that NZD has very interesting price action from position point of view.
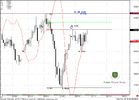
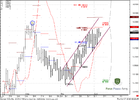
On the monthly chart we see MACD Predictor failure pattern during 3 months, trend is bullish. Usually it leads to the previous highs that should be taken out by the price - market can clear 7605 area. Also we can see, that 0.786 Fib resistance has been touched once already, so this level is not so strong.
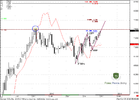
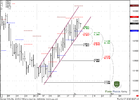
On weekly time frame we see very symmetrical AB-CD pattern with target around 7730 that almost agrees with 0.88 resistance. AB and CD legs very harmonic at least until now and if this harmony holds it can lead to strong resistance in D point and 0.88 resistance level. Weekly trend is also bullish.
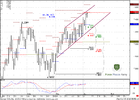
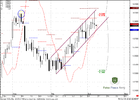
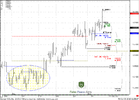
On daily time frame market is moving in parrallel chanel and you can see how weekly pivot resistances 1 (short dash lines) hold the rallies inside the channel.
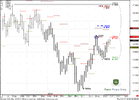
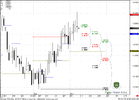
Now market has reached weekly and monthly pivot resistance 1 and upper border of the channel. The most suitable level for entering on the long side is a nearest Fib support 7348 that is coincides with weekly pivot point and lower border of the channel. I do not want to see deep retracement, below 7250 area - because it will destroy harmony in AB-CD pattern, and market will break channell. In this case our context will be under question. So, shallow retracement is a main factor that we should track.
So, that's being said, I expect that market will reach 7730 area. Possible enter 7340 area. We should exit if market will start to show deep retracement - below 7250 level.
Good morning,
I think that NZD has very interesting price action from position point of view.
On the monthly chart we see MACD Predictor failure pattern during 3 months, trend is bullish. Usually it leads to the previous highs that should be taken out by the price - market can clear 7605 area. Also we can see, that 0.786 Fib resistance has been touched once already, so this level is not so strong.
On weekly time frame we see very symmetrical AB-CD pattern with target around 7730 that almost agrees with 0.88 resistance. AB and CD legs very harmonic at least until now and if this harmony holds it can lead to strong resistance in D point and 0.88 resistance level. Weekly trend is also bullish.
On daily time frame market is moving in parrallel chanel and you can see how weekly pivot resistances 1 (short dash lines) hold the rallies inside the channel.
Now market has reached weekly and monthly pivot resistance 1 and upper border of the channel. The most suitable level for entering on the long side is a nearest Fib support 7348 that is coincides with weekly pivot point and lower border of the channel. I do not want to see deep retracement, below 7250 area - because it will destroy harmony in AB-CD pattern, and market will break channell. In this case our context will be under question. So, shallow retracement is a main factor that we should track.
So, that's being said, I expect that market will reach 7730 area. Possible enter 7340 area. We should exit if market will start to show deep retracement - below 7250 level.