Sive Morten
Special Consultant to the FPA
- Messages
- 18,695
Couple words about EUR currency…
Our EUR analysis that we’ve prepared on previous week is still valid. EUR stands just below strong resistance area, and I will be looking for signs of retracement on coming week. At the same time, I expect that EUR should show new high, because it not has quite reached weekly 100% expansion target at 1.4050.
Monthly
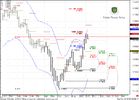
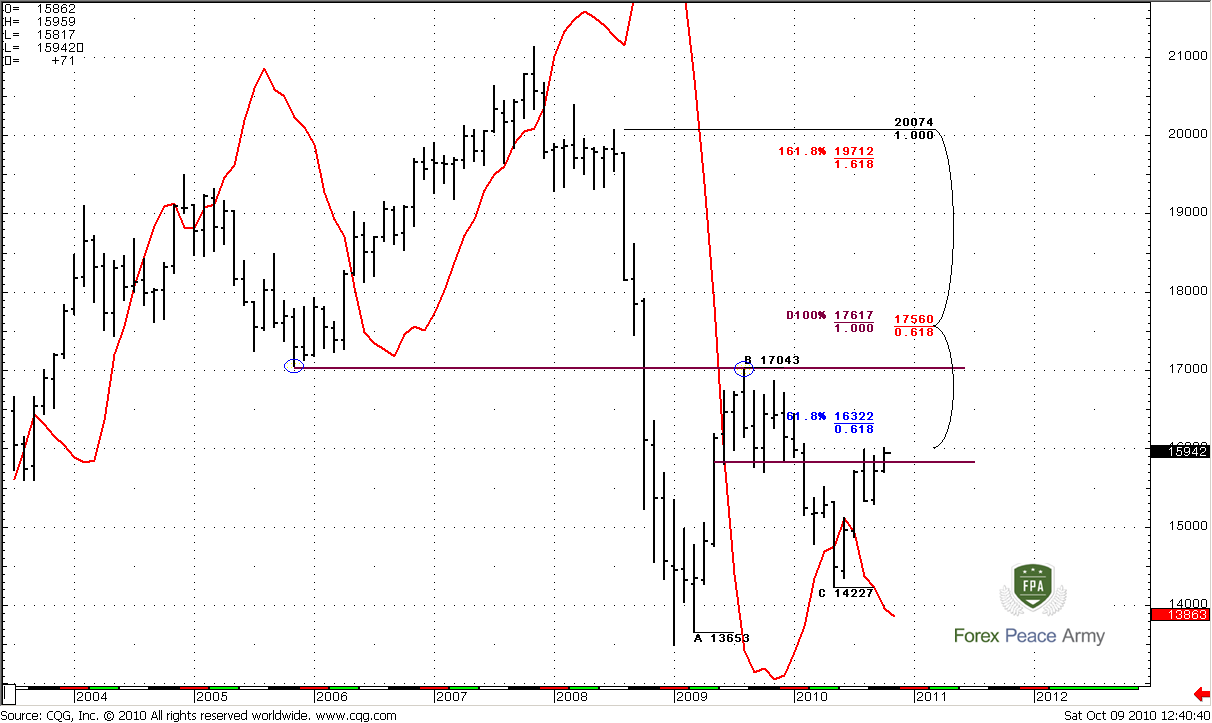
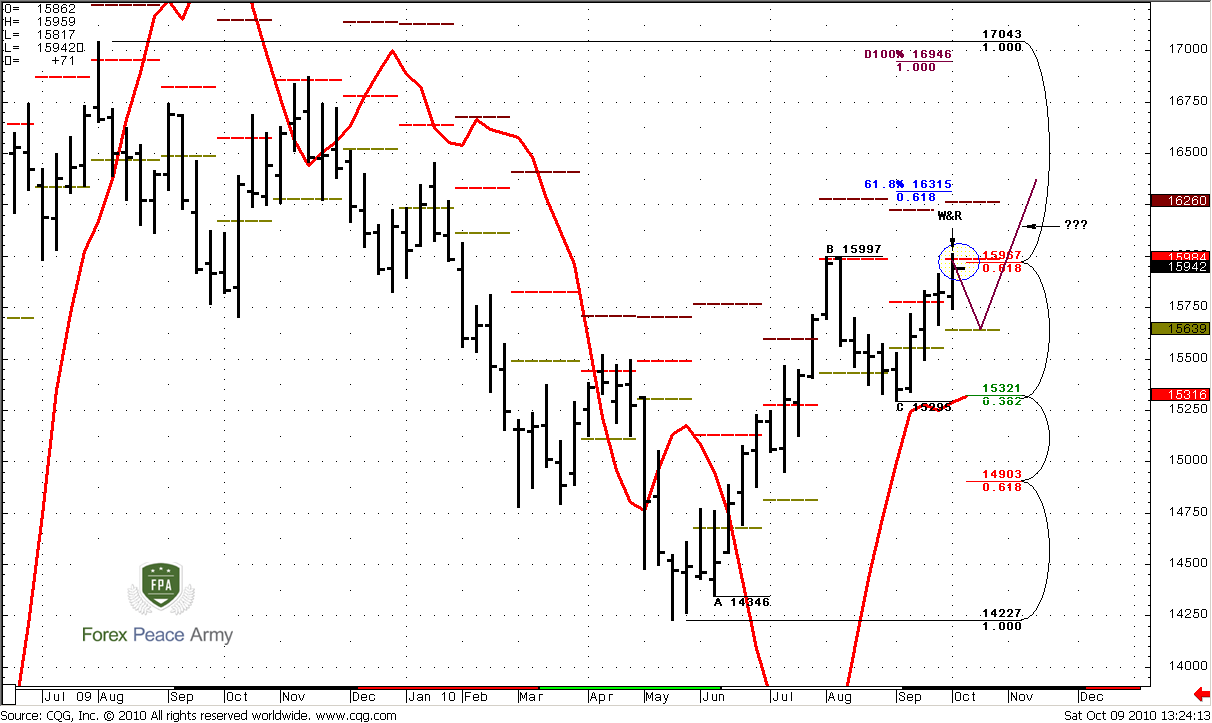
Today we will talk about GBP, and as usual, start from monthly chart. Trend is bullish, market neither oversold nor overbought currently. There is a couple of interesting things here. First one is a price action around MACD Predictor (red line). Look, how during previous penetration (when C-point has been formed) price just move below MACDP, shifted trend bearish and then just jumped out, and didn’t confirm trend shifting. This is a bullish sign and very often leads market to the previous highs – 1.7043. So, it means that market can take out previous highs and reach 100% expansion and Agreement around 1.7560 - 1.7617 in long-term perspective. But in shorter term is a bit early to talk about it, because October overbought at 1.6712 and 100% expansion target is above overbought and not “Logical” yet.
Second, look at area of consolidation between two horizon lines – 1.5950-1.70 roughly. During August and September market has tried to return in it, but failed both times. Although October bar is not closed yet, currently price is inside this range. If it will hold there, we can count on move to opposite border of the range, i.e. – 1.7050
Weekly
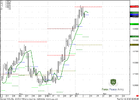
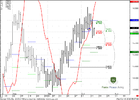
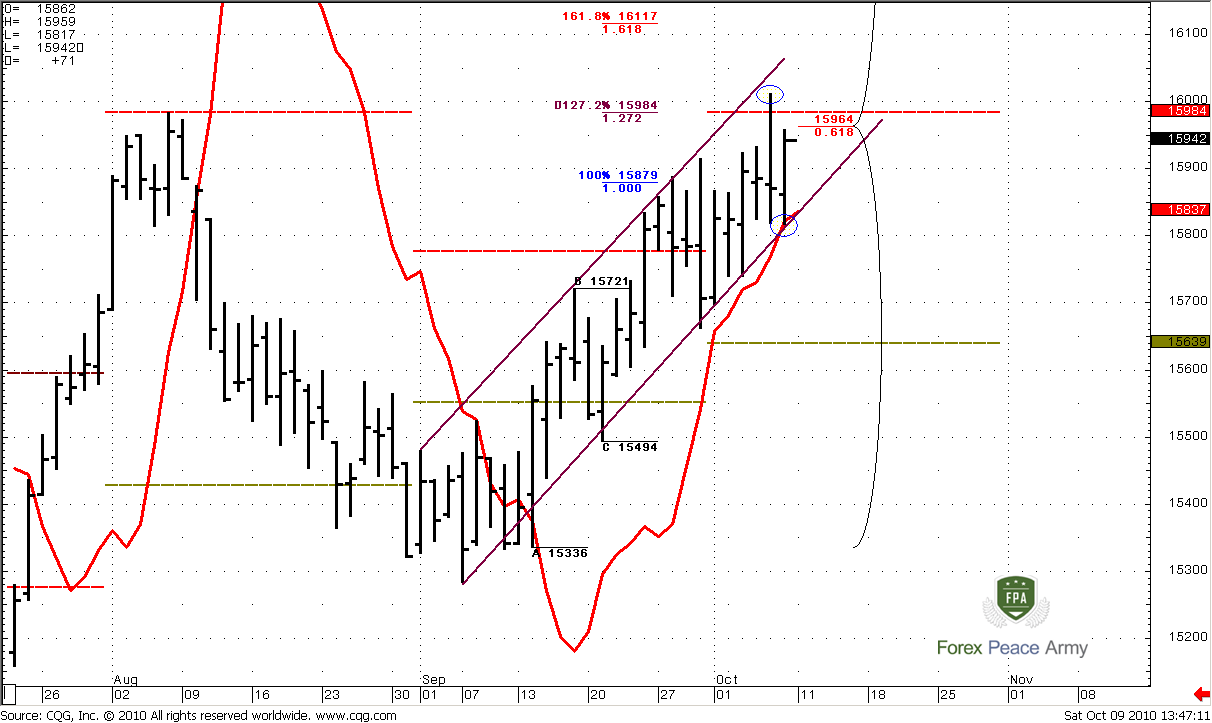
Weekly trend is bullish, there is no overbought on the market. But this is the time frame, where questions appear…From the one side, retracement from the AB leg up was very shallow, just 0.382, market has reached strong resistance combination – 5/8 Fib weekly resistance with monthly pivot resistance 1 and retraced. In general very bullish price action that should lead market to nearest 0.618 expansion target at 1.6315.From the other side – look at price action during recent week around the same area of resistance. Market has reached and penetrated this level again, established new highs (we’ve talked about it during the week) at 1.6013 level but did not pass through it and demonstrated Wash & Rinse of a previous highs and this 5/8 Fib resistance. October monthly pivot resistance 1 is also here, by the way, at 1.5984. In general, this is a short-term bearish signal that can lead to some retracement on the lower time frame. Also take a note, that October pivot (gold dash line) around 1.5639 has not been traded yet by the market. Odds suggest that pivots are traded in 70% of cases. So, the main question is will we see retracement down or not…
And here are some additional thoughts. Sometimes, when market stays just below some resistance level and shows relatively deep retracement between first attempt of breakout and second one, retracement between second and third (if it will happen at all) attempt should be not so deep, as on the chart.
Daily
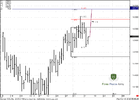
Here we can see clearer the same Wash & Rinse pattern. Also take a note, that market has reached 1.27 expansion target from ABC-bottom pattern precisely at 5/8 Fib resistance and monthly pivot resistance at 1.5984. But this is all that can lead to retracement.
Now about bullish signs… On Friday market has formed bullish MACDP failure (marked with circle) that can lead to either new Wash & Rinse or breakout of current resistance around 1.60. Which one pattern will prevail, who knows…
#1
Let’s look at the same daily chart, just for case if retracement will start. Usually, when market retraces during rallies, it retraces to the weekly pivot support 1 that is at 1.5783 at coming week. I think that market unlikely will show deep retracement, right to the monthly pivot point, if it will happen at all. So, my preferable levels to watch for – first Fib support and weekly pivot at 1.5879-1.5898 and the second one – 1.5783-1.5815 – daily confluence support and weekly pivot resistance1. I think that during the next week they will be major levels that we should care of. How should I use it? Well, first of all, I’ll be track will the pivot point hold the market from further retracement. If it will happen, then, possibly daily stop grabber will work and we see either breakout or new W&R and high.
If not – then market should reach the second level of support. And now let’s look at daily#3 chart, then you will understand why this level is so important…
#2
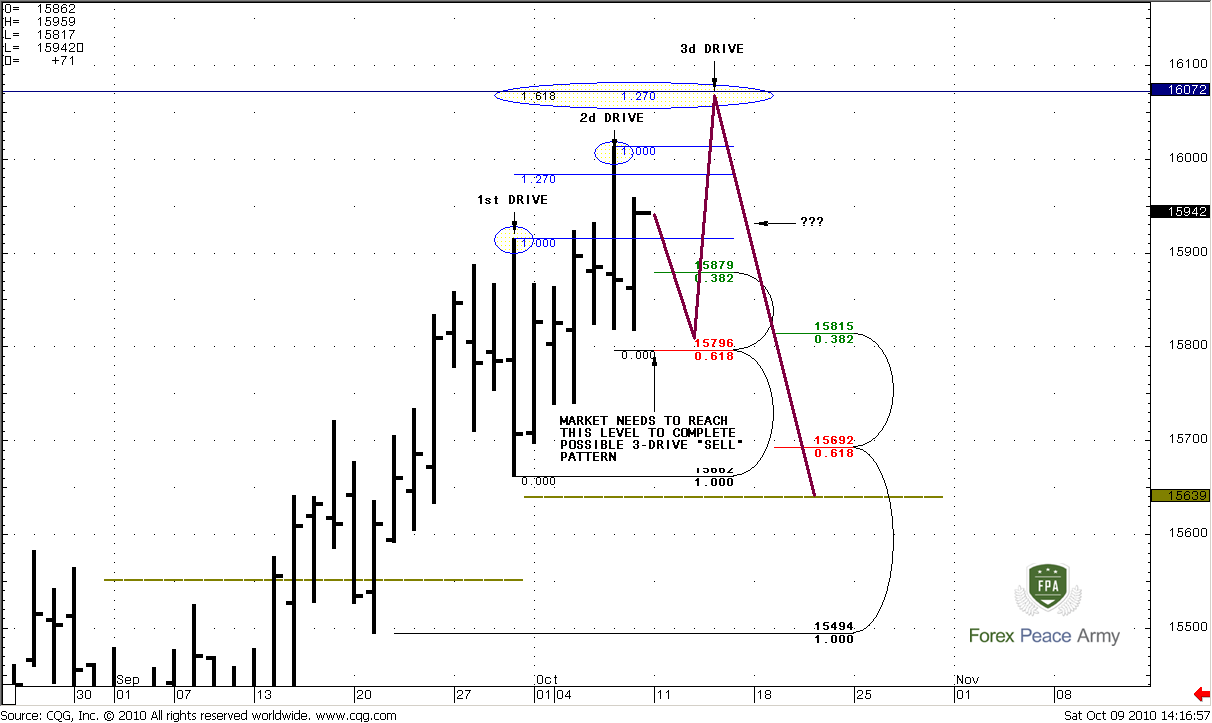
One of the possible scenarios can be a 3-Drive “Sell” pattern. We should not exclude it from our observation, because it satisfies both signals – from the one side W&R, because it includes retracement to daily Confluence support. From the other side – it leads to new highs that in accordance with daily Stop grabber signal.
See, the current high, that is a second drive in the pattern precisely at 1.27 expansion from the first drive. The third drive should be a confluence of 1.618 from first drive and 1.27 from the second one. For that purpose market should reach 1.5800 level – precisely our daily Confluence support and weekly pivot support 1.
#3
30-min
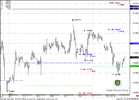
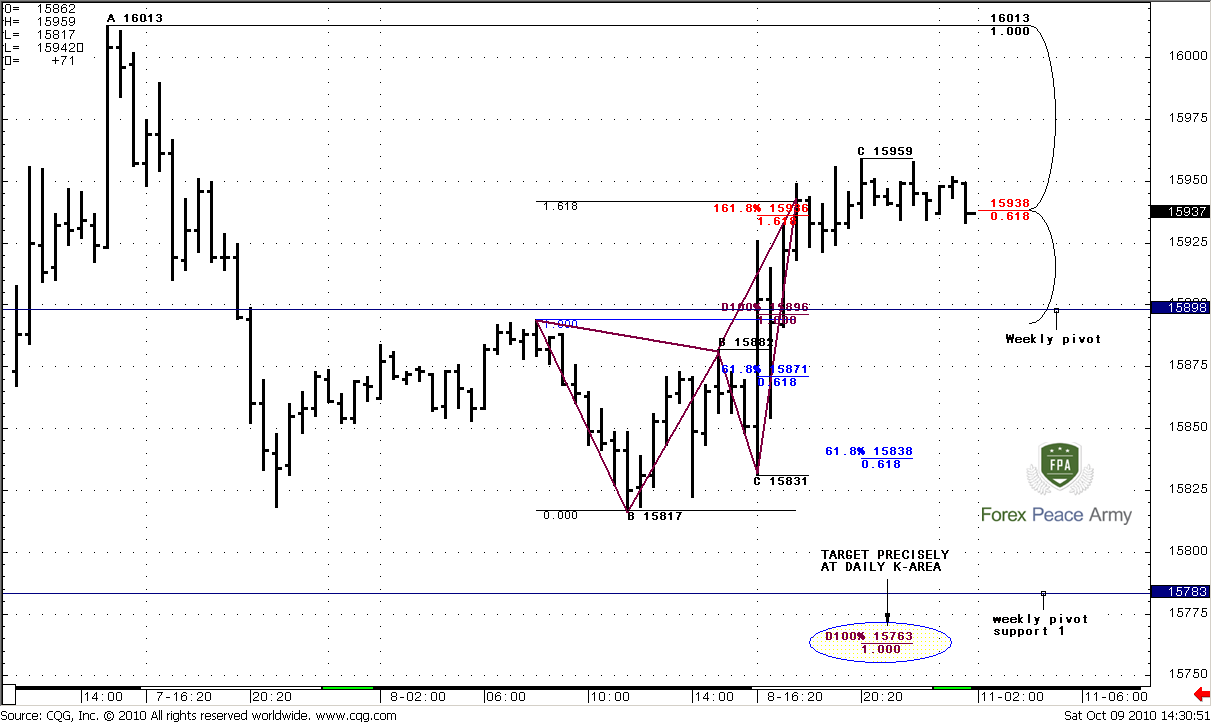
Here I want to offer you slice and dice game, if it suitable for you of cause. The point is that we can enter in the trade with not very strong “sell” context, but with amazing risk/reward ratio. Here are details. See, market has completed 1.618 “Butterfly Sell” at 1.5942 and 1.618 target from ABC-bottom pattern at 1.5936. Both targets are precisely at 0.618 Fib resistance from Wash and Rinse daily pattern. The target of possible move down is 1.5763 just around our daily Confluence support that we’ve talked about. Now, if market will start move down and reach weekly pivot at 1.5898 we can move stop to breakeven and wait. If pivot will hold the market – then, probably we should start preparation to upper break out, if market will down further – excellent, we will take chips off the table around 1.58…
Initial stop should be placed somewhere between 1.5975-1.60 area. Placing stops above the highs have no sense. If this was a real W&R and it will start to work, we should not see deep reverse move. Market already has reached 5/8 Fib resistance…
Conclusion:
Long-term.
I have a bullish view on the Cable and expect that market should reach 1.6350 at minimum, or even exceed highs around 1.7050.
Short term
On the shorter term though, all is not so clear, and market shows contradictive signals. Currently, it’s almost impossible to say, which one will prevail. The main question – will we see retracement down or not. But, we have a trading plan that will help us to act accordingly in spite of price action. Here it is:
1. If weekly pivot will hold the market, then, probably the upper breakout according to daily MACDP failure signal has more probability to happen.
2. If we will move below weekly pivot – next level to watch for and to close any intraday shorts is daily Confluence support around 1. 58.
3. After reaching 1.58 we can’t exclude finishing of 3-Drive ‘Sell’ pattern that is satisfied to both signals – MACD failure, because it will lead to establishing of new highs, and to daily W&R, cause 3-Drive Sell needs retracement to 1.58 to workout perfectly.
4. Intraday price action offers us to take part in risky but potentially very profitable trade. To take this signal or not – this question is up to you, just keep you risk reasonable.
The technical portion of Sive's analysis owes a great deal to Joe DiNapoli's methods, and uses a number of Joe's proprietary indicators. Please note that Sive's analysis is his own view of the market and is not endorsed by Joe DiNapoli or any related companies.
Our EUR analysis that we’ve prepared on previous week is still valid. EUR stands just below strong resistance area, and I will be looking for signs of retracement on coming week. At the same time, I expect that EUR should show new high, because it not has quite reached weekly 100% expansion target at 1.4050.
Monthly
Today we will talk about GBP, and as usual, start from monthly chart. Trend is bullish, market neither oversold nor overbought currently. There is a couple of interesting things here. First one is a price action around MACD Predictor (red line). Look, how during previous penetration (when C-point has been formed) price just move below MACDP, shifted trend bearish and then just jumped out, and didn’t confirm trend shifting. This is a bullish sign and very often leads market to the previous highs – 1.7043. So, it means that market can take out previous highs and reach 100% expansion and Agreement around 1.7560 - 1.7617 in long-term perspective. But in shorter term is a bit early to talk about it, because October overbought at 1.6712 and 100% expansion target is above overbought and not “Logical” yet.
Second, look at area of consolidation between two horizon lines – 1.5950-1.70 roughly. During August and September market has tried to return in it, but failed both times. Although October bar is not closed yet, currently price is inside this range. If it will hold there, we can count on move to opposite border of the range, i.e. – 1.7050
Weekly
Weekly trend is bullish, there is no overbought on the market. But this is the time frame, where questions appear…From the one side, retracement from the AB leg up was very shallow, just 0.382, market has reached strong resistance combination – 5/8 Fib weekly resistance with monthly pivot resistance 1 and retraced. In general very bullish price action that should lead market to nearest 0.618 expansion target at 1.6315.From the other side – look at price action during recent week around the same area of resistance. Market has reached and penetrated this level again, established new highs (we’ve talked about it during the week) at 1.6013 level but did not pass through it and demonstrated Wash & Rinse of a previous highs and this 5/8 Fib resistance. October monthly pivot resistance 1 is also here, by the way, at 1.5984. In general, this is a short-term bearish signal that can lead to some retracement on the lower time frame. Also take a note, that October pivot (gold dash line) around 1.5639 has not been traded yet by the market. Odds suggest that pivots are traded in 70% of cases. So, the main question is will we see retracement down or not…
And here are some additional thoughts. Sometimes, when market stays just below some resistance level and shows relatively deep retracement between first attempt of breakout and second one, retracement between second and third (if it will happen at all) attempt should be not so deep, as on the chart.
Daily
Here we can see clearer the same Wash & Rinse pattern. Also take a note, that market has reached 1.27 expansion target from ABC-bottom pattern precisely at 5/8 Fib resistance and monthly pivot resistance at 1.5984. But this is all that can lead to retracement.
Now about bullish signs… On Friday market has formed bullish MACDP failure (marked with circle) that can lead to either new Wash & Rinse or breakout of current resistance around 1.60. Which one pattern will prevail, who knows…
#1
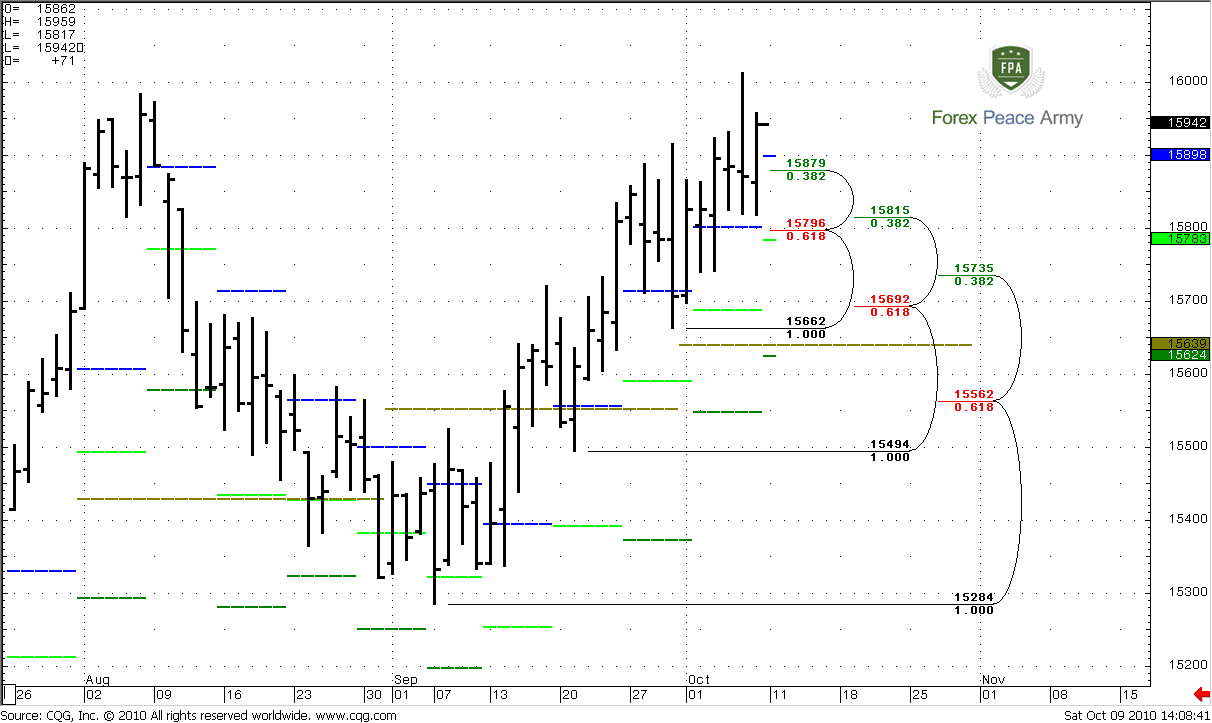
Let’s look at the same daily chart, just for case if retracement will start. Usually, when market retraces during rallies, it retraces to the weekly pivot support 1 that is at 1.5783 at coming week. I think that market unlikely will show deep retracement, right to the monthly pivot point, if it will happen at all. So, my preferable levels to watch for – first Fib support and weekly pivot at 1.5879-1.5898 and the second one – 1.5783-1.5815 – daily confluence support and weekly pivot resistance1. I think that during the next week they will be major levels that we should care of. How should I use it? Well, first of all, I’ll be track will the pivot point hold the market from further retracement. If it will happen, then, possibly daily stop grabber will work and we see either breakout or new W&R and high.
If not – then market should reach the second level of support. And now let’s look at daily#3 chart, then you will understand why this level is so important…
#2
One of the possible scenarios can be a 3-Drive “Sell” pattern. We should not exclude it from our observation, because it satisfies both signals – from the one side W&R, because it includes retracement to daily Confluence support. From the other side – it leads to new highs that in accordance with daily Stop grabber signal.
See, the current high, that is a second drive in the pattern precisely at 1.27 expansion from the first drive. The third drive should be a confluence of 1.618 from first drive and 1.27 from the second one. For that purpose market should reach 1.5800 level – precisely our daily Confluence support and weekly pivot support 1.
#3
30-min
Here I want to offer you slice and dice game, if it suitable for you of cause. The point is that we can enter in the trade with not very strong “sell” context, but with amazing risk/reward ratio. Here are details. See, market has completed 1.618 “Butterfly Sell” at 1.5942 and 1.618 target from ABC-bottom pattern at 1.5936. Both targets are precisely at 0.618 Fib resistance from Wash and Rinse daily pattern. The target of possible move down is 1.5763 just around our daily Confluence support that we’ve talked about. Now, if market will start move down and reach weekly pivot at 1.5898 we can move stop to breakeven and wait. If pivot will hold the market – then, probably we should start preparation to upper break out, if market will down further – excellent, we will take chips off the table around 1.58…
Initial stop should be placed somewhere between 1.5975-1.60 area. Placing stops above the highs have no sense. If this was a real W&R and it will start to work, we should not see deep reverse move. Market already has reached 5/8 Fib resistance…
Conclusion:
Long-term.
I have a bullish view on the Cable and expect that market should reach 1.6350 at minimum, or even exceed highs around 1.7050.
Short term
On the shorter term though, all is not so clear, and market shows contradictive signals. Currently, it’s almost impossible to say, which one will prevail. The main question – will we see retracement down or not. But, we have a trading plan that will help us to act accordingly in spite of price action. Here it is:
1. If weekly pivot will hold the market, then, probably the upper breakout according to daily MACDP failure signal has more probability to happen.
2. If we will move below weekly pivot – next level to watch for and to close any intraday shorts is daily Confluence support around 1. 58.
3. After reaching 1.58 we can’t exclude finishing of 3-Drive ‘Sell’ pattern that is satisfied to both signals – MACD failure, because it will lead to establishing of new highs, and to daily W&R, cause 3-Drive Sell needs retracement to 1.58 to workout perfectly.
4. Intraday price action offers us to take part in risky but potentially very profitable trade. To take this signal or not – this question is up to you, just keep you risk reasonable.
The technical portion of Sive's analysis owes a great deal to Joe DiNapoli's methods, and uses a number of Joe's proprietary indicators. Please note that Sive's analysis is his own view of the market and is not endorsed by Joe DiNapoli or any related companies.
")