Sive Morten
Special Consultant to the FPA
- Messages
- 18,669
EUR/USD Daily Update, Tue 01, March 2011
Good morning,
So, our bullish view has been confirmed by yesterday's market behavior.
Let's see, what we can trade today.
For Day traders:
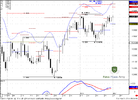
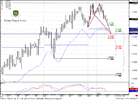
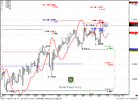
Daily chart.
There is nothing really new for you, guys. All trend are bullish, so you do not have a context to enter short. You need a retracement to enter on the long Side. The nearest Target is 1.4033 as due ABC swing and daily Overbought level. Very suitable level to watch for is 1.37 - it includes weekly + monthly pivot points, 3/8 Fib Support. Also it's confirmed by some intraday targets, that makes an Agreement with this area.
For intraday traders
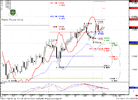
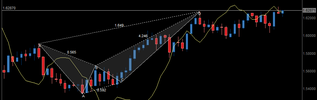
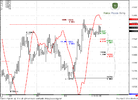
4-hour chart
Although, we can see that trend is bearish and nice bearish divergence with MACD , that public likes very much to trade - I think that context is bullish, because price action does not confirm trend shifting. Some confidence adds the fact that market stands just below the previous highs at 1.3856 and this is a great temptation for market-makers to trigger the stops just above this area. Still, if you're bearish - your target is 1.37 area.
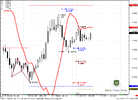
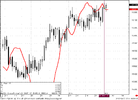
hourly chart
If you're bullish - your target is 1.3870-1.39, because you clearly see bullish Dynamic pressure here and Butterfly "Sell" pattern is forming with the target around 1.3880 - also there are some other targets in there and weekly pivot resistance 1. But be carefull of W&R - take profits there...
Stop could be placed just below 1.3770. In this case market will destroy Butterfly.
Good morning,
So, our bullish view has been confirmed by yesterday's market behavior.
Let's see, what we can trade today.
For Day traders:
Daily chart.
There is nothing really new for you, guys. All trend are bullish, so you do not have a context to enter short. You need a retracement to enter on the long Side. The nearest Target is 1.4033 as due ABC swing and daily Overbought level. Very suitable level to watch for is 1.37 - it includes weekly + monthly pivot points, 3/8 Fib Support. Also it's confirmed by some intraday targets, that makes an Agreement with this area.
For intraday traders
4-hour chart
Although, we can see that trend is bearish and nice bearish divergence with MACD , that public likes very much to trade - I think that context is bullish, because price action does not confirm trend shifting. Some confidence adds the fact that market stands just below the previous highs at 1.3856 and this is a great temptation for market-makers to trigger the stops just above this area. Still, if you're bearish - your target is 1.37 area.
hourly chart
If you're bullish - your target is 1.3870-1.39, because you clearly see bullish Dynamic pressure here and Butterfly "Sell" pattern is forming with the target around 1.3880 - also there are some other targets in there and weekly pivot resistance 1. But be carefull of W&R - take profits there...
Stop could be placed just below 1.3770. In this case market will destroy Butterfly.