- Forex, Gold, BTC Market Analysis | Trading Signals
- Sive Morten- Currencies, Gold, Bitcoin Daily Video
You are using an out of date browser. It may not display this or other websites correctly.
You should upgrade or use an alternative browser.
You should upgrade or use an alternative browser.
FOREX PRO Weekly June 27 - July 01, 2011
- Thread starter Sive Morten
- Start date
Lolly Tripathy
Sergeant Major
- Messages
- 515
Thank you very much
Sive sir,
You are the Hero as usual...
and My favorite...
Thank you very much for your weekly and daily analysis..
God bless you with Good Heath, Wealth and Prosperity
Sive sir,
You are the Hero as usual...
and My favorite...
Thank you very much for your weekly and daily analysis..
God bless you with Good Heath, Wealth and Prosperity
Sive Morten
Special Consultant to the FPA
- Messages
- 18,702
Hi Mr. Sive
last week in the introduction of FOREX PRO Weekly June 20 - 24, 2011 you have write
"Now September Futures is leading contract, so my quotes will be lower than on spot market."
i don't understand what this is. What this means? I would like to better understand this important aspect.
Very thank's and very GOOD JOB Sive!
You are really a big Signor.
Hi, from Italy
Hello Sive,
Your analysis is a great help. It is clear and very easily understandable.
However, Since I am a looking at the forex market and do not have access to Futures market quotes it makes it a bit difficult for me to relate to the levels that you mention. For example Daily Pivot point and Weekly Pivot point etc.
If not too much trouble could you kindly mention the diff between the futures price and the spot price at the time when you do you analysis so it will be easy for us to convert Futures into Spot prices.
Thanks appreciate your help
DD
Hello Daniel and Dubaidat
It does not make a big sense, because this difference is not constant and and gradually reduces to the expiration date of futures. Currently this difference is something around 30-35 pips. This difference comes from the way of futures pricing, because it has such component as (US rate-EU rate)X time to expiration.
As solution I can offer you such way - you can see on my charts extremes, highs or lows right? Then find the same on your chart and calculate the difference. That's simple.
Hey sive, thanks again for your analysis,
i was just wondering that you didnt mention the possible rate hike from the ECB, coming out soon? do u think that will play a VERY important part in shaping the euro future right after the vote on tuesday for greece?
Secondly, i read the commitment of traders report from chicago mercantile exchange, and more and more speculative long positions are being added to the euro futures, which might push euro higher?
thirdly, do u think the euro would be pushed down the recent lows but wont necessary take out the losses, but use them as support and turn around?
thanks sive!
Yousuf.
P.S, my team and i think the above so we might buy call options for the futures, your opinion would matter alot.
Hi Yousuf,
In current environment, ECB hiking is hardly possible. All attention will be on Greece on Wednesday.
Concerning speculative possitions - this does make sense, but a bit in longer term perspective.
You're talking about 1.37 area right? Well, this will be very strong support area. And it's worthy as an area to search for buy signals. But will they appear or not... that's the question. Currently we can't say that. So, we'll live - we'll see.
Options is a tricky substance. Very important to not be mispriced by your own model, and check for implied volatility first, use some specific indicators that will allow you to do that. Well, it's very big topic to discuss here.
Thanks, Stag. Quaterly chart is really important. Anyway we have to pay attention to 1.37. Probably it will not reverse there, it's too early to discuss it. But, if it will not turn from Monthly Confluence, Agreement, then it tells us that market is very bearish...Hi Sive, this narrow spread body with large volume is not very encouraging for the following quarter (for long positions). This suggests that an overall drop has a chance in the next quarter.
Maybe worth keeping in mind this larger pic in our shorter-term trading decisions.
All the best and thank you for your work.
Hi, Mr Daniele, Let me try to answer you, it means that the charts you see in Mr Morten`s analyses are from Futures market and not spot market and because of this there is a difference (now about 35 pips) between the price you see on your forex spot charts and the charts you see here. you can read Forex Military School, it`s very useful for understanding all aspects of forex market, here is info about futures market and spot forex :
https://www.forexpeacearmy.com/fore...ere-quite-different-story-futures-market.html
Thanks, Timsar for help.
It's really difficult to answer the same question again and again. But this is a part of my duties here.
") No problem.
No problem.Stag
Sergeant
- Messages
- 206
Hi Stag,
I would like to ask what MACD indicator you using? Would you mind sharing it if its not copyright material. I would really appreciate it.
Thanks
Hi Mrsaini, it is a proprietary MACD indicator as part of the analysis tool I use. I can not share it with you as a standalone indicator.
EUR hit 61.8 resistance and seems is turning back down, pivot untouched yet...and 2 important news
European Banks Closer to 70% Greek Rollover Deal - Bloomberg
Fed May Buy $300 Billion in Treasuries After QE2 - Bloomberg
European Banks Closer to 70% Greek Rollover Deal - Bloomberg
Fed May Buy $300 Billion in Treasuries After QE2 - Bloomberg
Confirmation signals
Hello everybody. Sive, first of all i'd like to thank you for your analysis. This week you warned us to be extra careful because very probably market would be driven by news and, as usual, you were right.
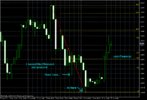
In the intraday section of the weekly review, you marked 1.4172-1.4175 as the (first) confluence area where we could open short positions. Today market estabilished lower lows, so i updated that confluence in my hourly chart (i've attached it). Here is my question: did you go short in that area? How did you take the decision to go/not to go short here? I'm asking you because you are teaching me well how to identify these areas (mainly using fibonacci retracement, fibonacci expansion and pivot point), but i find difficult to decide when it's a good idea entering the market and when it's better to stay out. Could you please explain us what signal you look for in lower timeframes? Maybe it could be useful for me and for other forumers to see some lower time frame charts of both type (where you entered the market and where you didn't entered the market).
Excuse me for bothering you and thank you in advance.
Hello everybody. Sive, first of all i'd like to thank you for your analysis. This week you warned us to be extra careful because very probably market would be driven by news and, as usual, you were right.
In the intraday section of the weekly review, you marked 1.4172-1.4175 as the (first) confluence area where we could open short positions. Today market estabilished lower lows, so i updated that confluence in my hourly chart (i've attached it). Here is my question: did you go short in that area? How did you take the decision to go/not to go short here? I'm asking you because you are teaching me well how to identify these areas (mainly using fibonacci retracement, fibonacci expansion and pivot point), but i find difficult to decide when it's a good idea entering the market and when it's better to stay out. Could you please explain us what signal you look for in lower timeframes? Maybe it could be useful for me and for other forumers to see some lower time frame charts of both type (where you entered the market and where you didn't entered the market).
Excuse me for bothering you and thank you in advance.
Attachments
Paul McConnell
Private, 1st Class
- Messages
- 66
Thank you!
As usual Sive your analysis is clear, concise and professional..
Much appreciated!
Regards,
Gryffn
As usual Sive your analysis is clear, concise and professional..
Much appreciated!
Regards,
Gryffn
drebg
Private
- Messages
- 12
Love your stuff, Sive... truly brilliant...
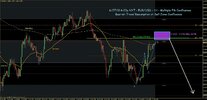
Here's my take off the hourly chart:
Multiple Fib Confluence including a 61.8, 38.2 and 100% Expansion.
Looking for the eventual move to 1.3700 to set-up for a long position. Good luck! Thanks!
InformedTrades - DREBG's Forex Blog
6/27/2011 - 6:23p - NYT - EUR/USD - Hourly Chart - Sell Zone Off Multiple Fib Confluence
Attachments
Last edited:
Sive,
This may be part of your update tomorrow, but can you tell me if we have a butterfly sell still valid from 2 weeks ago? it looks like potential CD move will have a target of 1.4531 on spot, or 1.4499 on futures. Being that this market is choppy waiting for the vote. and possibly to see how successful the strike is tomorrow, I am unsure. It would have to go through the 3x3 DMA and the MACDP to make it. I assume if it does penetrate the MACDP on the daily timeframe 1.4499/1.4531 is a logical resistance afterwards. I can not post a chart because in thinkorswim it looks like spaghetti. maybe someone else can draw it.
Thanks in advance.
Stag
Sergeant
- Messages
- 206
Love your stuff, Sive... truly brilliant...
Dear drebg, please reduce the size of the attached image, the forum becomes hardly usable for those having lower resolution displays (my laptop has a WUXGA resolution and it is still annoying). Thanks.
Similar threads
- Replies
- 5
- Views
- 220
- Replies
- 5
- Views
- 184
- Replies
- 11
- Views
- 277
- Replies
- 7
- Views
- 818
- Replies
- 11
- Views
- 303
- Forex, Gold, BTC Market Analysis | Trading Signals
- Sive Morten- Currencies, Gold, Bitcoin Daily Video