Sive Morten
Special Consultant to the FPA
- Messages
- 18,681
EUR/USD Daily Update, Tue 01, November, 2011
Good morning,
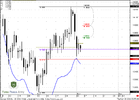
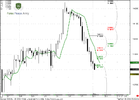
Yesterday EUR has shown real plunge. Our proper reaction to this is to look at situation in big picture. First, we’ve lost Stop grabber pattern on monthly chart – if you correspond that with discussion of dollar index, then you’ll understand that probability to move right to 1.18 has increased significantly.
The way, how market has reversed and where (major 0.618 Fib resistance), tells that we probably will see significant medium-term downward trend on EUR. This is not the way how retracement usually happens. This looks more as reversal – thrusting bars in opposite direction usually shows about changing of momentum. Market has broken as weekly pivot as weekly pivot support 1 just during 1 day.
So, keeping in mind long-term bullish perspective on Dollar index, we will move gradually day-by-day on EUR/USD.
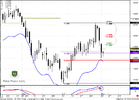
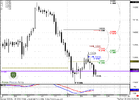
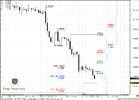
On daily chart we see that market is not at oversold but still at some support – November pivot and major 0.382 support level. This could lead to some pullback on intraday chart that could be used for short position entry. Also pay attention that market stands at trend breakeven point.
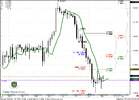
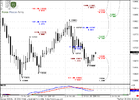
On 4-hour chart we see solid thrust up. Since we want to enter short, we need pullback and this could give us an excellent context for B&B sell. Scalpers may fix fast profit, others could move stop to b/e later and hope that market will continue down move. Personally I like 1.3930-1.3960 K-resistance area to search Sell patterns on 5-15 min charts.
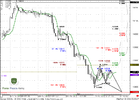
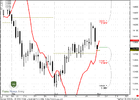
On hourly chart we see that some target stands below current market. There is some probability that market will hit them first and start retracement second. Anyway – today our major focus area is K-area on 4-hour chart where we have to search possibility to enter short.
Good morning,
Yesterday EUR has shown real plunge. Our proper reaction to this is to look at situation in big picture. First, we’ve lost Stop grabber pattern on monthly chart – if you correspond that with discussion of dollar index, then you’ll understand that probability to move right to 1.18 has increased significantly.
The way, how market has reversed and where (major 0.618 Fib resistance), tells that we probably will see significant medium-term downward trend on EUR. This is not the way how retracement usually happens. This looks more as reversal – thrusting bars in opposite direction usually shows about changing of momentum. Market has broken as weekly pivot as weekly pivot support 1 just during 1 day.
So, keeping in mind long-term bullish perspective on Dollar index, we will move gradually day-by-day on EUR/USD.
On daily chart we see that market is not at oversold but still at some support – November pivot and major 0.382 support level. This could lead to some pullback on intraday chart that could be used for short position entry. Also pay attention that market stands at trend breakeven point.
On 4-hour chart we see solid thrust up. Since we want to enter short, we need pullback and this could give us an excellent context for B&B sell. Scalpers may fix fast profit, others could move stop to b/e later and hope that market will continue down move. Personally I like 1.3930-1.3960 K-resistance area to search Sell patterns on 5-15 min charts.
On hourly chart we see that some target stands below current market. There is some probability that market will hit them first and start retracement second. Anyway – today our major focus area is K-area on 4-hour chart where we have to search possibility to enter short.
")