Sive Morten
Special Consultant to the FPA
- Messages
- 18,699
Monthly
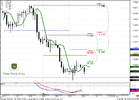
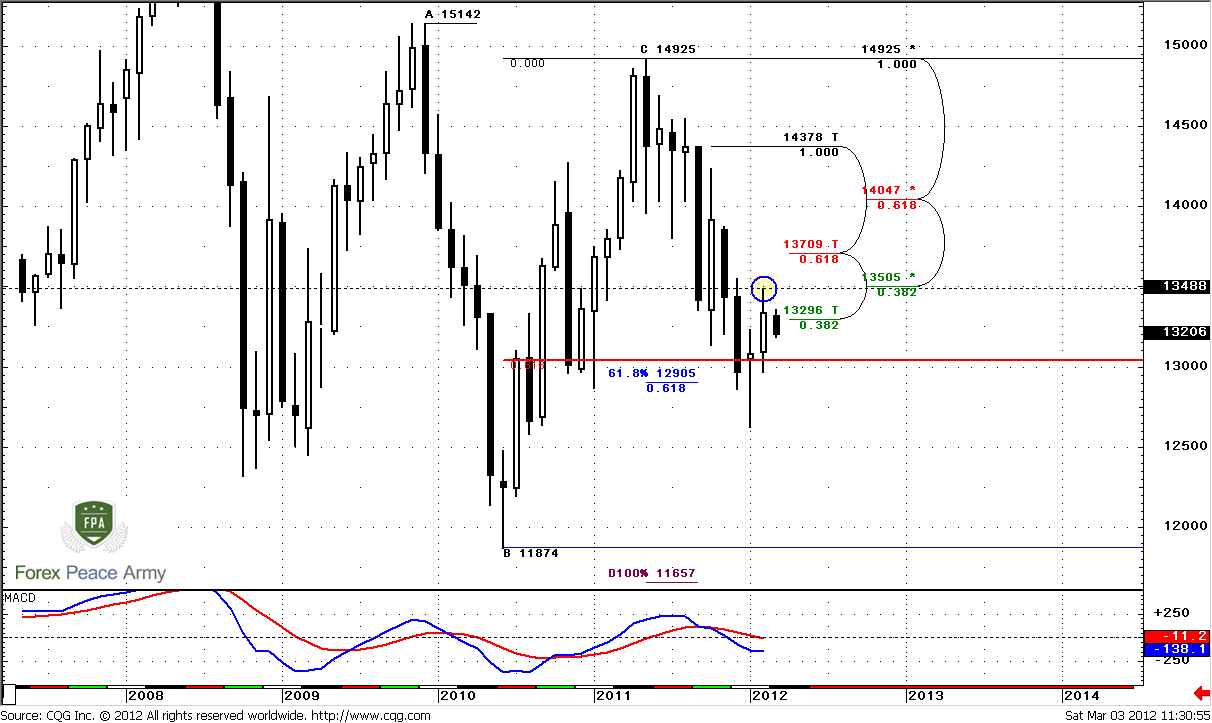
On monthly time frame market shows absolutely normal and logical price action. Particularly, after reaching of 0.618 AB-CD extension target it has shown 0.382 retracement. Actually, even market will stuck inside 1.3505-1.3707 monthly Confluence resistance area – this also will be normal. Major risk however for dollar is breakout of that zone. Because, as we’ve previously said, breakout of K-resistance after hitting just 0.618 target is not common practice.
Trend holds bearish and we do not have any directional patterns here, hence our context on monthly chart holds bearish. Currently there is no reason to suggest that our long-term expectation of 1.16 falls under question.
Unfortunately we can’t say will market continue move a bit higher or not by monthly chart. All that we can say is that market has reached major 3/8 resistance during previous month and now is showing some pullback from it.
As a conclusion here we can point that overall context holds bearish and market shows absolutely normal and logical price action after reaching minor extension target. Major task is try to estimate will market show deeper retracement to may be 1.37 level or just continue move lower.
Weekly
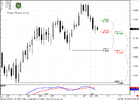
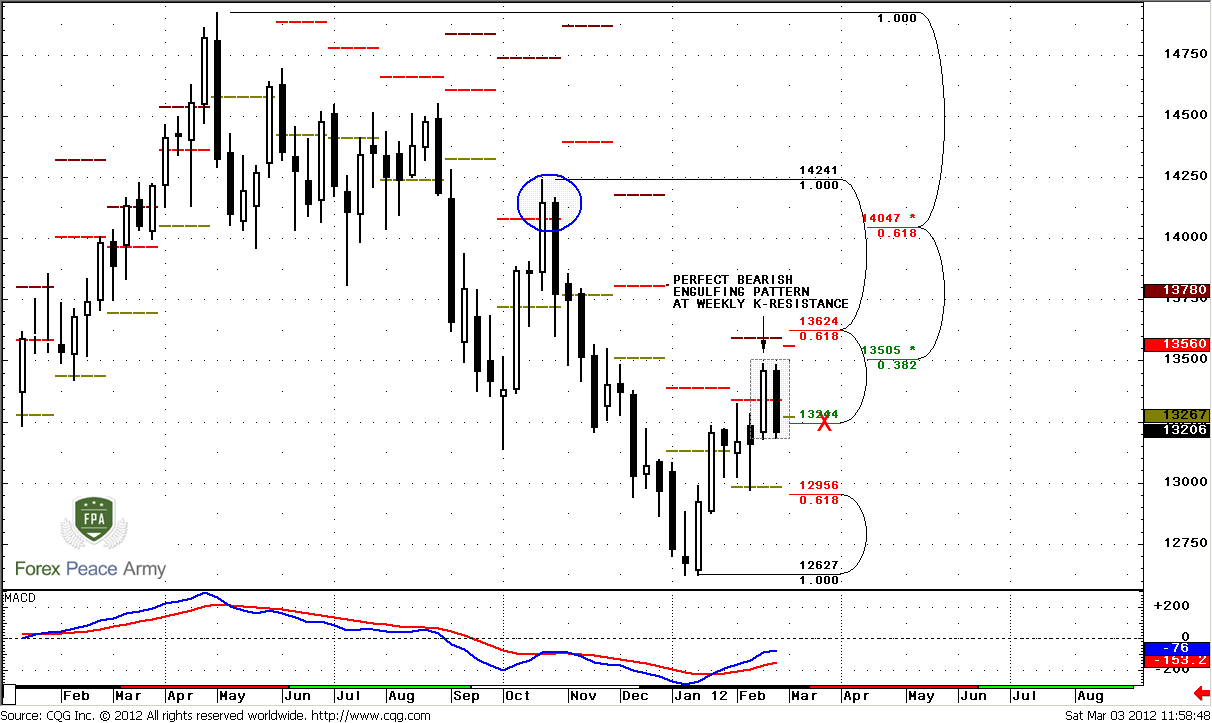
Here trend holds bullish, market is not at overbought, but at the same time we have some bearish signs. First is perfect bearish engulfing pattern that has formed right under strong K-resistance level. We can’t treat it either as W&R (of what?) or RRT – that’s why this is just engulfing. But here we still can apply the same rules of minimum target of this pattern – length of the bars to the downside. This is an area of 0.618 support at 1.2950.
Second is, take a look how market has behaved with recent monthly pivot resistance level. When take a look at it, I’ve thought about PR1 penetration – can we tell that this is normal or not. Then I’ve found akin situation sometime ago – I’ve marked it with circle. Take a look – PR1 holds retracement in the same manner and lets it to show some penetration of the level. You clearly see what has happened after that. This moment has pushed me to the thought, that current price action and its relation to PR1 could mean the same – it could mean the end of upward retracement. Is it true or not – we’ll see, but It looks important and I just share with you with this moment.
Third moment is that market has closed below monthly pivot. Although there is a pretty much room till the end of the month and everything could change, currently this is definitely not a bullish sign.
So, how we can use these moments? For long-term traders it will be better to wait of trend shifting to bearish and then use nearest upward retracement to enter short. This is just safer, because currently we still can’t exclude some deeper retracement up on weekly time frame. For daily traders and intraday traders there is another possibility exist – trade this bearish engulfing pattern, because that we clearly see it’s failure point – top at 1.3488. If it will work we will get huge advantage, since we will know the direction of the market for 1-2 weeks, until it will hit the target. On lower time frames we will focus on this possibility.
Daily
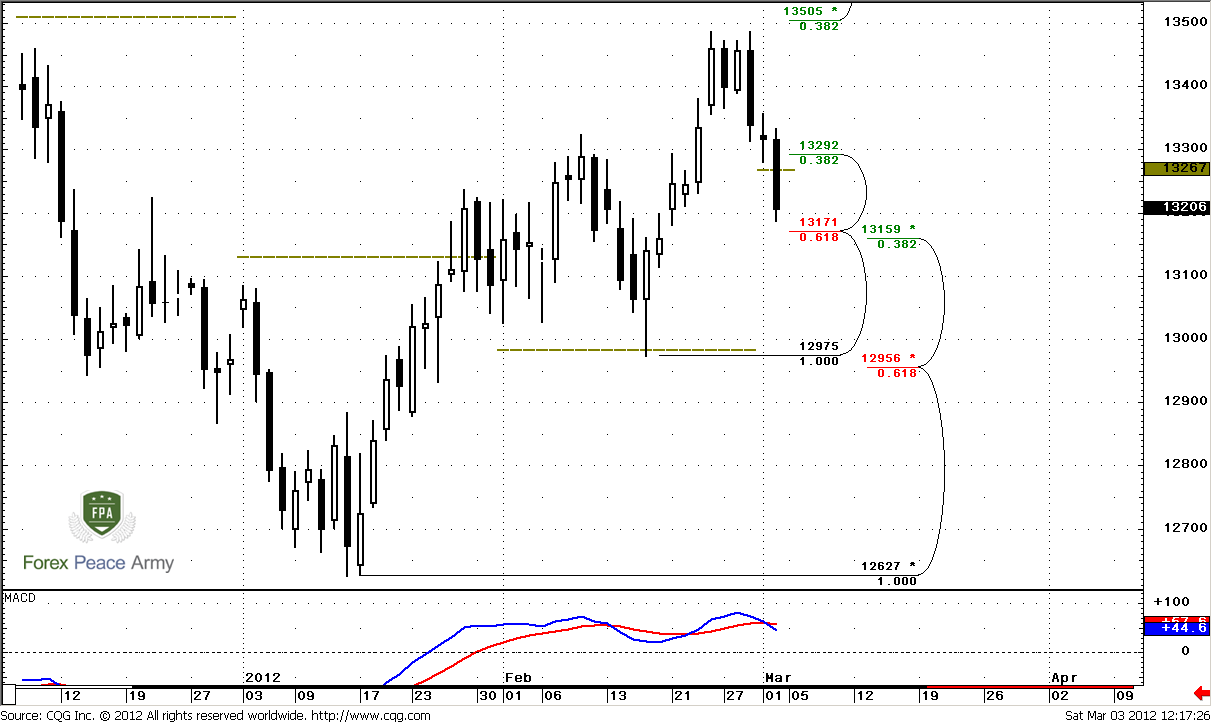
So how we will trade this engulfing pattern? Daily chart seems as great assistant here. First of all, yesterday market has confirmed bear trend by close price and destroyed any hope of possible Stop Grabber pattern. Second is, as we’ve previously said, if market will move below 1.3265 area then it will continue move to daily K-support at 1.3160-1.3170. It’s probably obvious that market will reach it since currently there is no barriers between current price and this level.
Since K-support is significant area, we can count on upward retracement from here. Such kind of retracement is very common for engulfing patterns after its initial completion. Usually retracement reaches 0.382-0.5 area, but could be deeper, although this is unwelcome scenario. So, the trading plan is simple – to wait this retracement and based on intraday charts estimate where to enter short. This probably will be done somewhere on Tue or Wed on next week.
Today we can only try to make some assumption about possible retracement destination, based on intraday charts analysis.
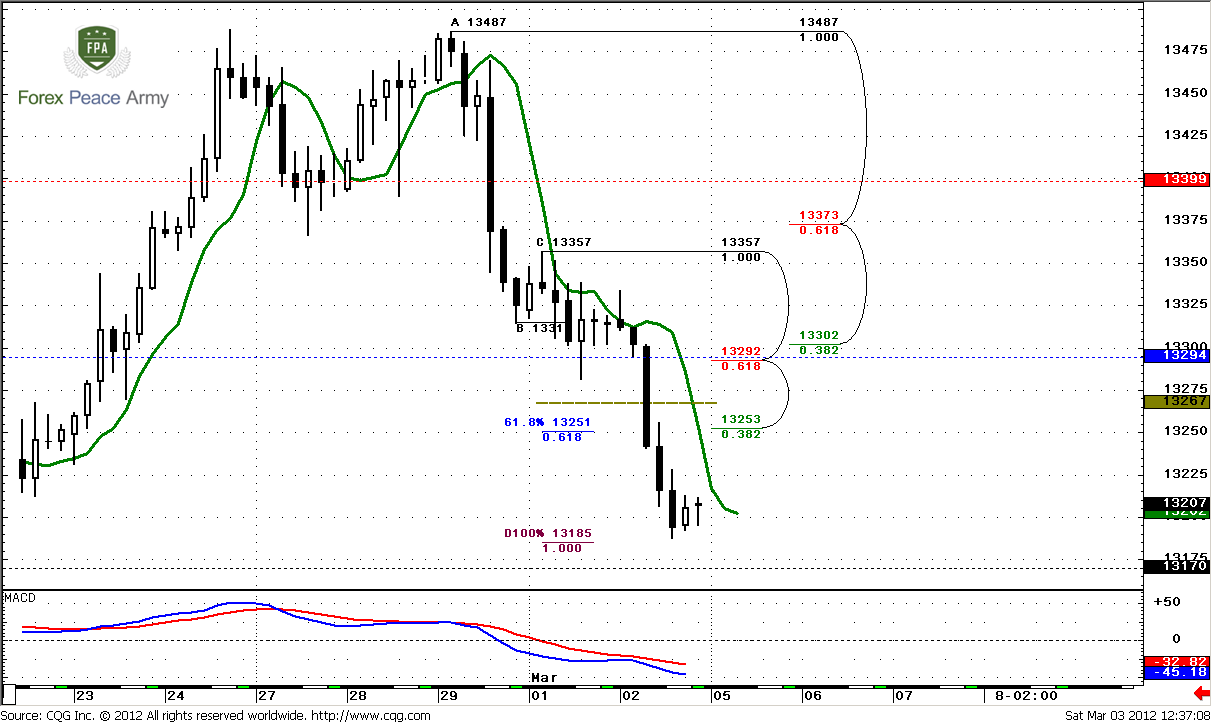
4-hour
Trend is bearish here, but in current environment this is not so important. We have not bad thrust down here that could become context for directional trade – B&B or DRPO. I dare to suggest that since 1.3170 is K-support at daily, then DRPO looks as more probable. 4-hour chart shows perfect picture, that we always would like to see but it very rare works perfectly unfortunately. This is K-resistance area accurately around weekly pivot 1.3294 and that is at the same time perfect area to enter short with weekly engulfing pattern. Some of you, who want to take more risk – also could try to trade DiNapoli Directional pattern, if it will appear of cause…
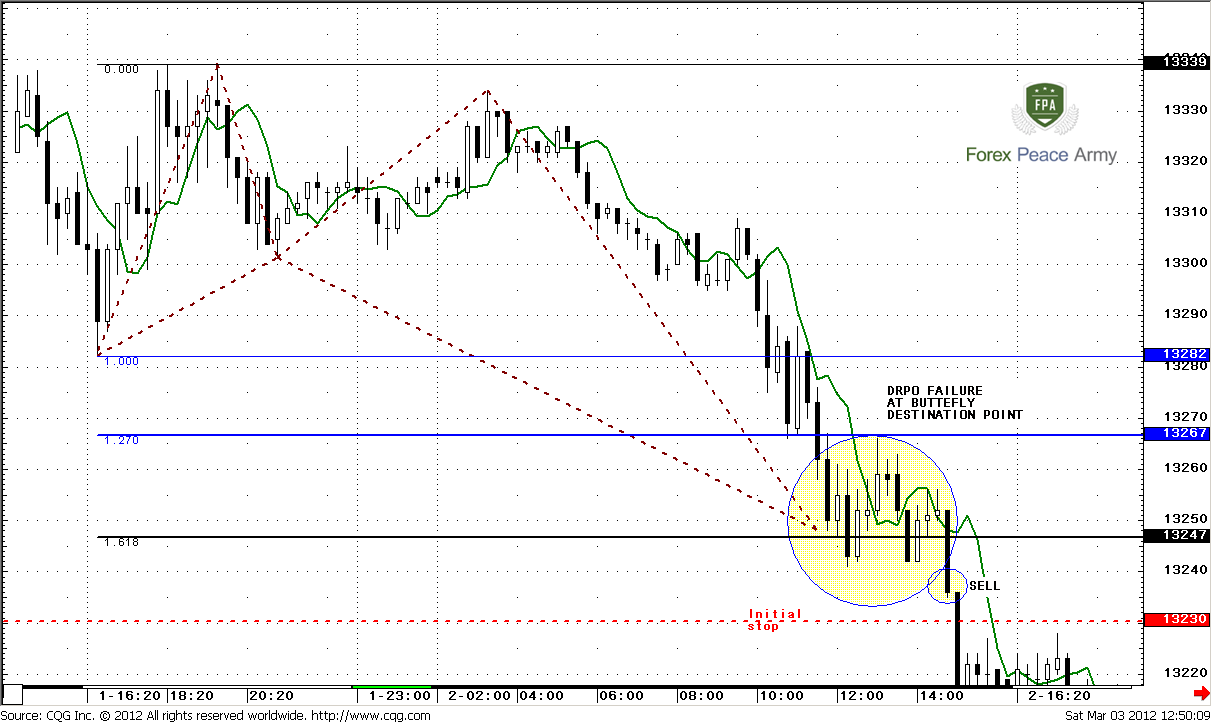
15min – yesterday trading plan blamestorming
I do not like to make a rearview mirror analysis by telling what we had have to do, but today I’ve decided to do it, because particularly this example seems quite interesting. Here is how I’ve traded this butterfly. I’ve made two entries. First enter with 0.2 lot was at 1.27 of butterfly 1.3267, second entry - at 1.3245 1.618 level with 0.4 lots. So, my average position was 0.6 lots at 1.3257. Initial stop was place according to rules that we’ve written in our Forex Military School. I use EUR harmonic number and place stop 17 pips lower of Butterfly completion point.
Perfect trade assumes move stop at breakeven, when market has shown upward pullback from 1.618 level, but I didn’t do this (was busy with other job). When I’ve taken a look at price action – market was forming DRPO “Buy” pattern – that was absolutely in a row with expectation. Then it has turned to DRPO “Failure” that is also direction pattern but of opposite value. I reverse (close previous and sell) my position with 1.0 lot to the downside at “Sell” area. Now it probably stands at breakeven, or may be with some profit. That is not so important here.
If you, conversely to me, have entered only at 1.618 level – you had even better opportunity, since you were able to exit at breakeven from butterfly (or even with some profit) and enter short by DRPO “Failure” pattern. I see the major conclusion from this example and particularly from intraday trading – why it seems difficult to positional trading:
1. You have to switch your mind in opposite direction, when some 100% patterns are appearing on market.
2. You have to do it fast.
3. Fine tuning of your entry/stops levels and conditions when and where you will move your stops and by what reason give you solid help, when your trade is underway.
Conclusion:
Long-term bias holds bearish, but weekly time frame does not exclude some upward continuation. So, for positional traders will be safer to enter short, when and if weekly trend will turn bearish. Long-term target still stands at 1.16 area
On short-term perspective we have weekly bearish engulfing pattern, that probably could traded. We expect some downward continuation to 1.3160-1.3170 K-support area and then upward retracement that could be used for short entry. It will be perfect if this retracement will stop around weekly pivot point.
The technical portion of Sive's analysis owes a great deal to Joe DiNapoli's methods, and uses a number of Joe's proprietary indicators. Please note that Sive's analysis is his own view of the market and is not endorsed by Joe DiNapoli or any related companies.
On monthly time frame market shows absolutely normal and logical price action. Particularly, after reaching of 0.618 AB-CD extension target it has shown 0.382 retracement. Actually, even market will stuck inside 1.3505-1.3707 monthly Confluence resistance area – this also will be normal. Major risk however for dollar is breakout of that zone. Because, as we’ve previously said, breakout of K-resistance after hitting just 0.618 target is not common practice.
Trend holds bearish and we do not have any directional patterns here, hence our context on monthly chart holds bearish. Currently there is no reason to suggest that our long-term expectation of 1.16 falls under question.
Unfortunately we can’t say will market continue move a bit higher or not by monthly chart. All that we can say is that market has reached major 3/8 resistance during previous month and now is showing some pullback from it.
As a conclusion here we can point that overall context holds bearish and market shows absolutely normal and logical price action after reaching minor extension target. Major task is try to estimate will market show deeper retracement to may be 1.37 level or just continue move lower.
Weekly
Here trend holds bullish, market is not at overbought, but at the same time we have some bearish signs. First is perfect bearish engulfing pattern that has formed right under strong K-resistance level. We can’t treat it either as W&R (of what?) or RRT – that’s why this is just engulfing. But here we still can apply the same rules of minimum target of this pattern – length of the bars to the downside. This is an area of 0.618 support at 1.2950.
Second is, take a look how market has behaved with recent monthly pivot resistance level. When take a look at it, I’ve thought about PR1 penetration – can we tell that this is normal or not. Then I’ve found akin situation sometime ago – I’ve marked it with circle. Take a look – PR1 holds retracement in the same manner and lets it to show some penetration of the level. You clearly see what has happened after that. This moment has pushed me to the thought, that current price action and its relation to PR1 could mean the same – it could mean the end of upward retracement. Is it true or not – we’ll see, but It looks important and I just share with you with this moment.
Third moment is that market has closed below monthly pivot. Although there is a pretty much room till the end of the month and everything could change, currently this is definitely not a bullish sign.
So, how we can use these moments? For long-term traders it will be better to wait of trend shifting to bearish and then use nearest upward retracement to enter short. This is just safer, because currently we still can’t exclude some deeper retracement up on weekly time frame. For daily traders and intraday traders there is another possibility exist – trade this bearish engulfing pattern, because that we clearly see it’s failure point – top at 1.3488. If it will work we will get huge advantage, since we will know the direction of the market for 1-2 weeks, until it will hit the target. On lower time frames we will focus on this possibility.
Daily
So how we will trade this engulfing pattern? Daily chart seems as great assistant here. First of all, yesterday market has confirmed bear trend by close price and destroyed any hope of possible Stop Grabber pattern. Second is, as we’ve previously said, if market will move below 1.3265 area then it will continue move to daily K-support at 1.3160-1.3170. It’s probably obvious that market will reach it since currently there is no barriers between current price and this level.
Since K-support is significant area, we can count on upward retracement from here. Such kind of retracement is very common for engulfing patterns after its initial completion. Usually retracement reaches 0.382-0.5 area, but could be deeper, although this is unwelcome scenario. So, the trading plan is simple – to wait this retracement and based on intraday charts estimate where to enter short. This probably will be done somewhere on Tue or Wed on next week.
Today we can only try to make some assumption about possible retracement destination, based on intraday charts analysis.
4-hour
Trend is bearish here, but in current environment this is not so important. We have not bad thrust down here that could become context for directional trade – B&B or DRPO. I dare to suggest that since 1.3170 is K-support at daily, then DRPO looks as more probable. 4-hour chart shows perfect picture, that we always would like to see but it very rare works perfectly unfortunately. This is K-resistance area accurately around weekly pivot 1.3294 and that is at the same time perfect area to enter short with weekly engulfing pattern. Some of you, who want to take more risk – also could try to trade DiNapoli Directional pattern, if it will appear of cause…
15min – yesterday trading plan blamestorming
I do not like to make a rearview mirror analysis by telling what we had have to do, but today I’ve decided to do it, because particularly this example seems quite interesting. Here is how I’ve traded this butterfly. I’ve made two entries. First enter with 0.2 lot was at 1.27 of butterfly 1.3267, second entry - at 1.3245 1.618 level with 0.4 lots. So, my average position was 0.6 lots at 1.3257. Initial stop was place according to rules that we’ve written in our Forex Military School. I use EUR harmonic number and place stop 17 pips lower of Butterfly completion point.
Perfect trade assumes move stop at breakeven, when market has shown upward pullback from 1.618 level, but I didn’t do this (was busy with other job). When I’ve taken a look at price action – market was forming DRPO “Buy” pattern – that was absolutely in a row with expectation. Then it has turned to DRPO “Failure” that is also direction pattern but of opposite value. I reverse (close previous and sell) my position with 1.0 lot to the downside at “Sell” area. Now it probably stands at breakeven, or may be with some profit. That is not so important here.
If you, conversely to me, have entered only at 1.618 level – you had even better opportunity, since you were able to exit at breakeven from butterfly (or even with some profit) and enter short by DRPO “Failure” pattern. I see the major conclusion from this example and particularly from intraday trading – why it seems difficult to positional trading:
1. You have to switch your mind in opposite direction, when some 100% patterns are appearing on market.
2. You have to do it fast.
3. Fine tuning of your entry/stops levels and conditions when and where you will move your stops and by what reason give you solid help, when your trade is underway.
Conclusion:
Long-term bias holds bearish, but weekly time frame does not exclude some upward continuation. So, for positional traders will be safer to enter short, when and if weekly trend will turn bearish. Long-term target still stands at 1.16 area
On short-term perspective we have weekly bearish engulfing pattern, that probably could traded. We expect some downward continuation to 1.3160-1.3170 K-support area and then upward retracement that could be used for short entry. It will be perfect if this retracement will stop around weekly pivot point.
The technical portion of Sive's analysis owes a great deal to Joe DiNapoli's methods, and uses a number of Joe's proprietary indicators. Please note that Sive's analysis is his own view of the market and is not endorsed by Joe DiNapoli or any related companies.