Sive Morten
Special Consultant to the FPA
- Messages
- 18,679
EUR/USD Daily Update, Tue 08, May 2012
Hi everybody,
since I didn't reserve posts, you will have to catch updates inside this tread")
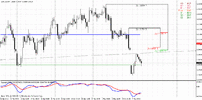
Market has shown solid gap down yesterday. On daily time frame it means that Butterfly "buy" will not appear, but there is not a big loss. Although market has shown a bit deeper move down, it still finds support ant double Pivot support area. Trend holds bearish and currently I do not see any reasons why we have to deny our expectation of reaching 1.29 level. So, I suppose that our daily analysis is still valid.
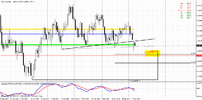
On 4 hour chart you see that our level to enter short - K-area has drifted significantly lower due gap open to 1.3080-1.3093 level. Trend turns bullish. One important thing here is the fact that gap has not been filled totally. It tells that market could show AB=CD upward retracement to 0.618 extension that creates Agreement with K-area or even full AB=CD to 1.3110. So, level to watch for as potential short entry zone is 1.3080-1.3110.
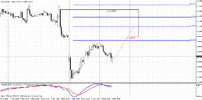
On houlry chart I would like to attract your attention to the nature of upward move after gap. This move is quite different from previous move down and I suspect that it has retracement nature, at least currently it shows no thrusting attempts. That is relative confirmation of bears' strength.
So, although price action was a bit more active that I've supposed - it no cancels our analysis. Watch for 1.3080-1.3110 area for potential short entry. Move your stop to b/e asap.
Hi everybody,
since I didn't reserve posts, you will have to catch updates inside this tread
Market has shown solid gap down yesterday. On daily time frame it means that Butterfly "buy" will not appear, but there is not a big loss. Although market has shown a bit deeper move down, it still finds support ant double Pivot support area. Trend holds bearish and currently I do not see any reasons why we have to deny our expectation of reaching 1.29 level. So, I suppose that our daily analysis is still valid.
On 4 hour chart you see that our level to enter short - K-area has drifted significantly lower due gap open to 1.3080-1.3093 level. Trend turns bullish. One important thing here is the fact that gap has not been filled totally. It tells that market could show AB=CD upward retracement to 0.618 extension that creates Agreement with K-area or even full AB=CD to 1.3110. So, level to watch for as potential short entry zone is 1.3080-1.3110.
On houlry chart I would like to attract your attention to the nature of upward move after gap. This move is quite different from previous move down and I suspect that it has retracement nature, at least currently it shows no thrusting attempts. That is relative confirmation of bears' strength.
So, although price action was a bit more active that I've supposed - it no cancels our analysis. Watch for 1.3080-1.3110 area for potential short entry. Move your stop to b/e asap.