FOREX PRO Weekly May 07-11, 2012

Sive,

I still can't believe you do this for us just because you want to. Incredible! I take notes, I print out charts, I watch over and over all of the videos and I really feeling like I'm learning. Thanks again, I hope to start posting some meaningful questions soon but for now i watch, read, listen and learn!

 
Hello everyone,

First of all I want to thank Mr.Sive for his great work as usual, Thank you very much , You helped me a lot ...

Also if anyone can confirm the Double REPO on Gold Monthly chart .

gold.jpg

Thanks in advance..
 
my undestanding is that to have a classic DRPO you need to have nice thrust for at least 8 - 10 candles and none of those candles should have closed under/above the 3x3 DMA, which seems to have been the case on your chart. so no classic DRPO. perhaps it can be treated as a DRPO LAL? but since it's not a classic pattern anymore, i guess the probability of it behaving as a DRPO is 50-50. so i'd use some other indicators as well here.

Hello everyone,

First of all I want to thank Mr.Sive for his great work as usual, Thank you very much , You helped me a lot ...

Also if anyone can confirm the Double REPO on Gold Monthly chart .

View attachment 5397

Thanks in advance..
 
sive, what do you reckon? short from k-area around 3080-94? although there seems to be plenty of sell orders already around 306x.
 
Hi Synchronicity,
I have posted this in one of the thread U talk specifically on fib tree. but I felt U might not see it that is why am posting here.
First I must say thank U for your good work and sharing of one of your intelligent properties with the public.
I have tried the fib tree in MT4 Alpari & GFT UK it display the the base line i.e. (1) but it does not display (3) 0.382 & (5) 0.618.
Pls how can I set it to display (3) & (5)?
thank once again for your assistance and generosity.
 
my undestanding is that to have a classic DRPO you need to have nice thrust for at least 8 - 10 candles and none of those candles should have closed under/above the 3x3 DMA, which seems to have been the case on your chart. so no classic DRPO. perhaps it can be treated as a DRPO LAL? but since it's not a classic pattern anymore, i guess the probability of it behaving as a DRPO is 50-50. so i'd use some other indicators as well here.

I agree with triantus that we need good quality thrust. This trust up has several retracements, we wanna see continued pressure, although even it shows a lot of little retracements there are no closes below 3x3DMA , contrary to what triantus said. I think even if its a LAL it can be used as good context for trading the daily TF.

sive, what do you reckon? short from k-area around 3080-94? although there seems to be plenty of sell orders already around 306x.

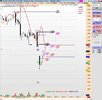
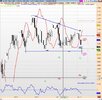
My name is not Sive, lol, but ill just tell u what I think. Shorting the 4-hour K-resistance area could be a good trade for 1H or 15 M Time frame. However if your thinking to enter on that area for a Daily Time frame trade I would be carefull this is not a Failure breakout of the Descending triangle as we have just touched .618 retracement.

4hourkresistance.jpgdaily triangle.jpg
 
Hey Sive,
Am sorry I do not notice U do not reserve update.
I just notice it now. I disorganize the arrangement sorry House.
 
Hey Sive,
Am sorry I do not notice U do not reserve update.
I just notice it now. I disorganize the arrangement sorry House.

notice it also. anyway since your in the tread, we can always look into the previous funny comment, it reflect the old post for your review.
and market did a small reversal at 1.3065 to current 1.3031, it the market break 1.3020-1.3030 on daily time frame, would say the trend is moving down to what sive has mention in his analysis to 1.29000-1.2954 and even to 1.27.

been watching in silence for many years looking into sive's analysis.
and it has been a blessing reading the material from sive

regards
daniellim
 
Back
Top