acetraderfx
AceTrader.com Representative
- Messages
- 1,109
DAILY USD/JPY TECHNICAL OUTLOOK
Last Update At 21 Mar 2014 00:50GMT
Trend Daily Chart
Sideways
Daily Indicators
Turning up
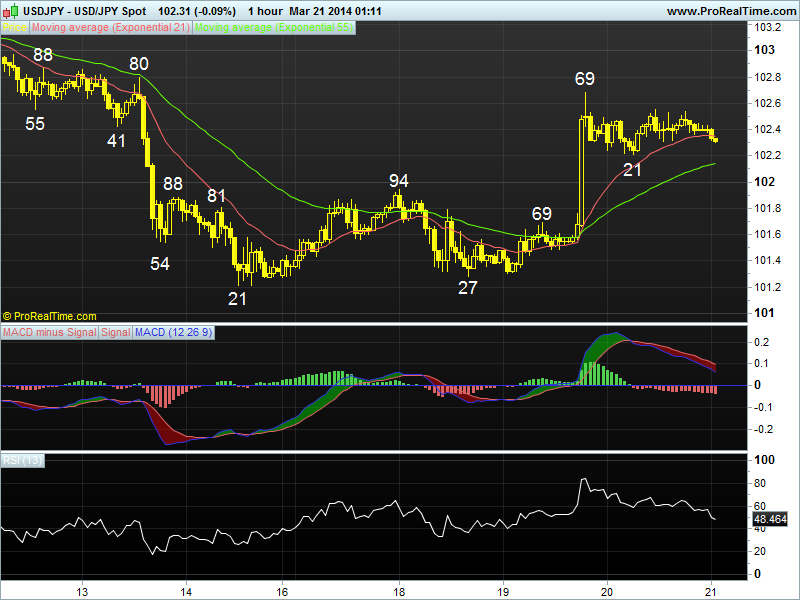
21 HR EMA
102.36
55 HR EMA
102.13
Trend Hourly Chart
Near term up
Hourly Indicators
Turning down
13 HR RSI
56
14 HR DMI
+ve
Daily Analysis
Consolidation b4 one more rise
Resistance
103.77 - Mar's high (07)
103.10 - Last Wed's high
102.69 - Wed's high
Support
102.21 - Y'day's low
101.94 - Tue's high, now sup
101.69 - Wed's European morning high
. USD/JPY - 102.38... Despite dlr's rally to 102.69 on Wed after Fed chief Yellen's hawkish comments, dlr retreated to 102.21 ahead of European open as decline in Asian equities led buying of yen. Price rebounded to 102.55 ahead of NY open but later moved sideways inside a narrow range of 102.31-102.54 in NY.
. As mentioned in our previous update, dlr's rally abv Tue's top of 101.94
to as high as 102.69 confirms fall fm Mar's peak at 103.77 has ended at 101.21 last Fri n further 'choppy' trading inside recent established broad range of 100.76-103.77 wud continue. As dlr's rally on Wed suggests consolidation with upside bias remains, stronger gain twd 103.10 (last Wed's high) is envisaged later today or early next week, however, as hourly oscillators wud in o/bot territory on such move, reckon price wud falter below chart res at 103.43 (last Tue's high) n yield strg retreat later.
. Today, we're holding a long dlr position in anticipation of gain to 103.00, however, profit shud be taken on subsequent rise. On the downside, a daily close below 101.94 (previous top, now sup) wud be the 1st signal rebound fm 101.21 has ended, then risk wud shift to the downside for weakness to 101.49/52.
Last Update At 21 Mar 2014 00:50GMT
Trend Daily Chart
Sideways
Daily Indicators
Turning up
21 HR EMA
102.36
55 HR EMA
102.13
Trend Hourly Chart
Near term up
Hourly Indicators
Turning down
13 HR RSI
56
14 HR DMI
+ve
Daily Analysis
Consolidation b4 one more rise
Resistance
103.77 - Mar's high (07)
103.10 - Last Wed's high
102.69 - Wed's high
Support
102.21 - Y'day's low
101.94 - Tue's high, now sup
101.69 - Wed's European morning high
. USD/JPY - 102.38... Despite dlr's rally to 102.69 on Wed after Fed chief Yellen's hawkish comments, dlr retreated to 102.21 ahead of European open as decline in Asian equities led buying of yen. Price rebounded to 102.55 ahead of NY open but later moved sideways inside a narrow range of 102.31-102.54 in NY.
. As mentioned in our previous update, dlr's rally abv Tue's top of 101.94
to as high as 102.69 confirms fall fm Mar's peak at 103.77 has ended at 101.21 last Fri n further 'choppy' trading inside recent established broad range of 100.76-103.77 wud continue. As dlr's rally on Wed suggests consolidation with upside bias remains, stronger gain twd 103.10 (last Wed's high) is envisaged later today or early next week, however, as hourly oscillators wud in o/bot territory on such move, reckon price wud falter below chart res at 103.43 (last Tue's high) n yield strg retreat later.
. Today, we're holding a long dlr position in anticipation of gain to 103.00, however, profit shud be taken on subsequent rise. On the downside, a daily close below 101.94 (previous top, now sup) wud be the 1st signal rebound fm 101.21 has ended, then risk wud shift to the downside for weakness to 101.49/52.
Last edited by a moderator: