Daily Market Analytics - Forex

FXOpen Trader

Private, 1st Class
Messages
31
Dear Traders,

Here i will be posting the Daily Market Analytics in the Forex pairs listed below:

  1. EURUSD
  2. GBPUSD
  3. AUDUSD
  4. NZDUSD
  5. USDCAD
  6. USDCHF
  7. USDJPY
  8. EURJPY
  9. GBPJPY
  10. EURGBP

I am using the Candlestick patterns and Major Technical indicators for this analysis which will be posted -> pre London markets Open time.

Thanks
 
EURUSD Technical Analysis – 06th FEB, 2024

EURUSD – Resistance of the Channel is Broken

I2dCUUO.png


EURUSD has broken the resistance of the channel in the 1-hourly timeframe. We can see the formation of an Uptrend with the immediate targets of 1.0770 today.
We can see the formation of Bullish price crossover pattern with adaptive moving average 100 in the 30-minutes timeframe.

The Momentum indicator is back over 0 indicating a Bullish trend.
Most of the moving averages are giving a bullish signal at the current market levels of 1.0744.

EURUSD is now trading below its both the 100-hour simple SMA and 200-hour exponential EMA moving averages.
• Euro bullish reversal seen above the 1.0736 mark.
• Short-term range appears to be mildly bullish.
• EURUSD continues to remain above the 1.0730 levels.
• Average true range ATR is indicating less market volatility.

EURUSD is now trading just below its Pivot levels of 1.0751 and is moving into a Mild Bullish Channel. The price of EURUSD is now testing its Classic resistance levels of 1.0749 after which the path towards 1.0770 will get cleared.

Note: This Analytics is created by me and is based on my own personal Forex trading experience of 10 years. I am using my trading experience to help Newbie traders and they should know about the risks of Forex trading.

For in-depth analysis, please check FXOpen Blog
 
GBPUSD Technical Analysis – 08th FEB, 2024

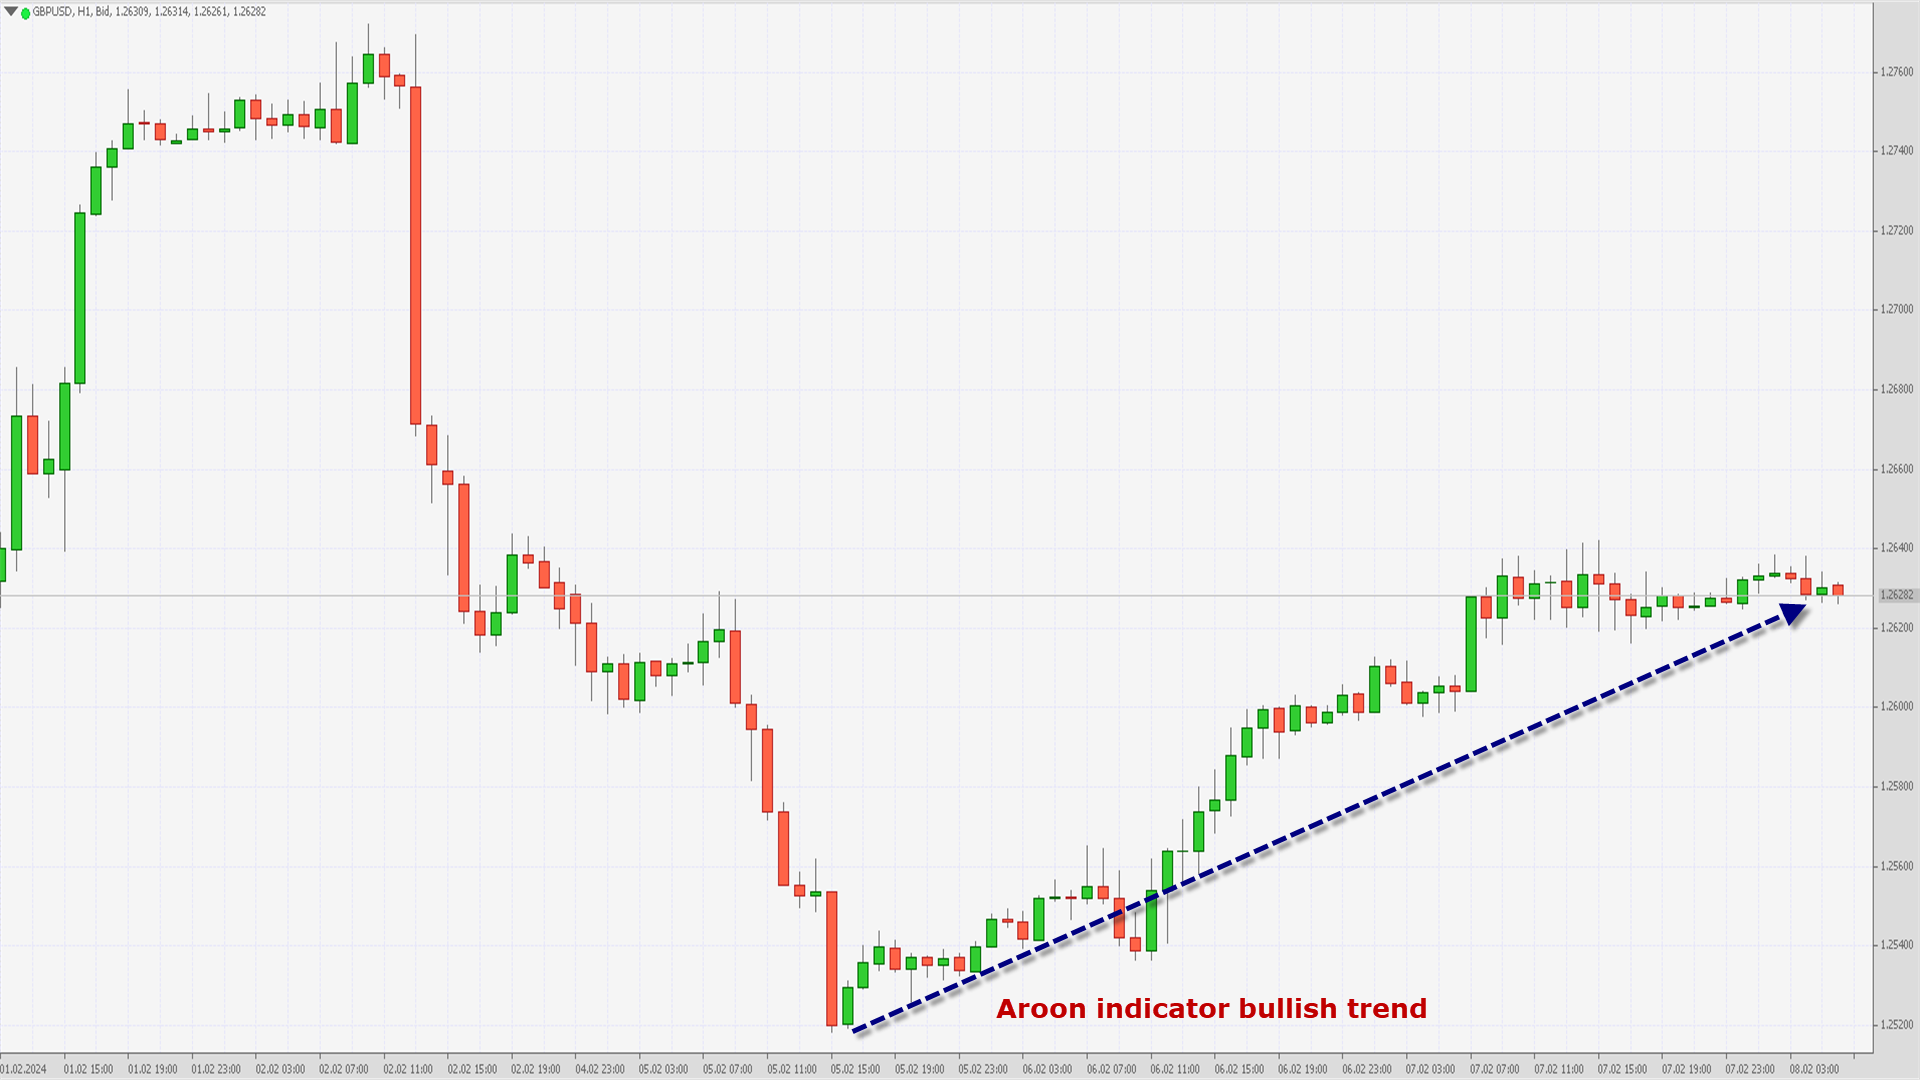
GBPUSD – Aroon indicator bullish trend

DBFHNJ1.png


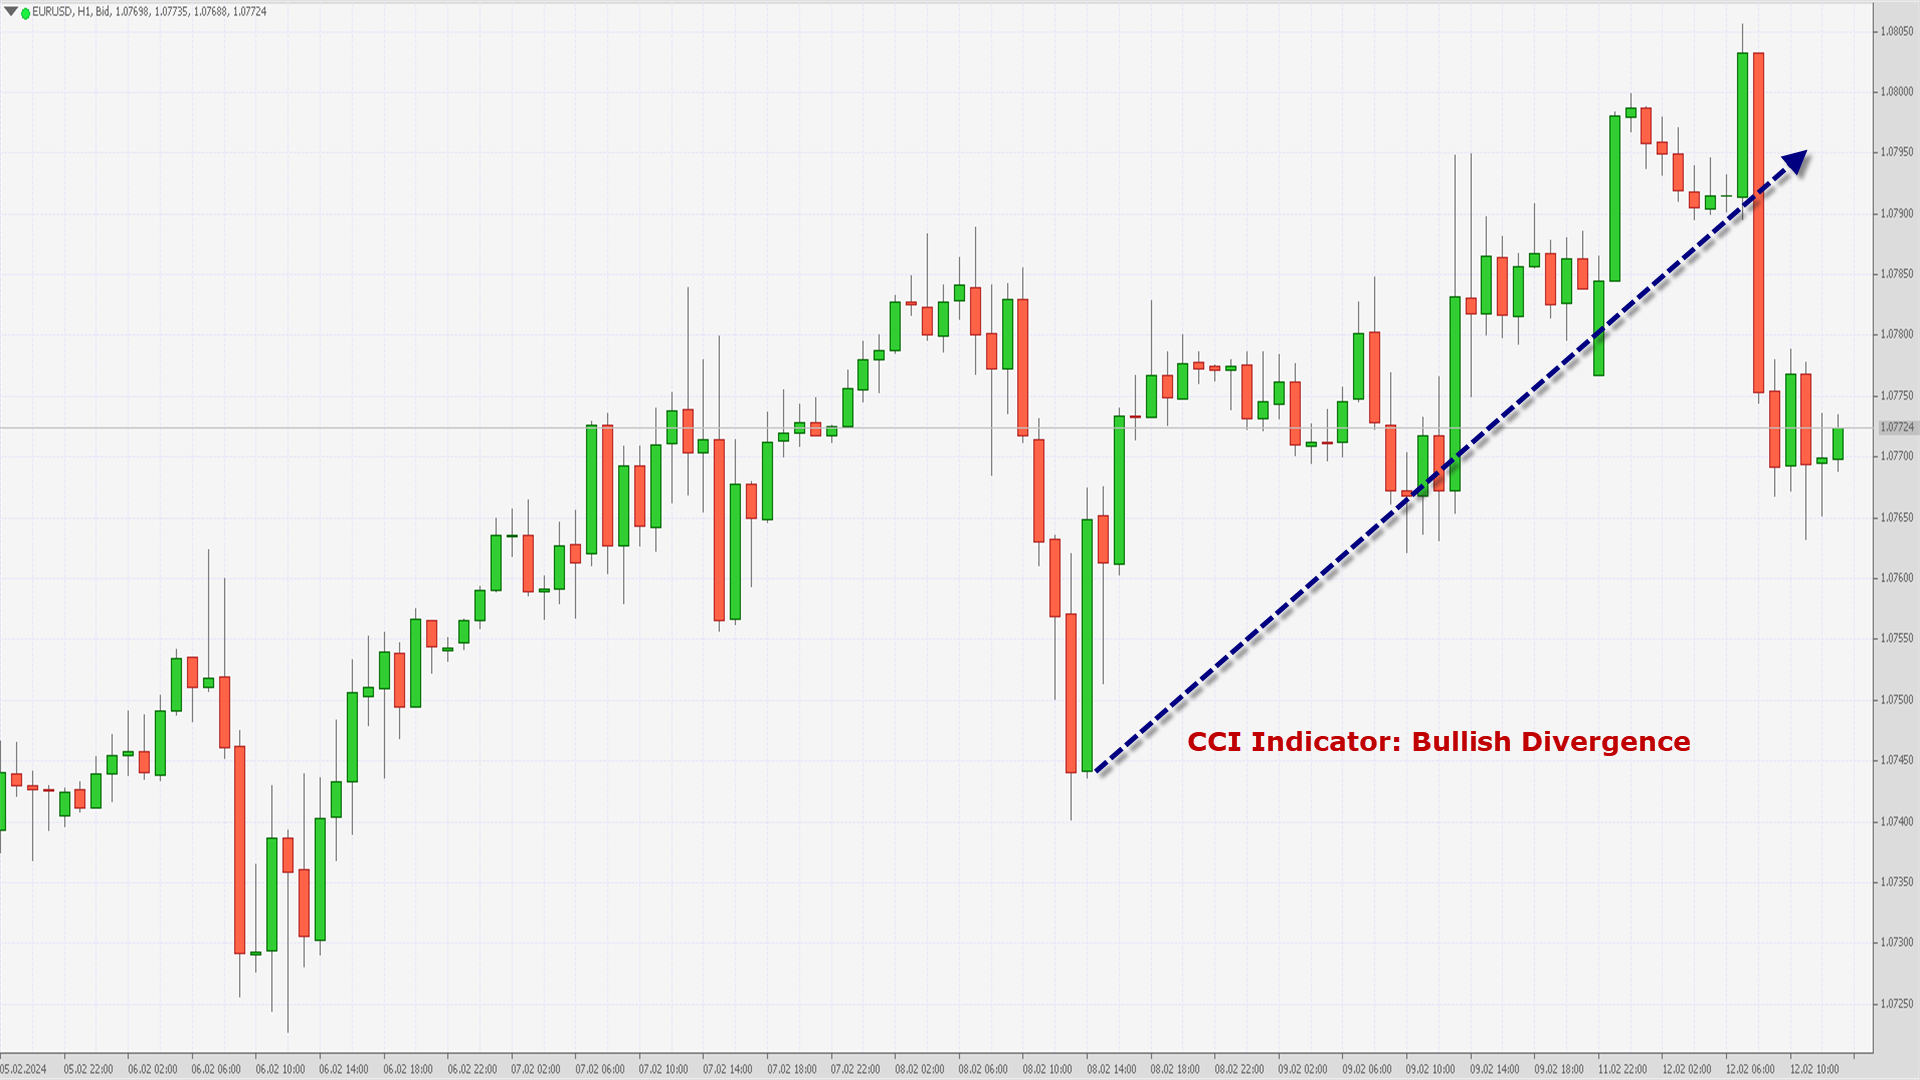
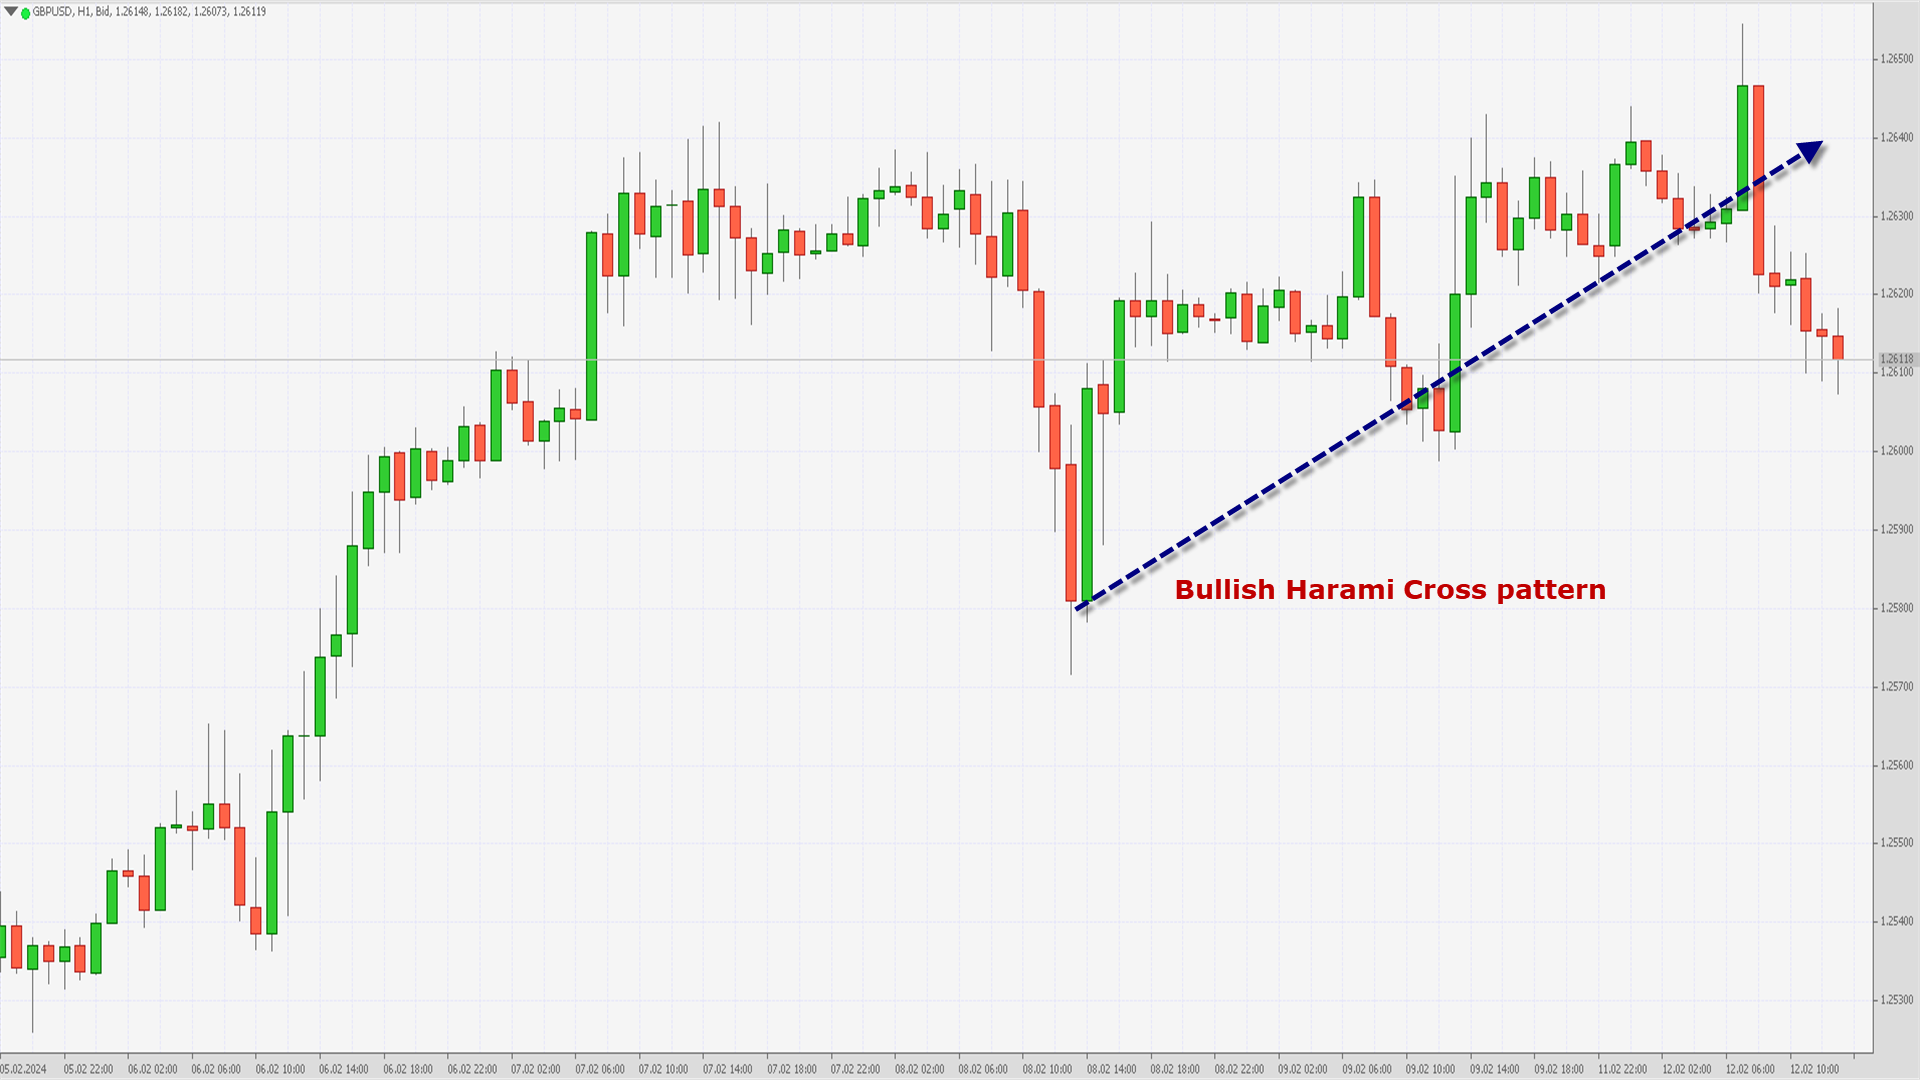
GBPUSD has resumed its Uptrend from its lows of 1.2518 on 05th Feb in the 1-hourly timeframe. The Aroon indicator is giving a bullish trend formation with immediate targets of 1.2660 after which we can see some consolidation coming into the markets.

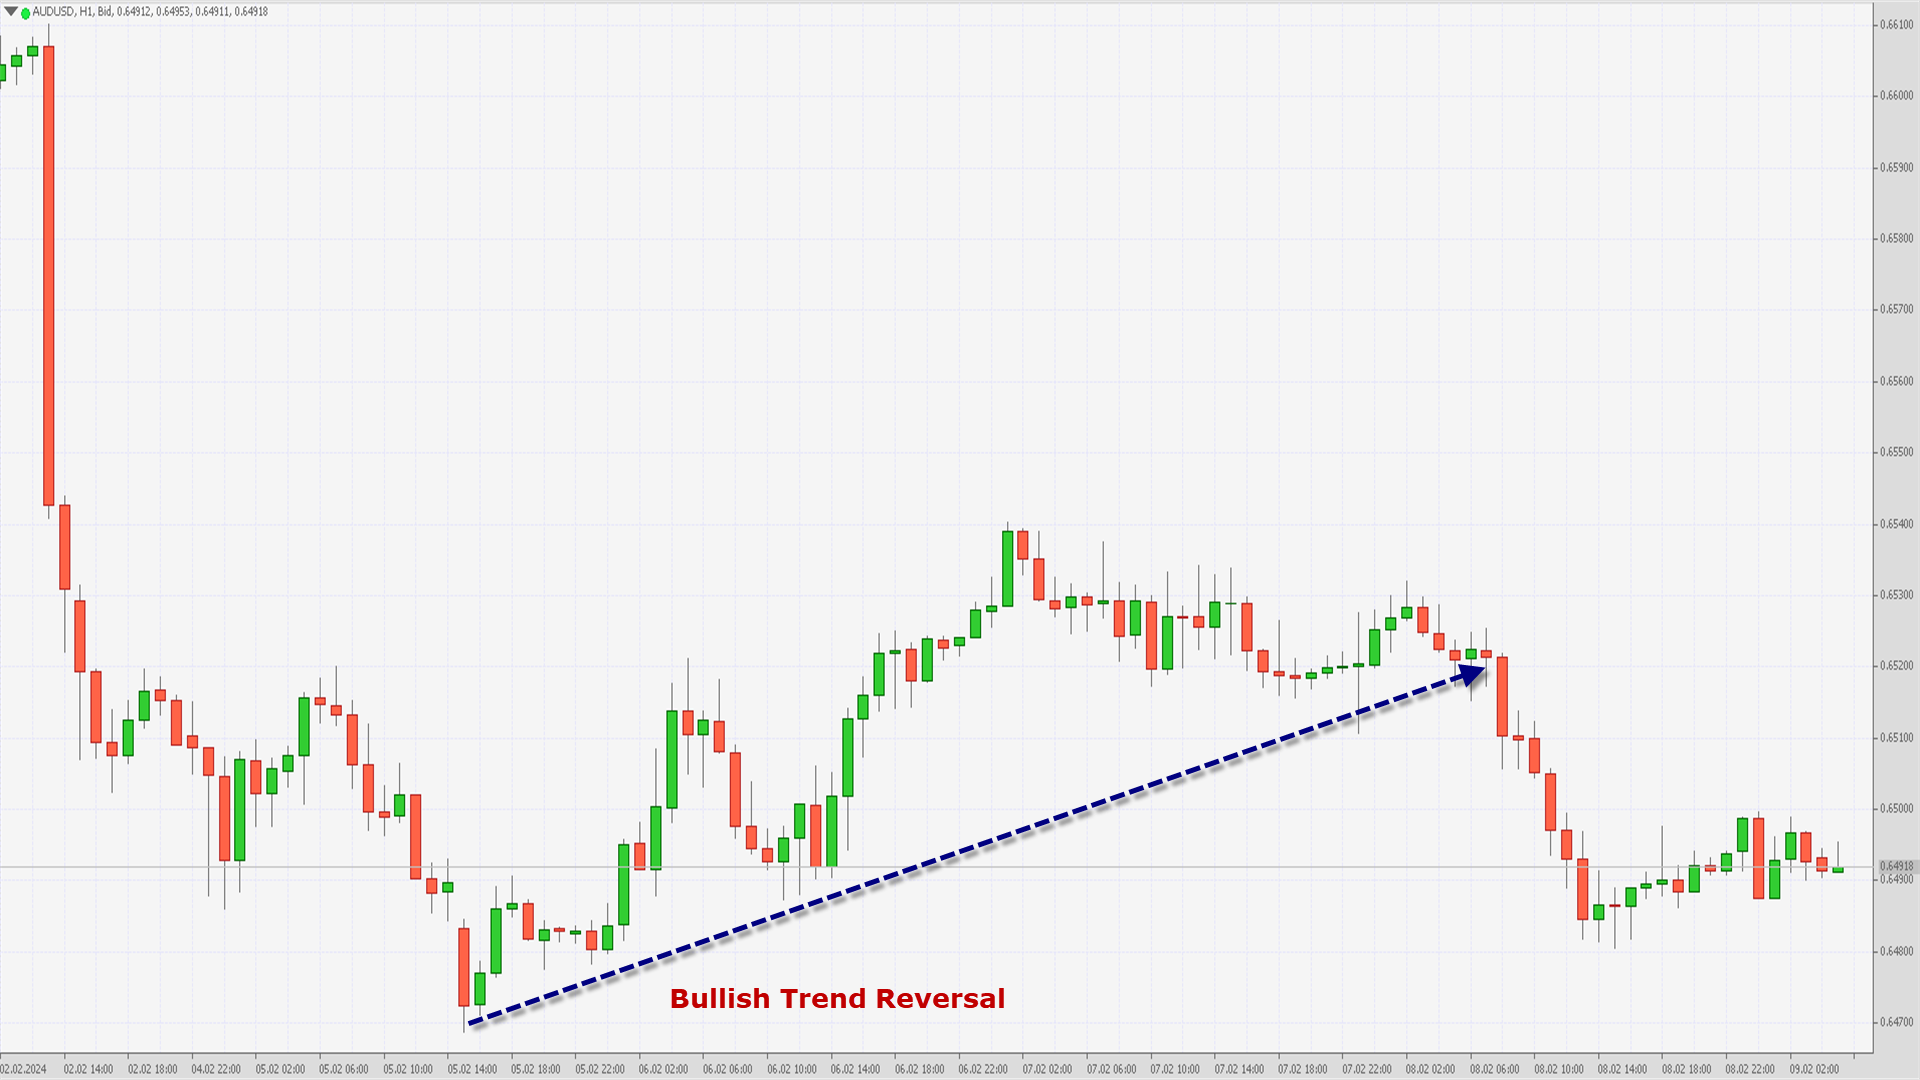
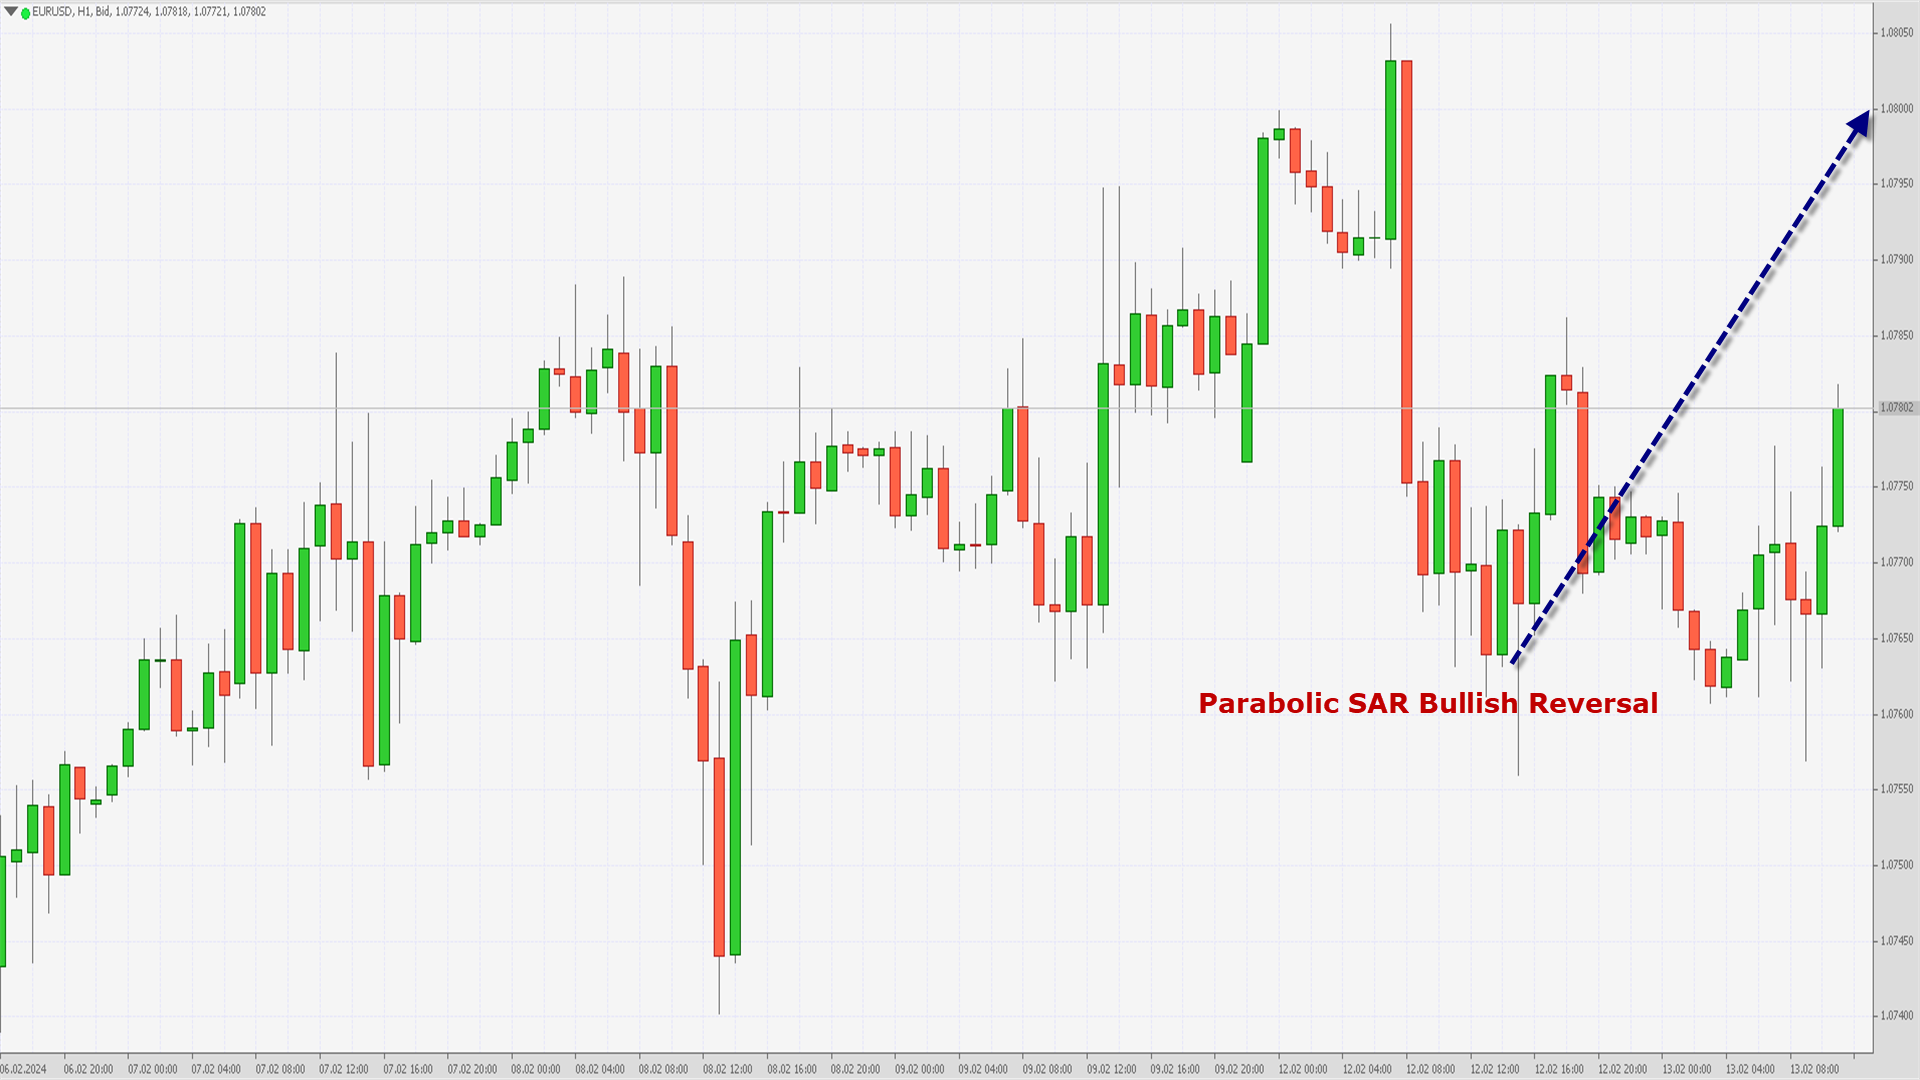
We can see the formation of Bullish trend reversal pattern with the Moving Average 20, MA20 in the 4-hourly timeframe.
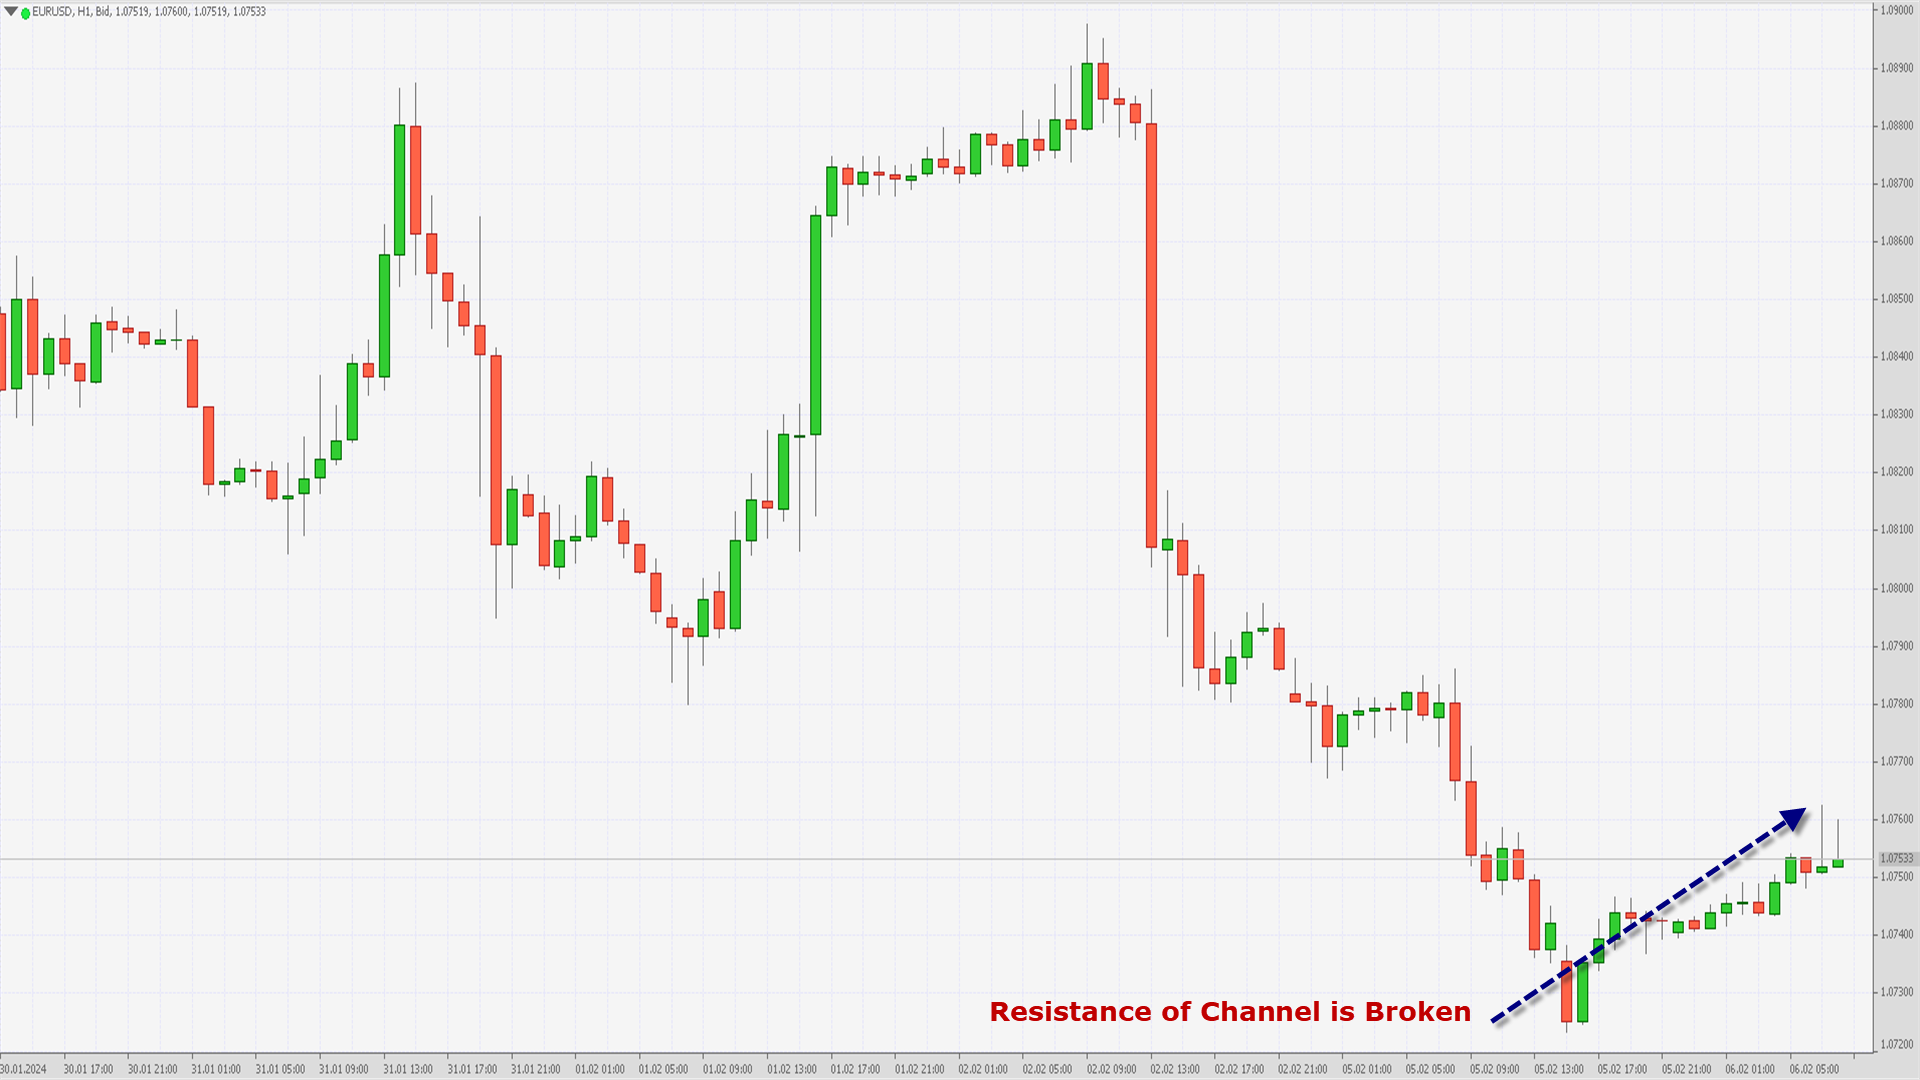
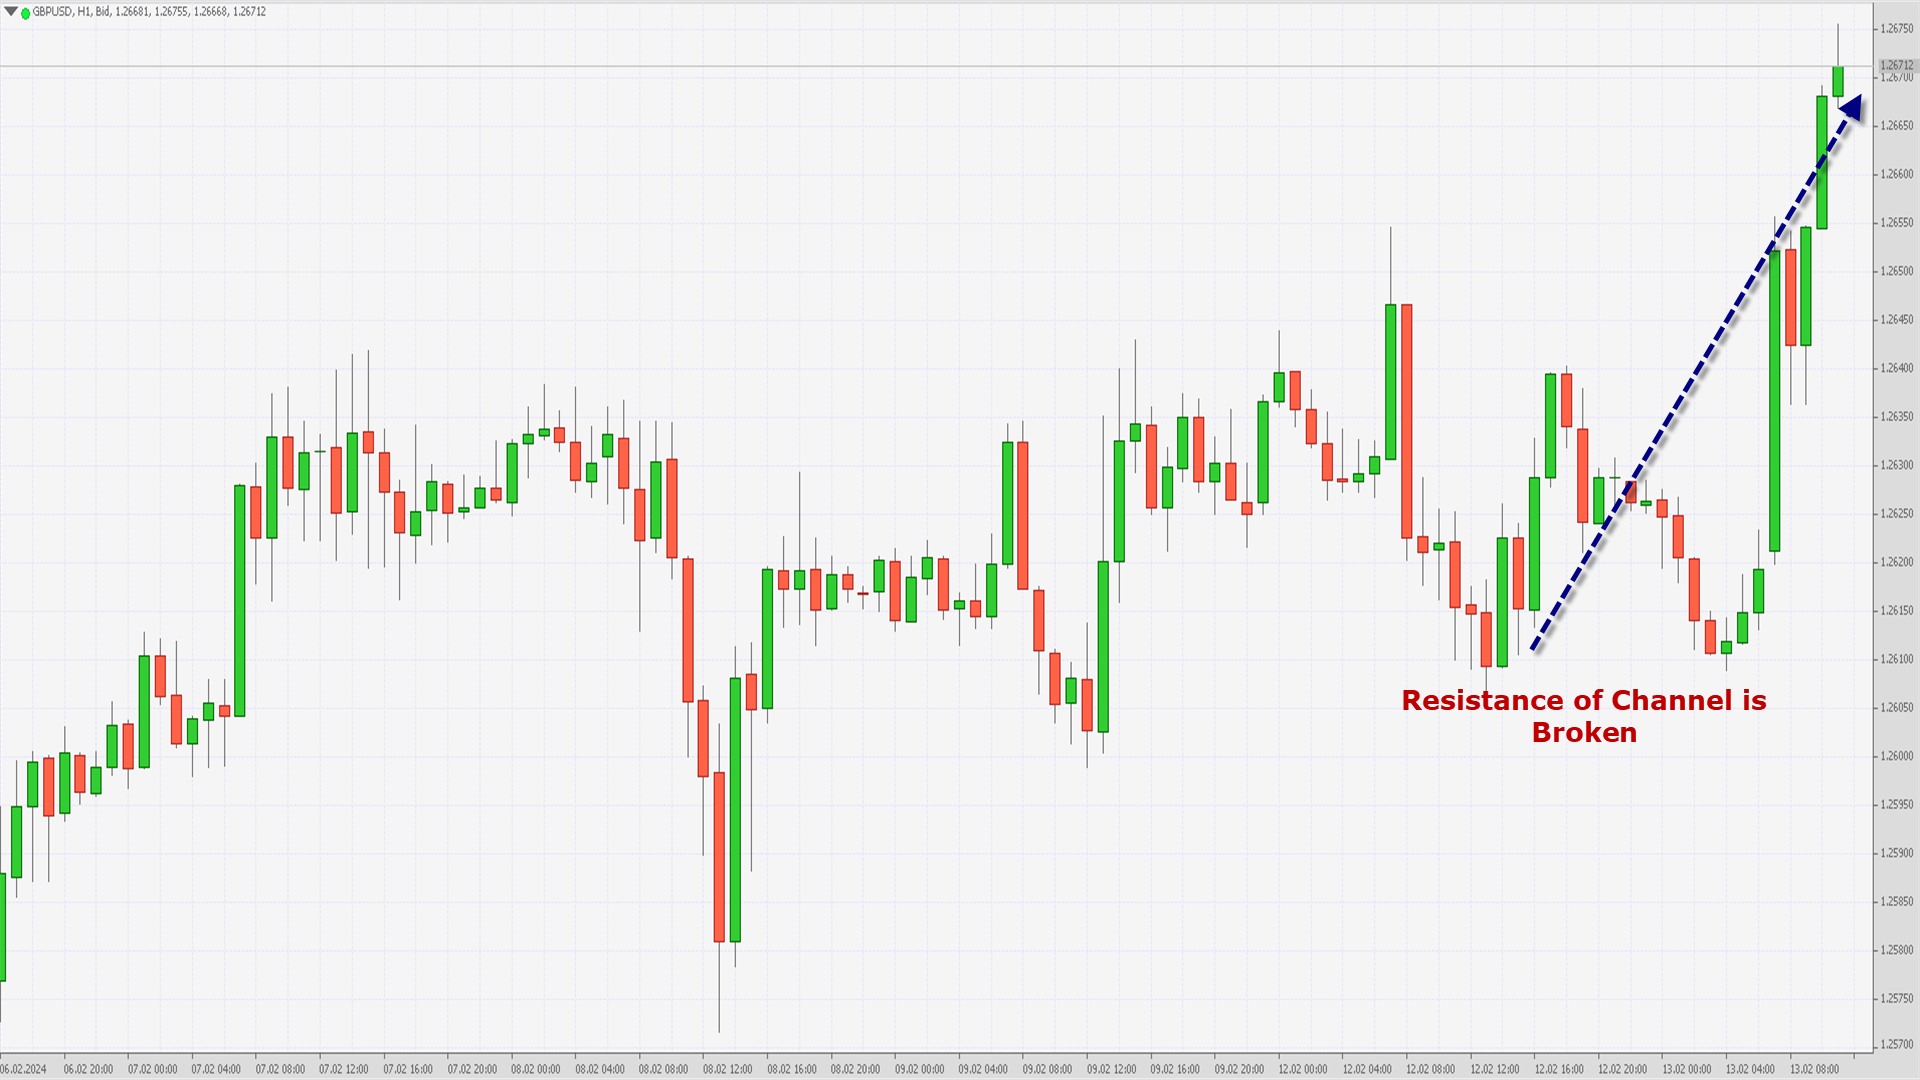
The prices of GBPUSD are ranging near support of channel in the 15-minutes timeframe.

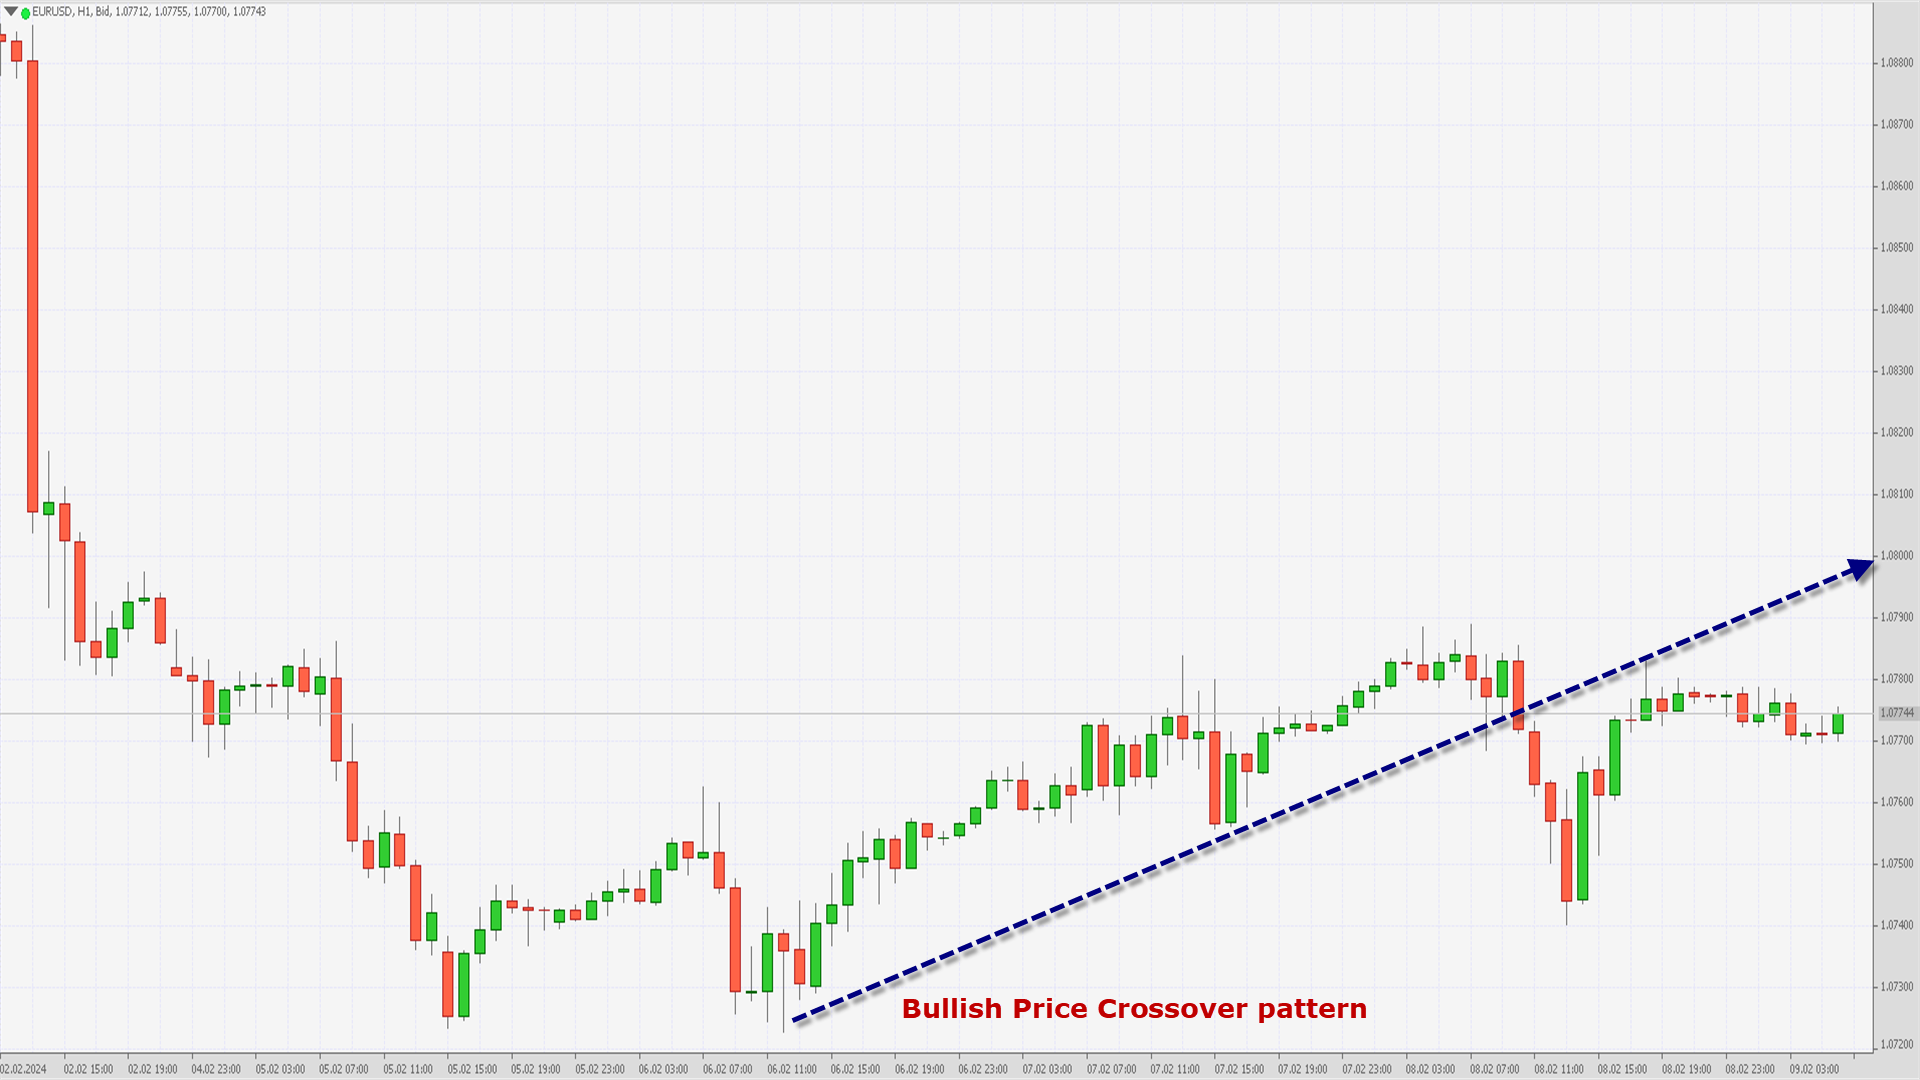
Most of the moving averages are giving a bullish signal at the current market levels of 1.2627.
GBPUSD is now trading above its 100-hour SMA simple moving average and below its 200-hour SMA simple moving average.

• Pound bullish reversal seen above the 1.2518 mark.
• Short-term range appears to be mildly bullish.
• GBPUSD continues to remain above the 1.2620 levels.
• Average true range ATR is indicating less market volatility.

GBPUSD is now trading just below its Pivot levels of 1.2631 and is moving into a Mild Bullish Channel. The price of GBPUSD has already crossed its Classic resistance levels of 1.2628 and is inching closer towards the 1.2660 levels.

Note: This Analytics is created by me and is based on my own personal Forex trading experience of 10 years. I am using my trading experience to help Newbie traders and they should know about the risks of Forex trading.

For in-depth analysis, please check FXOpen Blog
 
AUDUSD Technical Analysis – 09th FEB, 2024

AUDUSD – Bullish Trend Reversal

1gkPbTZ.png


AUDUSD has resumed its Uptrend from its lows of 0.6468 on 05th Feb in the 1-hourly timeframe. The Adaptive Moving Averages AMA20 and AMA50 both are giving a Bullish trend reversal signal.
We can see that the prices are ranging near the support of the triangle in the weekly timeframe indicating the Bullish nature of the markets.

Most of the major technical indicators are giving a Strong Buy with immediate targets of 0.6530.
We have also seen the formation of Doji in both the 15-minutes and 30-minutes timeframe indicating a Neutral stance of the markets and the continuation of the consolidation phase.

AUDUSD is now trading below its both the 100-hour SMA simple moving average and 200-hour SMA simple moving average.
  • AUDUSD bullish reversal seen above the 0.6468 mark.
  • Short-term range appears to be mildly bullish.
  • AUDUSD continues to remain above the 0.6480 levels.
  • Average true range ATR is indicating less market volatility.

AUDUSD is now trading just below its Pivot levels of 0.6496 and is moving into a Mild Bullish Channel. The price of AUDUSD is near to its Classic resistance levels of 0.6496 and is inching closer towards the 0.6530 levels.

Note: This Analytics is created by me and is based on my own personal Forex trading experience of 10 years. I am using my trading experience to help Experienced and Newbie traders and they should know about the risks of Forex trading.

For in-depth analysis, please check FXOpen Blog
 
EURUSD Technical Analysis – 09th FEB, 2024

EURUSD – Bullish Price Crossover Pattern

L6H43t3.png


EURUSD is moving in a mild bullish momentum after crossing the 1.0770 levels as the prices are ranging near the support of the channel in the 15-minutes timeframe.
We can also see that the MACD has crossed UP its moving average and Williams percent range indicator is back over -50 in the 15-minutes timeframe indicating the bullish nature of the markets.

We can see the formation of Bullish price crossover pattern with moving average 50 in the 1-hourly timeframe, with immediate targets of 1.0800.
The prices of EURUSD are ranging near the support of channel in the weekly timeframe.

Most of the moving averages are giving a bullish signal at the current market levels of 1.0776.
EURUSD is now trading above its 100-hour SMA and below its 200-hour SMA simple moving averages.

  • Euro bullish continuation seen above the 1.0729 mark.
  • Short-term range appears to be mildly bullish.
  • EURUSD continues to remain above the 1.0750 levels.
  • Average true range ATR is indicating less market volatility.

The next resistance is located at 1.0785 which is a 14-3 Day Raw Stochastic at 30%.
EURUSD is now trading just above its Pivot levels of 1.0771 and is moving into a Mild Bullish Channel. The price of EURUSD has already crossed its Classic resistance levels of 1.0768 and is moving towards its next target of 1.0800.

Note: This Analytics is created by me and is based on my own personal Forex trading experience of 10 years. I am using my trading experience to help Experienced and Newbie traders and they should know about the risks of Forex trading.

For in-depth analysis, please check FXOpen Blog
 
EURUSD Technical Analysis – 12th FEB, 2024

EURUSD – CCI Indicator: Bullish Divergence

TEnZcfg.png


EURUSD continued its bullish momentum from last week and after crossing the 1.0800 handle we saw some decline towards the 1.0764 levels.
The prices of EURUSD continue to remain above the 1.0760 levels and have entered the consolidation phase.

We can see that the CCI Indicator is giving a Bullish Divergence signal in the 1-hourly timeframe.
Both the Moving Averages MA50 and MA100 are indicating a Bullish trend reversal at the current market levels of 1.0770.

The MACD crosses UP its Moving average in the 15-minutes timeframe and we are now expecting a fresh move towards the 1.0800 level.
The prices of EURUSD are ranging near the support of channel in the weekly timeframe.
EURUSD is now trading below its both 100-hour SMA and 200-hour SMA simple moving averages.

  • Euro bullish continuation seen above the 1.0745 mark.
  • Short-term range appears to be mildly bullish.
  • EURUSD continues to remain above the 1.0760 levels.
  • Average true range ATR is indicating high market volatility.

The next resistance is located at 1.0798 which is a Pivot Point 1st Resistance Point.
EURUSD is now looking to cross 1.0816 which is a 38.2% Retracement From 4 Week Low.

EURUSD is now trading just near its Pivot levels of 1.0769 and is moving into a Mild Bullish Channel. The price of EURUSD has already crossed its Classic resistance levels of 1.0764 and is moving towards its next target of 1.0800.

Note: This Analytics is created by me and is based on my own personal Forex trading experience of 10 years. I am using my trading experience to help Experienced and Newbie traders and they should know about the risks of Forex trading.

For in-depth analysis, please check FXOpen Blog
 
GBPUSD Technical Analysis – 12th FEB, 2024

GBPUSD – Bullish Harami Cross Pattern

PqfiEdu.png


GBPUSD started the week on a Bullish tone touching a high of 1.2653, after which we saw some decline towards the 1.2606 levels.
We can see the formation of Bullish Harami Cross pattern in the 4-hourly timeframe.

The present price action supports the view that we can see some short-term declines but the prices will enter into a consolidation phase soon.
We can see Bullish trend reversal pattern in the 1-hourly timeframe. Since most of the technical indicators are Neutral at this moment, it will take some time before we can see the resumption of the bullish trend.

The prices of GBPUSD are ranging near support of channel in the weekly timeframe.
GBPUSD is now trading below its both the 100-hour SMA and 200-hour SMA simple moving average.

  • Pound bullish reversal pattern seen above the 1.2580 mark.
  • Short-term range appears to be Neutral.
  • GBPUSD continues to remain above the 1.2600 levels.
  • Average true range ATR is indicating high market volatility.

GBPUSD is now trading just below its Pivot levels of 1.2614 and is moving into a Mild Bearish Channel.
The price of GBPUSD is looking to cross its Classic resistance levels of 1.2610 after which we can see a bullish progression towards the 1.2650 handle again.

Note: This Analytics is created by me and is based on my own personal Forex trading experience of 10 years. I am using my trading experience to help Experienced and Newbie traders and they should know about the risks of Forex trading.

For in-depth analysis, please check FXOpen Blog
 
GBPUSD Technical Analysis – 13th FEB, 2024

GBPUSD – Resistance of Channel is Broken

qP8NBEo.png


GBPUSD continues its bullish streak today after touching a bottom of 1.2608 in the early Asian trading session.
We can see that the resistance of the channel is broken in both the 15-minutes and 1-hourly time-frame.

We can see the formation of Moving Average bullish crossovers in both the AMA20 and AMA50.
We can see that the price of GBPUSD has already crossed 14-3 Day Raw Stochastic at 50% which is located at 1.2646.

Most of the Major technical indicators and Moving averages are giving a BUY signal at the current market levels of 1.2675.
The prices are expected to enter into a consolidation phase soon, and we may see some downwards price correction before the resumption of the Uptrend.

GBPUSD is now trading above its both the 100-hour SMA and 200-hour SMA simple moving average.
  • Pound bullish reversal pattern seen above the 1.2608 mark.
  • Short-term range appears to be Mild Bullish.
  • GBPUSD continues to remain above the 1.2650 levels.
  • Average true range ATR is indicating high market volatility.

GBPUSD is now trading above its Pivot levels of 1.2664 and is moving into a Mild Bullish Channel.
The price of GBPUSD has already crossed its Classic resistance levels of 1.2658 and the next target is located at 1.2685 at which the Price Crosses 9 Day Moving Average Stalls.

Note: This Analytics is created by me and is based on my own personal Forex trading experience of 10 years. I am using my trading experience to help Experienced and Newbie traders and they should know about the risks of Forex trading.

For in-depth analysis, please check FXOpen Blog
 
EURUSD Technical Analysis – 13th FEB, 2024

EURUSD – Parabolic SAR Bullish Reversal

jhb8SDP.png


EURUSD had some indecisive moves today where it touched a low of 1.0756, after which we can see the continuation of the Bullish trend.
We can see the formation of the Parabolic SAR Bullish reversal in the both the 30-minutes and 1-hourly timeframe.

Super Trend indicator is also giving a bullish reversal signal and now we are looking to touch 1.0800 levels.
Both the Moving Averages MA50 and MA100 are indicating a Bullish trend reversal at the current market levels of 1.0776.

The MACD indicator is giving a bullish divergence signal in the 4-hourly timeframe.
The prices of EURUSD are ranging near the support of channel in the daily timeframe.

EURUSD is now trading above its 100-hour SMA and below its 200-hour SMA simple moving averages.
  • Euro bullish continuation seen above the 1.0758 mark.
  • Short-term range appears to be Mild Bullish.
  • EURUSD continues to remain above the 1.0760 levels.
  • Average true range ATR is indicating less market volatility.

The next resistance is located at 1.0890 which is a 14-3 Day Raw Stochastic at 80%.
EURUSD is now trading just near its Pivot levels of 1.0772 and is moving into a Mild Bullish Channel. The price of EURUSD has already crossed its Classic resistance levels of 1.0768 and is moving towards its next target of 1.0800.

Note: This Analytics is created by me and is based on my own personal Forex trading experience of 10 years. I am using my trading experience to help Experienced and Newbie traders and they should know about the risks of Forex trading.

For in-depth analysis, please check FXOpen Blog
 
EURUSD Technical Analysis – 14th FEB, 2024

EURUSD – Bullish Price Crossover AMA50

ArxURue.png


EURUSD was unable to sustain its bullish momentum and after touching a high of 1.0793 the prices started to decline rapidly touching a low of 1.0695 today in the European trading session.
We can see Bullish price crossover pattern with the Adaptive Moving Average AMA50 in the 1-hourly timeframe.

The prices of EURUSD are ranging near the support of the channel in the daily timeframe.
We can see a continuous recovery in the levels of Euro after the recent decline and the formation of a bullish channel, with immediate targets of 1.0750.

We can see the formation of the Parabolic SAR Bullish reversal in the 1-hourly timeframe.
The prices of EURUSD are ranging near horizontal support in the weekly timeframe.

EURUSD is now trading below its 100-hour SMA and 200-hour SMA simple moving averages.
  • Euro bullish reversal seen above the 1.0700 mark.
  • Short-term range appears to be Mild Bullish.
  • EURUSD continues to remain above the 1.0720 levels.
  • Average true range ATR is indicating high market volatility.

The next resistance is located at 1.0762 which is a 14-3 Day Raw Stochastic at 80%.

EURUSD is now trading just above its Pivot levels of 1.0721 and is moving into a Mild Bullish Channel. The price of EURUSD has already crossed its Classic resistance levels of 1.0714 and is moving towards its next target of 1.0750.

Note: This Analytics is created by me and is based on my own personal Forex trading experience of 10 years. I am using my trading experience to help Experienced and Newbie traders and they should know about the risks of Forex trading.

For in-depth analysis, please check FXOpen Blog
 
Back
Top