Mhdesai
Recruit
- Messages
- 1
Same thing happened to me and be honest it is not use intuitive. You should have shown changes in chart otherwise there is no point having charts. I don’t car what ask price was in your system.
Cs Transcript:
( 11m 50s ) Lincoln T: Thanks for that Manan.
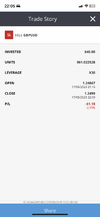
( 12m 13s ) Lincoln T: I assume you are talking about the most recently closed position in your account? Your SELL GBP/USD position?
( 12m 41s ) Visitor: Yaa its correct
( 13m 39s ) Lincoln T: Okay. I can see that your GBP/USD position (position ID 2442881883) was correctly closed due to SL 5/17/2023 9:00:01 PM (GMT)
( 14m 32s ) Lincoln T: I can see that your stop loss was 1.24980000, however this price was never traded in the market. So your position closed at the next available rate, which was 1.24990000
( 14m 51s ) Lincoln T: As it is a SELL position, your trade closes at the ASK price, which is not shown on the eToro charts.
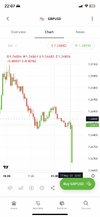
( 15m 48s ) Visitor: Looking at price I can’t see it goes above 1.24868 at 22:00 bst
( 16m 8s ) Lincoln T: Where are you looking at?
( 16m 35s ) Visitor: At etoros candle chart
( 16m 41s ) Lincoln T: Yes
( 16m 54s ) Lincoln T: As I mentioned, the eToro charts only show the BID price
( 17m 6s ) Lincoln T: As your position is a SELL price, it closes at the ASK price, which is not on the eToro charts
( 17m 7s ) Visitor: Hmm it is interesting
( 17m 32s ) Lincoln T: I can send you a copy of the historical prices for GBP/USD if you would llike
( 17m 42s ) Visitor: Is there a way to check historical ask price ?
( 17m 49s ) Visitor: Cool cool
( 18m 8s ) Visitor: Is there a way of seeing it anywhere without contacting
( 18m 32s ) Lincoln T: I can see that the ASK price went from 1.24944000 to 1.24990000. Your Stop Loss was 1.24980000, so your trade closed at the next available rate (1.24990000)
( 19m 25s ) Visitor: Make sense but it’s not shown in chart so I was confused and anyone can be
( 20m 1s ) Lincoln T: WHen you go to the charts, you can see the Sell (S) and Buy (B)
( 20m 17s ) Lincoln T: However, what I can do is forward this a suggestion to be able to see both Sell and Buy charts
Cs Transcript:
( 11m 50s ) Lincoln T: Thanks for that Manan.
( 12m 13s ) Lincoln T: I assume you are talking about the most recently closed position in your account? Your SELL GBP/USD position?
( 12m 41s ) Visitor: Yaa its correct
( 13m 39s ) Lincoln T: Okay. I can see that your GBP/USD position (position ID 2442881883) was correctly closed due to SL 5/17/2023 9:00:01 PM (GMT)
( 14m 32s ) Lincoln T: I can see that your stop loss was 1.24980000, however this price was never traded in the market. So your position closed at the next available rate, which was 1.24990000
( 14m 51s ) Lincoln T: As it is a SELL position, your trade closes at the ASK price, which is not shown on the eToro charts.
( 15m 48s ) Visitor: Looking at price I can’t see it goes above 1.24868 at 22:00 bst
( 16m 8s ) Lincoln T: Where are you looking at?
( 16m 35s ) Visitor: At etoros candle chart
( 16m 41s ) Lincoln T: Yes
( 16m 54s ) Lincoln T: As I mentioned, the eToro charts only show the BID price
( 17m 6s ) Lincoln T: As your position is a SELL price, it closes at the ASK price, which is not on the eToro charts
( 17m 7s ) Visitor: Hmm it is interesting
( 17m 32s ) Lincoln T: I can send you a copy of the historical prices for GBP/USD if you would llike
( 17m 42s ) Visitor: Is there a way to check historical ask price ?
( 17m 49s ) Visitor: Cool cool
( 18m 8s ) Visitor: Is there a way of seeing it anywhere without contacting
( 18m 32s ) Lincoln T: I can see that the ASK price went from 1.24944000 to 1.24990000. Your Stop Loss was 1.24980000, so your trade closed at the next available rate (1.24990000)
( 19m 25s ) Visitor: Make sense but it’s not shown in chart so I was confused and anyone can be
( 20m 1s ) Lincoln T: WHen you go to the charts, you can see the Sell (S) and Buy (B)
( 20m 17s ) Lincoln T: However, what I can do is forward this a suggestion to be able to see both Sell and Buy charts