Euro Forex Pro Weekly, September 06-10, 2010

Hi guys, I see there is no daily post from Sive today. I hope he is fine.

I thought yesterday would be good but ended up without any good opportunity for entry on EUR. Today however is looking up a little more.

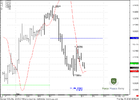
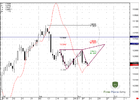
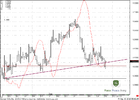
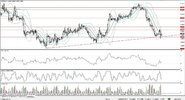
Eur has preached weekly pp S1 but contained its hourly closing to above 1.2670. From what I can see the price is being held up by a trendline on the hourly chart. I have attached for you guys.

Good luck
 

Attachments

  • Eur 4h..jpg
    Eur 4h..jpg
    190.6 KB · Views: 191
Hi guys, I see there is no daily post from Sive today. I hope he is fine.

Hi, Mandrake,

I'm fine, thanks, and my post just before yours one :)

Sorry for delay,

I just have some problems with CQG software, so I had to use MT4 for video today and for daily update. But it looks not so bad as I've expected...
 
Hi, Mandrake,

I'm fine, thanks, and my post just before yours one :)

Sorry for delay,

I just have some problems with CQG software, so I had to use MT4 for video today and for daily update. But it looks not so bad as I've expected...

Hi Sive,

Thanks for taking the extra time to work around the problem to post your daily analysis. I always check back with your analysis to see whether I miss out on anything with my own.

On the hourly chart I see 4 candles rejected after touching or moving below the trendline. I think It's good sign that the reversal is gonna happen here. Am waiting to enter if the opportunity presents itself.
 
Hi guys,

Yesterday price did not managed to go up and now it looks like its gonna test the trendline again. Will it break the line this time ? Better watch for it.
 
EUR/USD Daily Update, Thu 09, September 2010

Good morning,

We've talked about long perspective yesterday, so today, we will talk about short-term perspective.

On 4-hour chart trend has shifted to bullish, but price action does not confirm this shifting and continue to move lower. This price action very often leads to new lows. And I expect that previous lows at 1.2650 area will be taken out by the price.
Also 4-hour chart gives us the nearest target for the down move - it's 1.2602 level from ABC swing.

I think that we can possess ourselves on the Short side of the market from 1.2713-1.2720 area (see hourly chart). Just be sure that hourly trend is bearish and confirms your enter. If it will break to the upside, then it will be mean that we can see deeper retracement to the uside and better wait for another chance.
 

Attachments

  • eur_4h_09_09_10.PNG
    eur_4h_09_09_10.PNG
    42 KB · Views: 168
  • eur_1h_09_09_10.PNG
    eur_1h_09_09_10.PNG
    40.8 KB · Views: 166
EUR/USD Daily Update, Fri 10, September 2010

Hello, everybody,

Yesterday we've talked about possibility of a new lows at 4-hour chart. So, that has happened - market has cleared stops just below 1.2650 but did it in drammatic manner and has cleared the highs before that. This was impossible to predict, but, as you know, market is allways right...

Today I would like to discuss with you a potential MACD failure pattern on daily chart. The red line - is DiNapoli MACD Predictor Indicator. You can see that market has tried to shift trend to the downside today, but failed. till current time
If market will close above the red line today - we will receive a confirmation. And odds suggest that this very often leads to the previous highs (around 1.29)
The second chart shows you a butterfly scenario that we've already discussed during current week. It can come true, if MACD failure signal will work.

On 4-hour chart there are some confirming signs of a possible move to the upside. The breakout of a trend line, 0.786 Fib support and new lows estimation look like a Wash and Rinse, because market has shown fast return back.
If we will see some thrust to the upside, then, possibly, we will have a good context to enter Long on Monday.
 

Attachments

  • eur_D_10_09_10.PNG
    eur_D_10_09_10.PNG
    41.9 KB · Views: 133
  • eur_D1_10_09_10.PNG
    eur_D1_10_09_10.PNG
    42.7 KB · Views: 136
  • eur_4H_10_09_10.PNG
    eur_4H_10_09_10.PNG
    43.6 KB · Views: 133
Hello, everybody,

Yesterday we've talked about possibility of a new lows at 4-hour chart. So, that has happened - market has cleared stops just below 1.2650 but did it in drammatic manner and has cleared the highs before that. This was impossible to predict, but, as you know, market is allways right...

Today I would like to discuss with you a potential MACD failure pattern on daily chart. The red line - is DiNapoli MACD Predictor Indicator. You can see that market has tried to shift trend to the downside today, but failed. till current time
If market will close above the red line today - we will receive a confirmation. And odds suggest that this very often leads to the previous highs (around 1.29)
The second chart shows you a butterfly scenario that we've already discussed during current week. It can come true, if MACD failure signal will work.

On 4-hour chart there are some confirming signs of a possible move to the upside. The breakout of a trend line, 0.786 Fib support and new lows estimation look like a Wash and Rinse, because market has shown fast return back.
If we will see some thrust to the upside, then, possibly, we will have a good context to enter Long on Monday.

HI stiv!
I don't want to repeat that your forecasts are tremendous, exact and good to learn Thanks.
I got one problem: I use 3 shifted by 3 period simple moving average. from standard toolkit of MT4. But it is looking completely different from yours one. Can u help me to pick up proper SMA and where can I find it. THanks in advance...

The red line on the chart is not 3x3 DMA. This is "The red line - is DiNapoli MACD Predictor Indicator." Read carefully, what I've posted.
 
Back
Top