Devon Pendleton
Recruit
- Messages
- 1
Hey all, been wrapping my brain around charts for the last few hours and this is what I came up with for a EURUSD projection (attached). Let me know what you think!
Let me start by saying there's a very good chance I may be incorrect in my assumption here. I understand fully that the FX market is an untameable beast and I'm not claiming to know for a fact where the market is headed.
That being said, Ive been immersing myself in the study of Elliot waves for the past few days (Im very new to the forex market, a newbie just a week or two back but I'm completely confident that with enough practice this market can be profitable for me). I've been taking a special interest in the EURUSD mostly due to Felix's analysis, and carefully studying the pairs movement. That led me to looking for long term trending, and lo and behold there's the Elliot wave I've been reading all about!
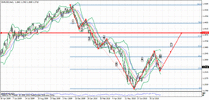
As you can see on the image, Ive traced what I believe was a clear 1,2,3,4,5 pattern to the most recent low, the 5th leg likely longest due to the latecomers to the trend taking short positions. I believe we can expect an A,B,C correction pattern ending somewhere between 1.3900 and 1.4000. If I'm remembering correctly from studying the "Gartley 222", (ABC correction), the A and C legs will be similar in length which indicates a length of about 50-60 days to finish the correction. Also I noted that the B leg was a .382 retracement of A, which I feel is another strong indicator.
I checked my Stoch as well, set to 14,3,3... and it shows highly oversold conditions at the B lowpoint which lead me to believe we have hit the beginning of the C leg retracement.
Let me start by saying there's a very good chance I may be incorrect in my assumption here. I understand fully that the FX market is an untameable beast and I'm not claiming to know for a fact where the market is headed.
That being said, Ive been immersing myself in the study of Elliot waves for the past few days (Im very new to the forex market, a newbie just a week or two back but I'm completely confident that with enough practice this market can be profitable for me). I've been taking a special interest in the EURUSD mostly due to Felix's analysis, and carefully studying the pairs movement. That led me to looking for long term trending, and lo and behold there's the Elliot wave I've been reading all about!
As you can see on the image, Ive traced what I believe was a clear 1,2,3,4,5 pattern to the most recent low, the 5th leg likely longest due to the latecomers to the trend taking short positions. I believe we can expect an A,B,C correction pattern ending somewhere between 1.3900 and 1.4000. If I'm remembering correctly from studying the "Gartley 222", (ABC correction), the A and C legs will be similar in length which indicates a length of about 50-60 days to finish the correction. Also I noted that the B leg was a .382 retracement of A, which I feel is another strong indicator.
I checked my Stoch as well, set to 14,3,3... and it shows highly oversold conditions at the B lowpoint which lead me to believe we have hit the beginning of the C leg retracement.