GlossaryEditor
Glossary Editor
- Messages
- 48
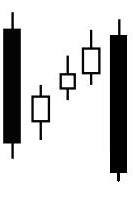
The Fallen Three Method is a bearish continuation candlestick pattern that consists of five candles. The first candle should be a long black candle that supports the current downward trend. The three consecutive candles could be of any color, although a perfect pattern has three ascending white candles with small bodies that could overlap each other. A major condition is that these three candles have to stand inside of the range of first black candle. The fifth candle has to be new long bodied black candle that creates a new low.
- The confirmation of this pattern happens when the fifth candle creates a new low, while the pattern should be treated as failed, if the inside candles come out of the range of first candle.
- This price action is very typical before significant events or market data releases. The middle candles also could be Doji or other different shapes - star, for instance.
Explanation
As a rule after some strong moves the market takes a pause, so that investors digest, and re-assess the current situation and decide what to do next. The first strong black candle tells us that bears control the market, while ascending white candles with small bodies indicate weakness of the bulls, so that they can’t even push prices beyond the borders of the initial candles. From market mechanics this retracement, inside of the range of the first candle is very shallow and definitely will not reach any meaningful resistance level. This means that ascending candles are not profit taking and exiting from the current move down is just a pause in selling pressure, so that all shorts hold their positions, while new shorts wait for some pullback to join in this move. When the new shorts start to step in – another new big black candle appears and the downward move is reestablished.
Although the pure pattern suggests the appearance of 3 white small ascending candles, in reality this pattern could show ascending candles of different colors and, what is more important, a different quantity – from 2 to 5 or even more. Take a look at the charts:
That is a typical Fallen Three on a 15-min EUR/USD chart. Although ascending candles are not so small as they should be and are a different color –all the necessary conditions of this pattern hold: three candles stand inside of first one range and the fifth candle creates a new low:
On this 4-hour EUR/USD here is a chart with a nice pattern with just two inside candles:
Here you can see six inside candles. Although this pattern has some weakness – the first inside candle is not totally engulfed by first one, but otherwise this pattern appears flawless: