Forex Chart Pattern Recognition technique on the Breakout System

Hi all
Im kinda new to trading. finished a course of technical analysis just recently, and started testing what i've learned. after sometime a realized im missing something. the thing i was missing is a strategy, and a consistent way of trading.
I tried googling for that issue but came across so much different and confusing info, which left me clueless and scratching my head.
Any hint on where to start building a strategy which fits my needs best.
im interested in intra-day trading especially.


Thanks in Advance.
Isac Aze.
Admin (AT) iStartup (Dot) co (Dot) il

Hi Isac,
Thanks for your question. I understand your dilemma and I want you to know that you are not alone in that situation. Lots of emerging traders get into the ''paralysis by analysis'' stage when it comes to tailoring a trading plan that meet their needs. It also boils down to the question of ''What Do I Do Now, And Why'? How do I incorporate these technical info and transform them into a holistic and practical plan of milking money off the forex markets. Well, here is suggestion:
Open the charts of the currency pairs that you want to trade for that day and apply the TOP DOWN trading rule. Start from the monthly charts, down to the Weekly charts,Daily,4 hr,1 hr and 15 min charts. Notice the current trend (bullish or bearish) on the charts. Focus more on the hourly and 15min charts and look for the indications of the bias for the coming data, and decide what sort of setups you should be looking for to get in to a trade.
Like the Fibonnacci fans would do, they look for price to cross the 50% retracement line before going short in a downtrend or going long in an uptrend. Elliot wave fans look for the 3rd or 5th wave to occur before pulling their triggers to the observed bias.Nison's Candlestick fans might look for a bullish/bearish engulfing pattern and so on.
Writing out a trading plan for the day, with specific bias, and estimated entries, stops and targets would go a long way in helping you out,Isac. Keep a faithful log of your trading decisions and their outcomes, as you TAKE ACTION on your plan.Plan your trades, trade ur plan''. Check the results at the end of the day and see where you went right or wrong. Take note of your observations, and plan not to repeat them next time.
Ohh, by the way, if you are into intraday trading, please keep an eye on the news(fundamentals). Most times, they tend to override TA due to the huge momentum and volume of trades from market reaction.
Hope that helps.
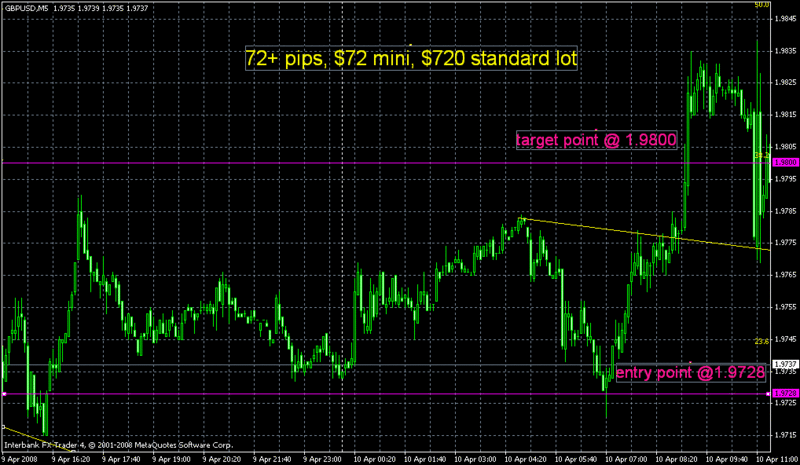
 
Conversations on making 72+ pips on gbpusd, $72 minilots, $720 standard lots

Hi folks,
It Boils down to setting up a trading plan from which you can apply your strategy in a consistentently profitable way. Once I asked a trader friend of mine why he constantly changes his mechanical based system, which by the way, is fully backtestable. He replied that whenever his system makes a loss or string of losses, he usually checks his charts to see where he went wrong, then proceeds to alter his 70% successful system. Remember, you cant expect to get the same outcome when new data is inputed in a system or expect to see the same results as the previous backtest showed in the old system.
What I'm trying to put across is that while the markets are dynamic,there is virtually no 'Holy Grail ' system with no losses. I adviced my friend to stick with a good strategy that has an edge along with proper risk mgt. Even if your system is 90% perfect, can your equity withstand 5 losses in a row without getting margin calls? That is where risk mgt comes in. Minimizing your losses while maximizing your profits.
Since you are familiar with a technical analysis course, why not apply it into your trades and bring out a trading plan from it? Choose the one that you can easily adapt with.But be wary of too many indicators on your screen, they get confusing most times. just keep it simple.
My chart pattern recognition and price projection technique uses almost no indicator and is taken directly from the charts. No bogus indicators or fancy name objects littering the screens. Just price chart based and we would be reviewing it here before, during or after market hours to see how it works out.
We could put a buy stop at GBPUSD at 1.9728, with a 1st target point at 1.9800, on a 35 to 40 pip stop loss.

[11:10:40] cremeche : stall wats up

[11:11:32] Stalion : lol....jus chilling...my platform is frozen rite now...can u tell me where price on d gbpusd is at right now?and wat wat its highest point?

[11:11:34] cremeche : op u r lomg on gu

[11:12:05] cremeche : sorry about dat

[11:12:38] cremeche : 1.9805

[11:13:35] Stalion : was dat the highest point or d just d current price?

[11:14:49] cremeche : highest point

[11:14:51] cremeche : gu

[11:15:04] Stalion : cool

[11:16:18] cremeche : suggest u stop usin NF

[11:16:33] cremeche : entered long @1.9780

[11:16:43] cremeche : alredy 40pips up

[11:16:47] Stalion : hope you all had a good nite rest...on the gbpusd, we could put a buy stop at 1.9728, with a target point of 1.9800, at 35 to 40 pip stop loss

[11:17:15] Stalion : thank God my target point was fulfilled

[11:17:45] Stalion : 72 pips to boot

[11:18:18] Stalion : posted it yesterday

[11:20:22] cremeche : lol 52pips

[11:20:37] Stalion : maybe we might see some high impact news to fuel it up more

[11:21:28] Stalion : got to call my broker...high time i transfer my funds again....

[11:21:33] Stalion : brb

[11:22:05] cremeche : sure uk news at 12pm naija

[11:22:37] cremeche : might reach a 100

gu_72_11.gif
 
[05:08:24] Stalion : helloo all

[05:08:29] Stalion : hope you'all had a nice weekend...

[05:10:01] Stalion : we could put a sell stop on GBPUSD @ 2.0022, target point @ 1.9945, with a 35 pip stop loss.
 
[05:08:24] Stalion : helloo all

[05:08:29] Stalion : hope you'all had a nice weekend...

[05:10:01] Stalion : we could put a sell stop on GBPUSD @ 2.0022, target point @ 1.9945, with a 35 pip stop loss.


Hi Mystikal,

How often do you post signals? And at what time? Would you mind sharing you system?
 
please tell me

to stallion i saw ur trading system and stratagy i really like it but please there is something i want to ask u how do somebody know where to close a trade ' what sign or an indicatior that can tell u where to cloe a trade
thank
 
We could put a buy stop on USDCHF @ 1.0095, with a target point @ 1.0160, along with a 35 pip stop loss
 
Hi Mystikal,

How often do you post signals? And at what time? Would you mind sharing you system?


Hi Cephask,
London time is a more better time for posting signals from the CHART PATTERN RECOGNITION AND PRICE PROJECTION TECHNIQUE, which is an excellent period for the application of technical analysis. Anytime from 9a.m (Nigerian time)
to 11a.m daily IF there are reliable signals from the method. Since this system is more discretionary based than mechanical based, most of it would be shared here without full disclosure on an open forum. Stories we hear about institutional ''big dogs', large dealing desks,etc, going out of their way to fade out signals from popular trading systems are not unfounded, which makes them lose their effectiveness in no time. Its a jungle out there, mon ami. Twould only be a matter of time before the 'crowd' renders it unworkable, like a forex robot on its last laps. Nevertheless, most of it would be shared here before, during, or after market sessions.

to stallion i saw ur trading system and stratagy i really like it but please there is something i want to ask u how do somebody know where to close a trade ' what sign or an indicatior that can tell u where to cloe a trade
thank

Hi meritlife,
Thanx for your mail. You see, closing a trade is something a trader should have already figured out, before entrying any trade, along with the stop loss for proper risk management. Its like captaining on a ship with no particular destination(s), you might run out of fuel. So , it usually depends on your system. Like the CHART PATTERN RECOGNITION AND PRICE PROJECTION STRATEGY, we tend to calculate the direction and distance to which price may move. Once it gets to or close to your target point, you should be looking to close your trade. Some use oscillators(MACD, RSI, etc) to show the overbought/oversold region where traders might be looking to take profits, either in a long or short bias. But I believe its better to get clues for closing a trade, right at the candlesticks,BEFORE pulling the trigger.
Another way might be using a trailing stop, once price gets like 20 to 30 pips along your direction.
Yesterday's call on USDCHF was not hit for some, and I got stopped out on it. Why?
What happened..? Housing reports( Existing home sales and House price index) on the US economy was lower than the previous data, which was negative on the US dollar bring out sell orders that lowered price down on USD related pairs. See why its cool to keep an eye on the news?
Just follow up, mon ami, and you might see how to practically close trades.
 
Last edited:
91pips,$91 minilots,$910 standard lots on gbpusd friday morning

What happened today on the gbpusd currency pair?
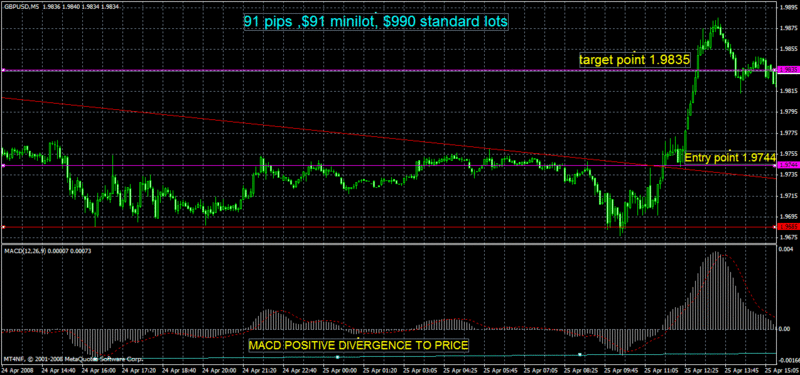
Well, we had a triangle chart pattern on a downtrend, a bullish hammer and MACD positive divergence to price, which gave us a signal to go long.

1.9786-1.9695=0.0091
1.9744+0.0091=1.9835

91pips10.gif


so,meritlife, as you can see, our target point was at 1.9835,which gave us 91 pips or thereabouts. As price is coming close to your target point, you should be tightening your stops and getting ready to close your trades. Some seasoned traders would put out a trailing stop to catch the maximum pips allowed, while others might place a sell stop below the 1.9835 in order to take advantage of price reversing back downwards.My students made up to $91 on a mini account,$990 on a standard account.
 
Back
Top