Real-Forex.com
Banned
- Messages
- 1
EUR-USD
Weekly chart
Last week review
The price is moving now in the area of the last low while it is possible that it will perform a Fibonacci correction in size of between a third and two thirds of the last downtrend which started at the 1.3283 price level (more about it in the daily chart). On the other hand, breaking of the last low on the 1.2290 price level will increase the possibility for a continuation of the downtrend while the target of the price is the “Head and Shoulders” (black broken lines), around the 1.1900 price level.
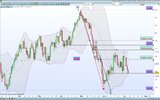
Current review for today
It is possible to see that the price has stopped at the 1.2580 resistance level and after several attempts of breaching/checking this level as a legitimate resistance, it fell down with one candle towards the last low at the 1.2290 price level. Proven breaking of this level will probably lead the price towards the “Head and Shoulders” pattern target on the 1.2877 price level, which is also the last low.
You can see the chart below:

Daily chart
The price could not breach the last peak on the 1.2750 price level and actually created a lower peak on the 1.2670 level, from this area it fell and created a descending price structure after breaking the 1.2436 price level. Breaking of the 1.2290 price level will continue the downtrend towards the 1.1877 price level (same target as on the weekly chart review). Stoppage of the price at the current area will indicate that the price will perform a Fibonacci correction in size of between a third and two thirds of the last downtrend which started on the 1.2670 price level.
You can see the chart below:

GBP-USD
Weekly chart
It is possible to see that the last uptrend stopped at the 1.5778 price level, under the Bollinger’s moving average while correcting the last downtrend. At this point, breaking of the price at the strong support on the 1.5270 price level in a proven way will raise the chance for a continuation of the downtrend, while in first stage the price is suppose to descend towards the 1.4760 price level, which is the “One in, one out” pattern target (blue broken arrows) and a support level as well. Breaking of this level will indicate the continuation of the downtrend towards the 1.4380 price level, the target of the range.
You can see the chart below:

Daily chart
The price could not breach the last peak at the 1.5784 price level and practically it is possible to say that breaking of the 1.5485 price level will sign the end of the AD correction move, while breaking of the 1.5268 price level which is the last low and support, will continue the downtrend towards the levels which were given on the weekly chart review.
You can see the chart below:
Forex daily review brought to you by Real Forex | True ECN broker
Weekly chart
Last week review
The price is moving now in the area of the last low while it is possible that it will perform a Fibonacci correction in size of between a third and two thirds of the last downtrend which started at the 1.3283 price level (more about it in the daily chart). On the other hand, breaking of the last low on the 1.2290 price level will increase the possibility for a continuation of the downtrend while the target of the price is the “Head and Shoulders” (black broken lines), around the 1.1900 price level.
Current review for today
It is possible to see that the price has stopped at the 1.2580 resistance level and after several attempts of breaching/checking this level as a legitimate resistance, it fell down with one candle towards the last low at the 1.2290 price level. Proven breaking of this level will probably lead the price towards the “Head and Shoulders” pattern target on the 1.2877 price level, which is also the last low.
You can see the chart below:
Daily chart
The price could not breach the last peak on the 1.2750 price level and actually created a lower peak on the 1.2670 level, from this area it fell and created a descending price structure after breaking the 1.2436 price level. Breaking of the 1.2290 price level will continue the downtrend towards the 1.1877 price level (same target as on the weekly chart review). Stoppage of the price at the current area will indicate that the price will perform a Fibonacci correction in size of between a third and two thirds of the last downtrend which started on the 1.2670 price level.
You can see the chart below:
GBP-USD
Weekly chart
It is possible to see that the last uptrend stopped at the 1.5778 price level, under the Bollinger’s moving average while correcting the last downtrend. At this point, breaking of the price at the strong support on the 1.5270 price level in a proven way will raise the chance for a continuation of the downtrend, while in first stage the price is suppose to descend towards the 1.4760 price level, which is the “One in, one out” pattern target (blue broken arrows) and a support level as well. Breaking of this level will indicate the continuation of the downtrend towards the 1.4380 price level, the target of the range.
You can see the chart below:
Daily chart
The price could not breach the last peak at the 1.5784 price level and practically it is possible to say that breaking of the 1.5485 price level will sign the end of the AD correction move, while breaking of the 1.5268 price level which is the last low and support, will continue the downtrend towards the levels which were given on the weekly chart review.
You can see the chart below:
Forex daily review brought to you by Real Forex | True ECN broker