Centreforex
CentreForex.com Representative
- Messages
- 52
Xau/Usd : 16/11/2015 Technical Analysis Report From Centreforex
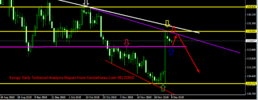
Our Preference: Sell below 1095 for the target 1185 and 1180 levels.
Alternative Scenario: Nill
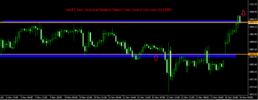
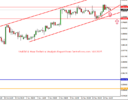
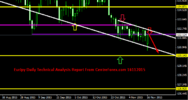
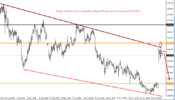
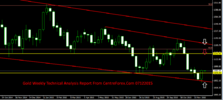
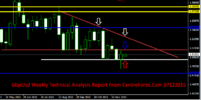
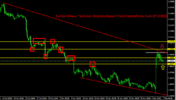
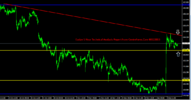
Technical Commentary:- In Weekly Chart :- Gold was trading below the equidistant channel lines and its trading below last week high If we got closing above the last week high means we can gohead on buying side otherwise we can hold on selling side with tight stoploss :- which we have shown in attached image.
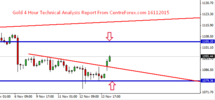
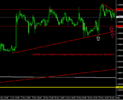
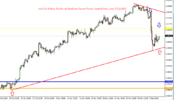
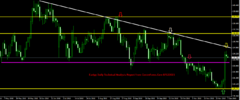
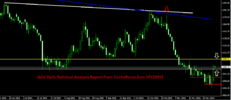
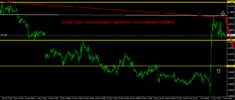
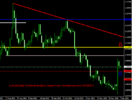
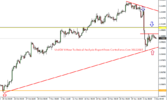
In Daily Chart :- last Friday Gold was reached the previous low of major key support 1080 levels and today morning we got gap opening on upper side and its trading near last 5 days high and its trading below the key resistance level of horizontal line so we except on selling side :- which we have shown in attached image.
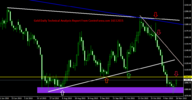
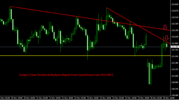
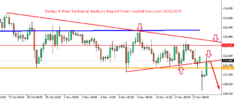
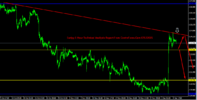
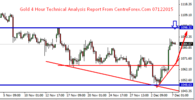
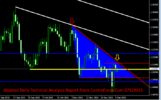
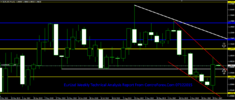
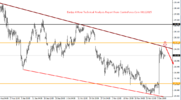
In 4 hour chart :-:- Gold was broken the upper trend line and gold was trading in the range bound pattern between key resistance level and key support levels :- which we have shown in attached image.
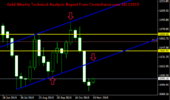
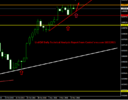
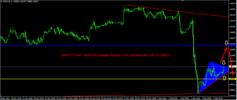
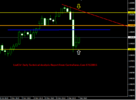
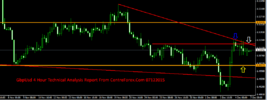
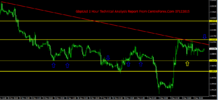
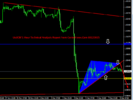
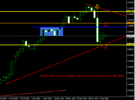
In 1 hour chart :- Gold was trading in the sideways movement between key resistance level and key support level and its trading with new upper trend line so we can sell near resistance level and except on selling side :- which we have shown in attached image.
Our Preference: Sell below 1095 for the target 1185 and 1180 levels.
Alternative Scenario: Nill
Technical Commentary:- In Weekly Chart :- Gold was trading below the equidistant channel lines and its trading below last week high If we got closing above the last week high means we can gohead on buying side otherwise we can hold on selling side with tight stoploss :- which we have shown in attached image.
In Daily Chart :- last Friday Gold was reached the previous low of major key support 1080 levels and today morning we got gap opening on upper side and its trading near last 5 days high and its trading below the key resistance level of horizontal line so we except on selling side :- which we have shown in attached image.
In 4 hour chart :-:- Gold was broken the upper trend line and gold was trading in the range bound pattern between key resistance level and key support levels :- which we have shown in attached image.
In 1 hour chart :- Gold was trading in the sideways movement between key resistance level and key support level and its trading with new upper trend line so we can sell near resistance level and except on selling side :- which we have shown in attached image.