Forex Free Signals Daily From Centreforex

Xau/Usd : 11/12/2015 Technical Analysis Report From Centreforex

Our Preference: Sell Below 1070 for the target 1058 levels.

Alternative Scenario: Nill

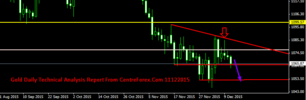
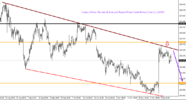
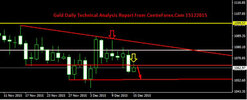
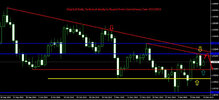
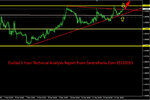
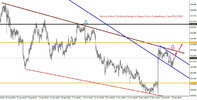
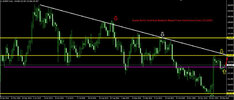
Technical Commentary:- In Daily Chart :- Gold was trading with upper trend line and Yesterday Gold was closed on lower side as bearish candle and this week its was tested the key resistance level 1180 levels, but its fail to break key resistance level so its was giving conformation for selling side, today we can except upto next support levels :- which we have shown in attached image.

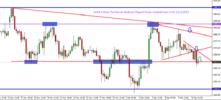
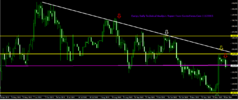
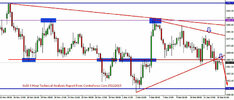
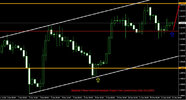
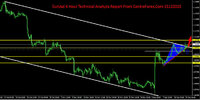
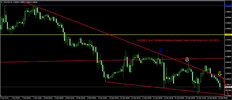
In 4 hour chart :- Gold was broken the intraday triangle pattern on lower side and its trading in the sideways movement between key resistance level and key support levels and now its was trading near key support level, if key support level of horizontal line breaks means we can except on selling side upto next key support levels:- which we have shown in attached image.

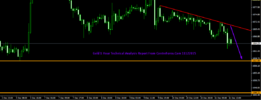
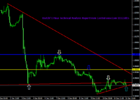
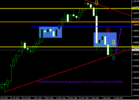
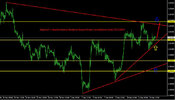
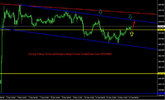
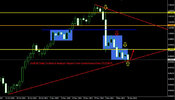
In 1 Hour Chart :- Gold was trading with upper trend line, gold could’nt able to break upper trend line so its started to move towards key support level of horizontal line so we can except on selling side upto next key support levels :- which we have shown in attached image.
 

Attachments

  • Gold 1 Hour Technical Analysis Report From CentreForex.Com 11122015.png
    Gold 1 Hour Technical Analysis Report From CentreForex.Com 11122015.png
    32.8 KB · Views: 0
  • Gold 4 Hour Technical Analysis Report From CentreForex.Com 11122015.png
    Gold 4 Hour Technical Analysis Report From CentreForex.Com 11122015.png
    36.5 KB · Views: 1
  • Gold Daily Technical Analysis Report From CentreForex.Com 11122015.png
    Gold Daily Technical Analysis Report From CentreForex.Com 11122015.png
    15.5 KB · Views: 0
Eur/Jpy : 11/12/2015 Technical Analysis Report From CentreForex

Our Preference: Sell Below 133.60 for the target of 132.50 levels.

Alternative Scenario: Nill

Technical Commentary :- In Daily Chart :- EurJpy was trading with upper trend line and yesterday it was closed as bearish candle and closed below the key support level of horizontal line so today we can except on sellind side :- We have shown in above image.

In 4 Hour Chart :- EurJpy was trading in the equidistant channel lines and trading near upper trend line so we can sell near upper channel line and except upto next key support levels :- We have shown in above image.

In 1 Hour chart :- EurJpy was trading below the upper trend line and now its trading below key support level so we can sell near intraday resistance level and except upto key support level :- We have shown in above image.
 

Attachments

  • EurJpy 1 Hour Technical Analysis Report From CentreForex.Com 11122015.png
    EurJpy 1 Hour Technical Analysis Report From CentreForex.Com 11122015.png
    31 KB · Views: 0
  • EurJpy 4 Hour Technical Analysis Report From CentreForex.Com 11122015.png
    EurJpy 4 Hour Technical Analysis Report From CentreForex.Com 11122015.png
    42.6 KB · Views: 0
  • EurJpy Daily Technical Analysis Report From CentreForex.Com 11122015.png
    EurJpy Daily Technical Analysis Report From CentreForex.Com 11122015.png
    53 KB · Views: 0
Usd/Chf : 11/12/2015 Technical Analysis Report From Centreforex

Our Preference: Buy Above 0.9850 level for the target of 0.9920 levels.

Alternative Scenario: Nill

Technical Commentary : In Daily Chart :- Yesterday UsdChf was trading below key resistance level but strong key support of lower trend line was formed, If key resistance of horizontal line breaks means we can except on buying side so today we can expect on buying side from support level lower trend line and except upto next key resistance level :- which we have shown in attached image.

In 4 Hour Chart and 1 Hour Chart:- Usd/Chf was trading near lower trend line and trading below the key resistance level if key resistance level breaks means we can except on buying side so today we except on buying side from lower trend line upto next resistance level :- which we have shown in attached image.
 

Attachments

  • UsdChf 1 Hour Technical Analysis Report From CentreForex.Com 11122015.png
    UsdChf 1 Hour Technical Analysis Report From CentreForex.Com 11122015.png
    29 KB · Views: 0
  • UsdChf 4 Hour Technical Analysis Report From CentreForex.Com 11122015.png
    UsdChf 4 Hour Technical Analysis Report From CentreForex.Com 11122015.png
    23.9 KB · Views: 0
  • UsdChf Daily Technical Analysis Report From CentreForex.Com 11122015.png
    UsdChf Daily Technical Analysis Report From CentreForex.Com 11122015.png
    30.4 KB · Views: 0
Xau/Usd : 15/12/2015 Technical Analysis Report From Centreforex

Our Preference: Sell Below 1066 for the target 1053 levels.

Alternative Scenario: Nill

Technical Commentary:- In Daily Chart :- yesterday Gold was closed on lower side as bearish candle and closed below the key support level, its given conformation for selling side so we can except on selling side upto next key support levels :- which we have shown in attached image.

In 4 Hour Chart and In 1 Hour Chart :- Yesterday Gold was broken the lower trend line and its closed below the key support level of horizontal line and its trading in the sideways movement between key resistance level and key support levels and now its was trading near previous broken lower trend line so we sell near resistance level and except upto next key support levels:- which we have shown in attached image.
 

Attachments

  • Gold-Daily-Technical-Analys.jpg
    Gold-Daily-Technical-Analys.jpg
    27.9 KB · Views: 0
  • Gold-4-Hour-Technical-Analy.jpg
    Gold-4-Hour-Technical-Analy.jpg
    67.4 KB · Views: 1
  • Gold-1-Hour-Technical-Analy.jpg
    Gold-1-Hour-Technical-Analy.jpg
    60 KB · Views: 0
Gbp/Usd : 15/12/2015 Technical Analysis Report From Centreforex

Our Preference: Buy Above 1.5120 for the target 1.5220 levels.

Alternative Scenario: Nill

Technical Commentary :- In Daily Chart :- GbpUsd was trading with long term and short term upper trend line and yesterday its tested the key support level of horizontal line so we can buy above the ksy support level and except upto upper trend line and next resistance level :- which we have shown in attached image.

In 4 Hour Chart :- GbpUsd was trading in the equidistance channel lines and its was trading in the sideways movement between key resistance level and key support level so today we can buy support level of horizontal line and except upto next key resistance level :- which we have shown in attached image.

In 1 Hour Chart :- GbpUsd was trading in the triangle pattern now its trading near lower trend line and key support level of horizontal line so we can buy above the support level of horizontal line and except upto next key resistance level :- which we have shown in attached image.
 

Attachments

  • GbpUsd-Daily-Technical-Anal.jpg
    GbpUsd-Daily-Technical-Anal.jpg
    53.1 KB · Views: 0
  • GbpUsd-4-HourTechnical-Anal.jpg
    GbpUsd-4-HourTechnical-Anal.jpg
    53.1 KB · Views: 1
  • GbpUsd-1-HourTechnical-Anal.jpg
    GbpUsd-1-HourTechnical-Anal.jpg
    58.7 KB · Views: 0
Eur/Usd : 15/12/2015 Technical Analysis Report From Centreforex

Our Preference: Buy Above 1.1000 for the target of 1.1100 levels

Alternative Scenario: Nill

Technical Commentary: In Daily chart :- EurUsd was trading below the short term upper trend line and its trading below the key resistance 1.1100 level, If today upper trend line breaks means we except upto next resistance level so we can above upper trend line and except upto next resistance levels :- which we have shown in attached image.

In 4 Hour Chart :- EurUsd was trading near the upper equidistant channel line and trading above the key resistance level of horizontal line and now its trading in the triangle pattern and its trading near lower trend line, so its conforming for the buying zone so we can buy near key support level and except upto next resistance levels :- which we have shown in attached image.

In 1 Hour Chart :- EurUsd was trading in the trading pattern and its trading near upper trend line so if the upper trend line breaks means we except upto next resistance level so we can above upper trend line and except upto next resistance levels:- which we have shown in attached image.
 

Attachments

  • EurUsd-Daily-Technical-Anal.jpg
    EurUsd-Daily-Technical-Anal.jpg
    53.9 KB · Views: 0
  • EurUsd-4-Hour-Technical-Ana.jpg
    EurUsd-4-Hour-Technical-Ana.jpg
    57.2 KB · Views: 0
  • EurUsd-1-Hour-Technical-Ana.jpg
    EurUsd-1-Hour-Technical-Ana.jpg
    50.3 KB · Views: 0
Eur/Jpy : 15/12/2015 Technical Analysis Report From CentreForex

Our Preference: Buy Above 133.00 for the target of 134.00 levels.

Alternative Scenario: Nill

Technical Commentary :- In Daily Chart :- Yesterday EurJpy was closed on higher side and closed above the resistance level of horizontal line and its trading with upper trend line so today we can except on buying side from key support 133.00 level :- We have shown in above image.

In 4 Hour Chart :- EurJpy was trading in the short term and long term equidistant channel lines and yesterday its tested the lower line of equidistant channel line so we can buy near support level and except upto next key resistance levels :- We have shown in above image.

In 1 Hour chart :- EurJpy was trading in the equidistant channel lines and yesterday its tested the lower line of equidistant channel line and we got closing above the key resistance level of horizontal line so we can buy near support level and except upto next key resistance levels :- We have shown in above image.
 

Attachments

  • EurJpy-1-Hour-Technical-Ana.jpg
    EurJpy-1-Hour-Technical-Ana.jpg
    44.3 KB · Views: 0
  • EurJpy-4-Hour-Technical-Ana.jpg
    EurJpy-4-Hour-Technical-Ana.jpg
    54.7 KB · Views: 0
  • EurJpy-Daily-Technical-Anal.jpg
    EurJpy-Daily-Technical-Anal.jpg
    50.3 KB · Views: 0
Usd/Chf : 15/12/2015 Technical Analysis Report From Centreforex

Our Preference: Sell Below 0.9830 for the target of 0.9750 levels.

Alternative Scenario: Nill

Technical Commentary : In Daily Chart :- Last 4 days UsdChf was trading in the sideways
movement between key resistance and key support level and trading above the lower trend line
and its trading below key resistance level, If lower trend line breaks means we can except on
selling side from intraday resitance level and except upto next key support level :- which we have
shown in attached image.

In 4 Hour Chart :- Usd/Chf was trading in the equidistant channel lines and its breaks the key
support level of horizontal line so its confirming for selling side and its trading sideways movement
between key resistance and key support levels and its trading near upper channel line so we can
sell near upper channel line and except upto next support level :- which we have shown in attached
image.

In 1 Hour Chart :- UsdChf was trading below upper trend line and its trading in the sideways
movement between key resistance and key support level so we can sell below the upper trend line
and except upto next key support level :- which we have shown in attached image.
 

Attachments

  • UsdChf-1-Hour-Technical-Ana.jpg
    UsdChf-1-Hour-Technical-Ana.jpg
    51.3 KB · Views: 0
  • UsdChf-4-Hour-Technical-Ana.jpg
    UsdChf-4-Hour-Technical-Ana.jpg
    37.8 KB · Views: 0
  • UsdChf-Daily-Technical-Anal.jpg
    UsdChf-Daily-Technical-Anal.jpg
    54.1 KB · Views: 0
Usd/Chf : 16/12/2015 Technical Analysis Report From Centreforex

Our Preference: Buy above 0.9850 for the target of 0.9960 levels.

Alternative Scenario: Nill

Technical Commentary : In Daily Chart :- After tresting the lower trend line UsdChf closed on higher side as bullich candle and UsdChf was broken the sideways movement on upper side of resistance level so we can buy near intraday support level and except upto next key resistance level :- which we have shown in attached image.
usdchf-d1-fxpro-financial-services-5.png


In 4 Hour Chart :- Usd/Chf was broken the equidistant channel lines on upper side and its breaks the key resistance level of horizontal line so its confirming for buying side and its broken the sideways movement and its trading above resistance level so we can sell near resistance level and except upto next resistance level :- which we have shown in attached image.
usdchf-h4-fxpro-financial-services.png


In 1 Hour Chart :- UsdChf was trading in the the equidistant channel lines and its was trading near key support level of horizontal line so we can buy above the support level and except upto next key resistance level :- which we have shown in attached image.
usdchf-h1-fxpro-financial-services-3.png
 
Eur/Jpy : 16/12/2015 Technical Analysis Report From CentreForex

Our Preference: Sell Below 133.60 for the target of 132.60 levels.

Alternative Scenario: Nill

Technical Commentary :- In Daily Chart :- Yesterday EurJpy was closed on lower side as bearish candle and closed above the support level of horizontal line and its trading below new upper trend line so today we can sell near upper trend line of key resistance level and except upto next key support 132.60 level :- We have shown in above image.
eurjpy-d1-fxpro-financial-services.png


In 4 Hour Chart :- EurJpy was trading in the short term and long term equidistant channel lines and now its trading near upper channel line equidistant channel line so we can sell near short term upper channel line of equidistant and except upto next key support levels :- We have shown in above image.
eurjpy-h4-fxpro-financial-services.png


In 1 Hour chart :- EurJpy was trading in the equidistant channel lines and now its trading near upper channel line equidistant channel line so we can sell near short term upper channel line of equidistant and except upto next key support levels :- We have shown in above image.
eurjpy-h1-fxpro-financial-services.png
 
Back
Top