Sive Morten
Special Consultant to the FPA
- Messages
- 18,695
Monthly
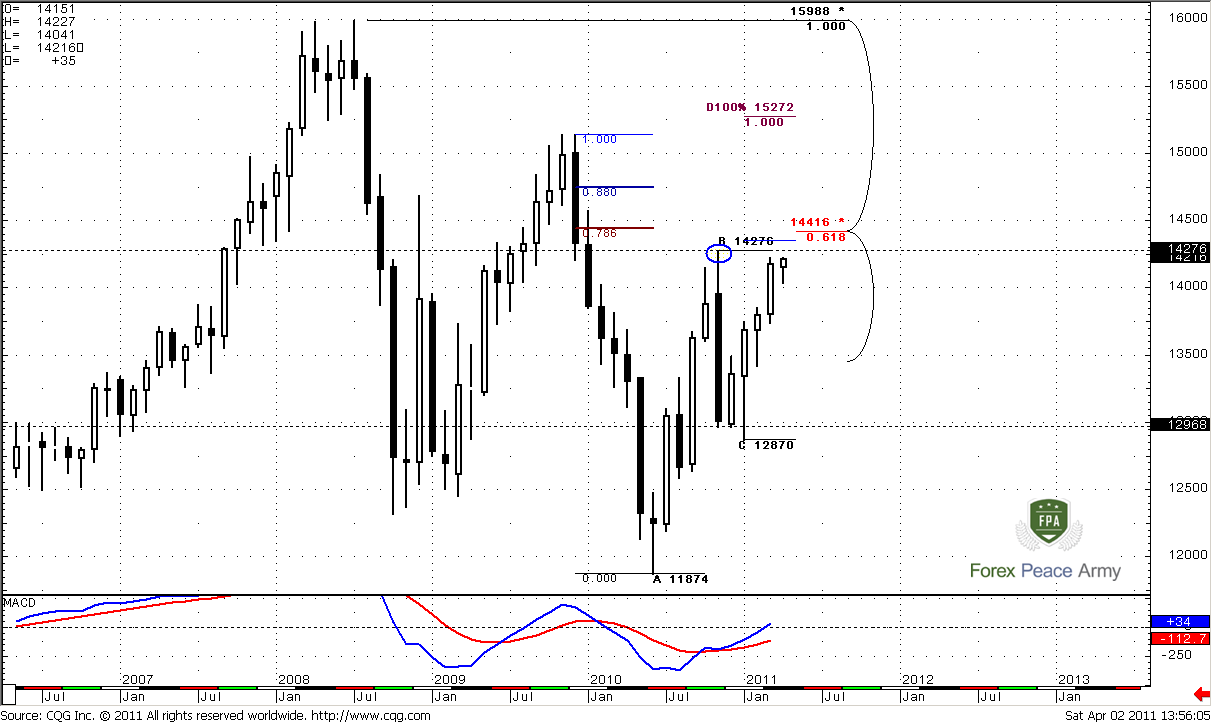
Trend is bullish, price action supports the trend. Market is neither overbought nor oversold on monthly time frame. So, there are no serious barriers for up move continuation.
I still show you the range of this nasty down bar with black dash lines. Market continues its erasing. And looking at the way how it’s happening – I have less and less confidence that previous highs will hold. Greedy market makers should at least clear out the stops. From this perspective the high of this bar at 1.4276 is particular interesting for us, partially because there are a lot of stops just above it.
Take a look at monthly ABC pattern. The nearest target is 0.618 Fib expansion stands at 1.4354 – just above the highs at 1.4276. I suppose, you can imagine what will happen, when market will trigger stops that had been placed their – in most unwelcome place. Just above it – strong Fib resistance stands. This is major 5/8 resistance at 1.4416 from all time high. The coincidence of Target and Fib resistance creates Agreement. Also 1.4444 is 0.786 Fib resistance from the recent swing down.
Hence, 1.4350-1.44 is a nearest monthly target. Second, the probability suggests that stops above 1.4276 will be triggered, if market will continue move up. Third – market can show W&R due to strong resistance just above the previous highs, or, at least, bounce to the downside during first touch of this area.
Weekly
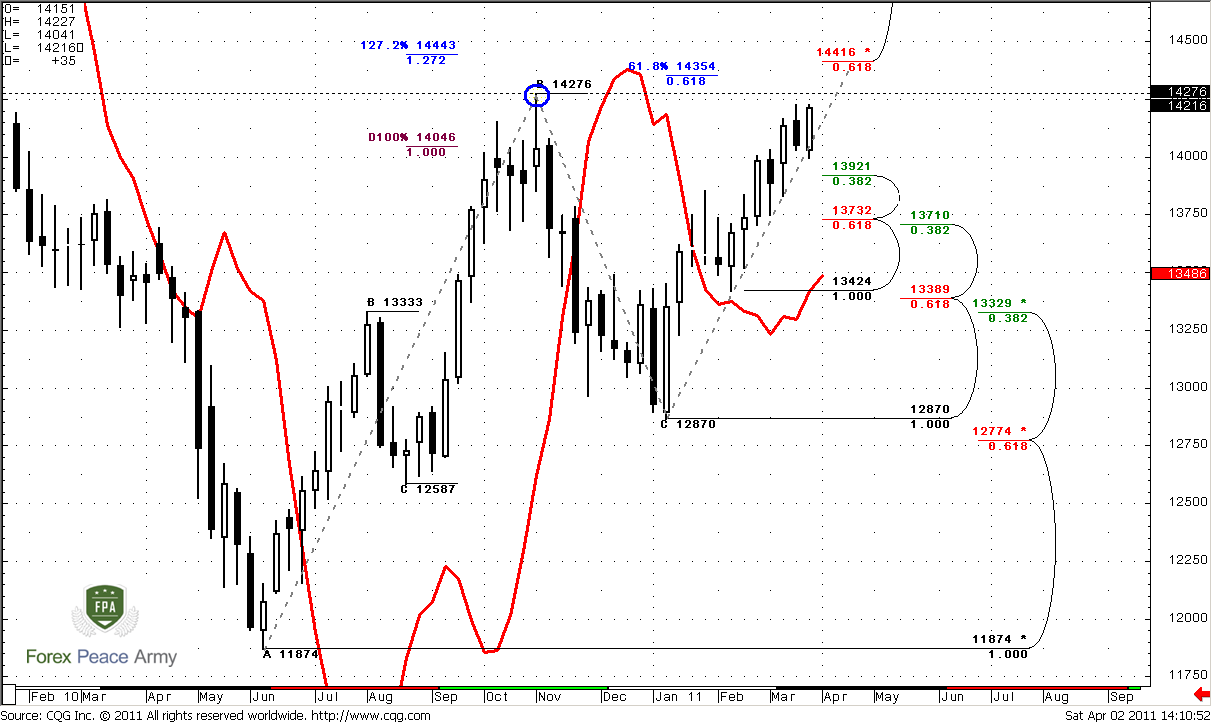
Weekly trend is also bullish. Let’s start from the targets first. Most of them stand around monthly 5/8 Fib resistance, but the nearest one is 1.4350.
So, at 1.4350-1.4440 are stand – three different ABC targets (1.4354; 1.4443; 1.4410), monthly major 5/8 Fib resistance (1.4416) and 0.786 Fib resistance 1.4444. Hence, I definitely will not want to buy in 1.4350-1.4440 area and will close any Long positions if I’ll have any. So, that’s the target.
Also I want to attract your attention to ABC pattern I’ve pointed on weekly timeframe. Look, how harmonic AB and CD legs are. Although 100 Fib expansion stands too far currently (above 1.52), the harmony in AB and CD is important moment. Second important moment – I suppose that market stands very close to 0.618 target and previous highs from weekly time frame view. The closer we to extreme, the more probable that market makers will force the highs to get stop orders.
At the same time market is not overbought currently and another strong resistance much higher. So, if you’re long-term trader and use weekly and monthly context for trading – then you have definitely bullish one. All fact, that we’ve discovered here tells, that if you want to enter the market – you should buy from nearest Fib support level 1.3921. Stop should be placed at least below 1.3710-1.3732 Confluence support, but it is safer to place stop below C point at 1.3424, although I’m not sure will it be correct from risk/reward ratio. Also you can see that trend will remain bullish precisely till that area.
I’m a bit trembled to promise such things as follows, but usually, when “BC” retracement stands not lower than 0.618 of AB move (like we have here), then, usually market reaches 100% extension target.
Daily
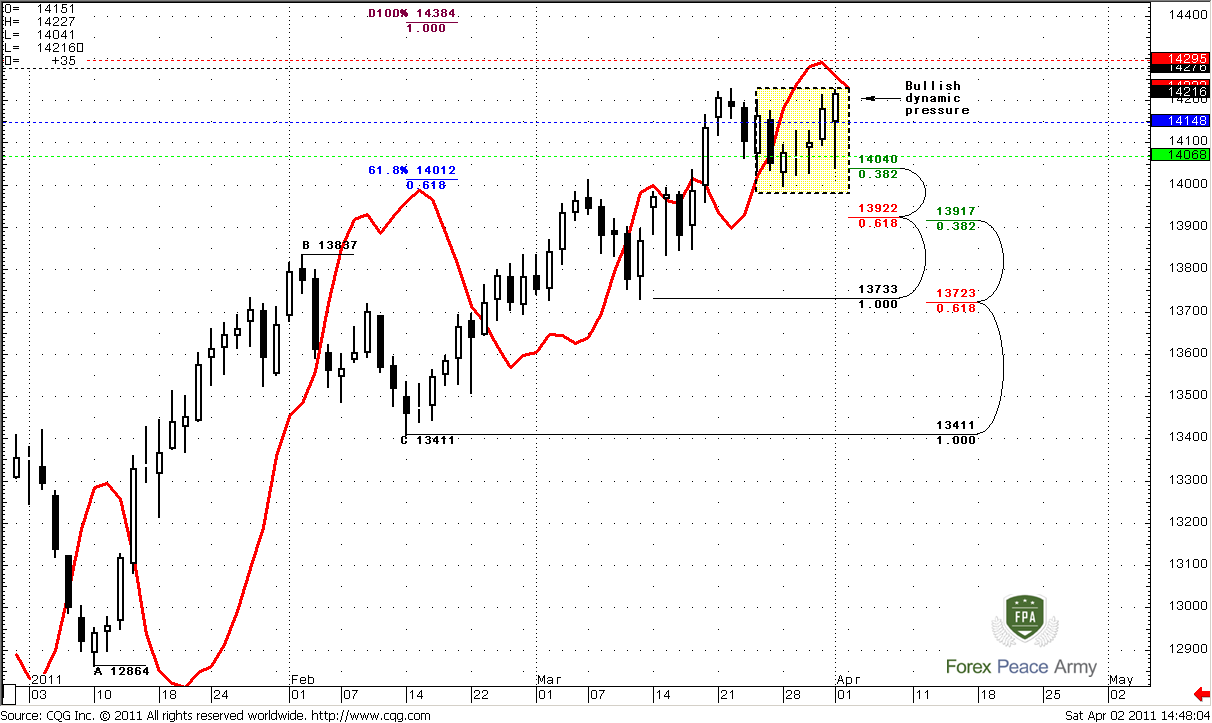
Daily trend is bearish, but my concerns about possible further up move have confirmed. Yesterday we’ve discussed the possible bullish dynamic pressure that is building on the market. After yesterday’s trading session it has become even more obvious. That’s why I have less and less scruples about further up move.
All targets stand above current level – somewhere around 1.4350-1.44 area. Although support levels are the same – but taking in consideration the way of price action, especially during NFP release, I’m not sure that market can show some significant retracement down, before it will take out previous highs. Beside, market does not overbought currently. It means that possibly, our focus swing will be the most recent one. Exactly this swing we will use to create our trading plan for next week.
As usual, colored dash lines are pivot levels.
4-hour
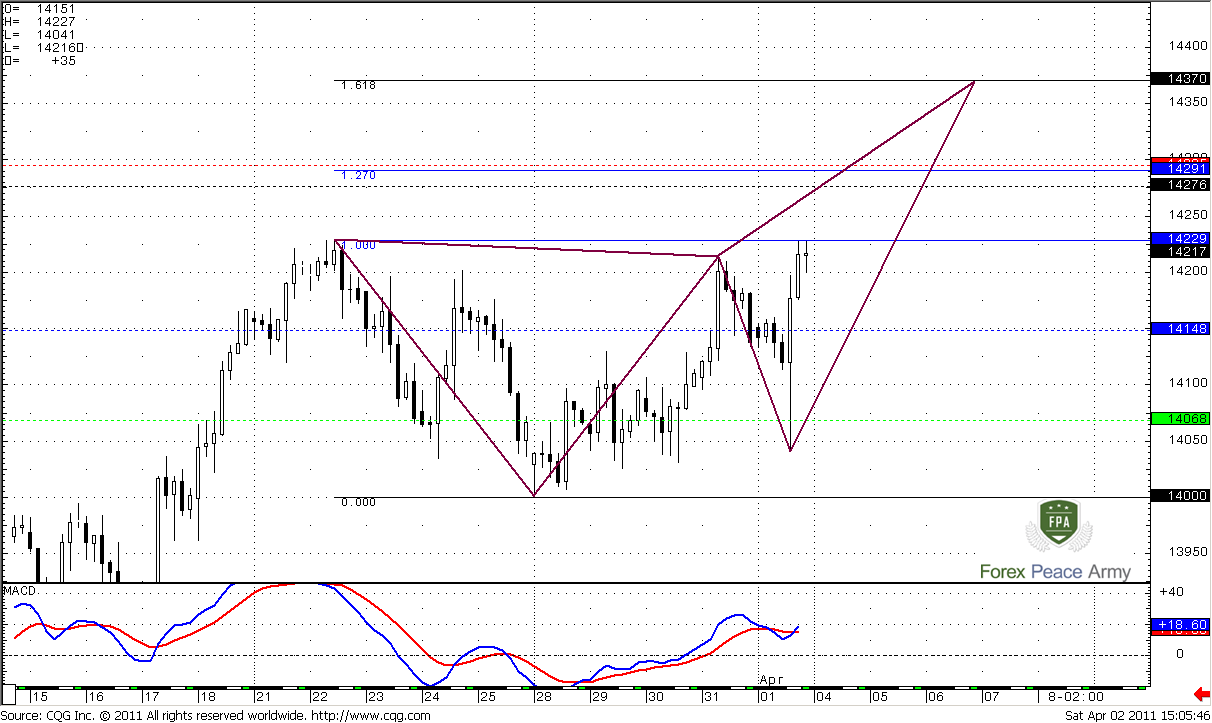
4-trend has turned bullish. Here I show you just one of the possible scenarios – market could form Butterfly “Sell”. 1.27 extension targets stands right at weekly pivot resistance 1
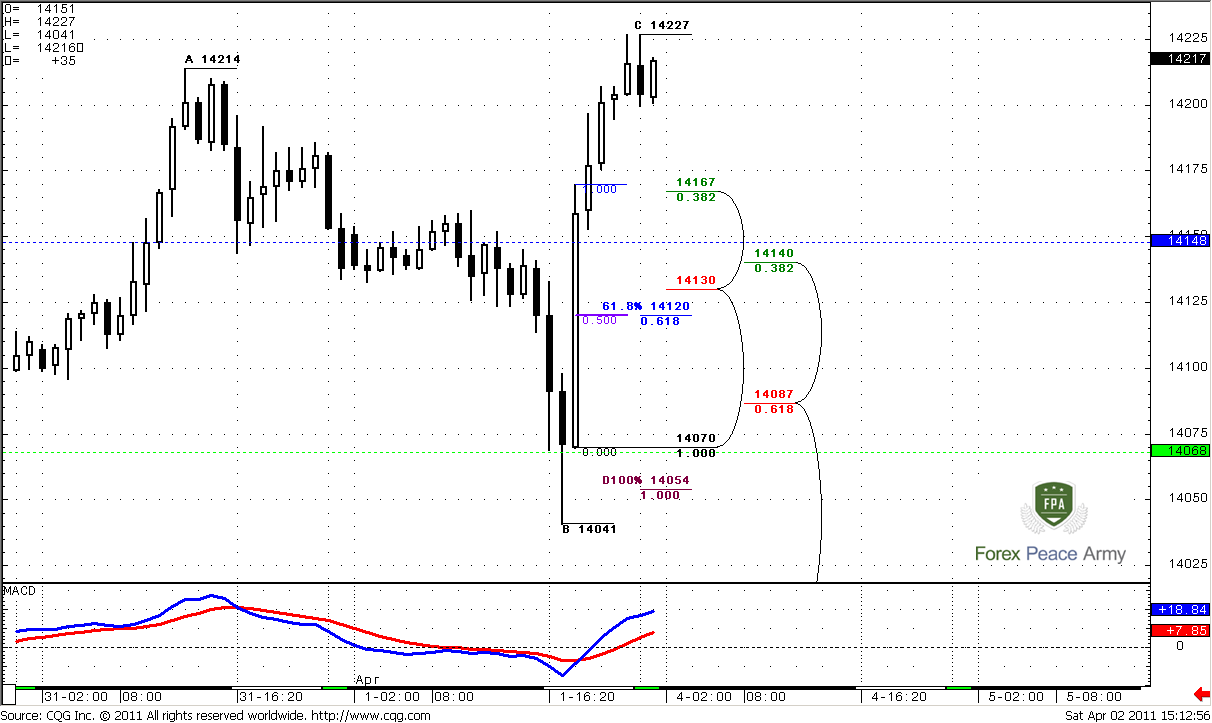
1-Hour
Here we will act as usual – I suppose you can make a trading plan by yourself already. We’ve decided that our direction for entering the market is UP. So, we need some pullback for entering. The level to watch is 1.4130-1.4150 – it includes weekly pivot 1.4148, hourly confluence support 1.4130-1.4140, 50% support on this explosive thrust up bar and 0.618 Fib extension support from ABC pattern. I think that market could show retracement to this level.
Again – we need gradual retracement and not a free falling. If market will fall like a stone –don’t be long. Also it is safer to enter the market, when it will bounce from this area already and move above pivot. If retracement will be gradual, but market will hold below pivot – also do not haste to enter Long.
Stop is better place below weekly pivot support 1 at 1.4088
Conclusion:
Position traders:
Hold longs.
Intraday traders:
1. Wait for pullback to weekly pivot around 1.4120-1.4148;
2. Be sure that market does not fall like a stone –retracement down should be gradual;
3. You may try to buy from there after testing this area by the market and its pull back above pivot with stop below 1.4088;
4. Target – 1.43 - 1.4350. It’s difficult to predict will it be 1.27 target of 4-hour butterfly or 1.618.
5. If market will hold below pivot point – don’t be long.
The technical portion of Sive's analysis owes a great deal to Joe DiNapoli's methods, and uses a number of Joe's proprietary indicators. Please note that Sive's analysis is his own view of the market and is not endorsed by Joe DiNapoli or any related companies.
Trend is bullish, price action supports the trend. Market is neither overbought nor oversold on monthly time frame. So, there are no serious barriers for up move continuation.
I still show you the range of this nasty down bar with black dash lines. Market continues its erasing. And looking at the way how it’s happening – I have less and less confidence that previous highs will hold. Greedy market makers should at least clear out the stops. From this perspective the high of this bar at 1.4276 is particular interesting for us, partially because there are a lot of stops just above it.
Take a look at monthly ABC pattern. The nearest target is 0.618 Fib expansion stands at 1.4354 – just above the highs at 1.4276. I suppose, you can imagine what will happen, when market will trigger stops that had been placed their – in most unwelcome place. Just above it – strong Fib resistance stands. This is major 5/8 resistance at 1.4416 from all time high. The coincidence of Target and Fib resistance creates Agreement. Also 1.4444 is 0.786 Fib resistance from the recent swing down.
Hence, 1.4350-1.44 is a nearest monthly target. Second, the probability suggests that stops above 1.4276 will be triggered, if market will continue move up. Third – market can show W&R due to strong resistance just above the previous highs, or, at least, bounce to the downside during first touch of this area.
Weekly
Weekly trend is also bullish. Let’s start from the targets first. Most of them stand around monthly 5/8 Fib resistance, but the nearest one is 1.4350.
So, at 1.4350-1.4440 are stand – three different ABC targets (1.4354; 1.4443; 1.4410), monthly major 5/8 Fib resistance (1.4416) and 0.786 Fib resistance 1.4444. Hence, I definitely will not want to buy in 1.4350-1.4440 area and will close any Long positions if I’ll have any. So, that’s the target.
Also I want to attract your attention to ABC pattern I’ve pointed on weekly timeframe. Look, how harmonic AB and CD legs are. Although 100 Fib expansion stands too far currently (above 1.52), the harmony in AB and CD is important moment. Second important moment – I suppose that market stands very close to 0.618 target and previous highs from weekly time frame view. The closer we to extreme, the more probable that market makers will force the highs to get stop orders.
At the same time market is not overbought currently and another strong resistance much higher. So, if you’re long-term trader and use weekly and monthly context for trading – then you have definitely bullish one. All fact, that we’ve discovered here tells, that if you want to enter the market – you should buy from nearest Fib support level 1.3921. Stop should be placed at least below 1.3710-1.3732 Confluence support, but it is safer to place stop below C point at 1.3424, although I’m not sure will it be correct from risk/reward ratio. Also you can see that trend will remain bullish precisely till that area.
I’m a bit trembled to promise such things as follows, but usually, when “BC” retracement stands not lower than 0.618 of AB move (like we have here), then, usually market reaches 100% extension target.
Daily
Daily trend is bearish, but my concerns about possible further up move have confirmed. Yesterday we’ve discussed the possible bullish dynamic pressure that is building on the market. After yesterday’s trading session it has become even more obvious. That’s why I have less and less scruples about further up move.
All targets stand above current level – somewhere around 1.4350-1.44 area. Although support levels are the same – but taking in consideration the way of price action, especially during NFP release, I’m not sure that market can show some significant retracement down, before it will take out previous highs. Beside, market does not overbought currently. It means that possibly, our focus swing will be the most recent one. Exactly this swing we will use to create our trading plan for next week.
As usual, colored dash lines are pivot levels.
4-hour
4-trend has turned bullish. Here I show you just one of the possible scenarios – market could form Butterfly “Sell”. 1.27 extension targets stands right at weekly pivot resistance 1
1-Hour
Here we will act as usual – I suppose you can make a trading plan by yourself already. We’ve decided that our direction for entering the market is UP. So, we need some pullback for entering. The level to watch is 1.4130-1.4150 – it includes weekly pivot 1.4148, hourly confluence support 1.4130-1.4140, 50% support on this explosive thrust up bar and 0.618 Fib extension support from ABC pattern. I think that market could show retracement to this level.
Again – we need gradual retracement and not a free falling. If market will fall like a stone –don’t be long. Also it is safer to enter the market, when it will bounce from this area already and move above pivot. If retracement will be gradual, but market will hold below pivot – also do not haste to enter Long.
Stop is better place below weekly pivot support 1 at 1.4088
Conclusion:
Position traders:
Hold longs.
Intraday traders:
1. Wait for pullback to weekly pivot around 1.4120-1.4148;
2. Be sure that market does not fall like a stone –retracement down should be gradual;
3. You may try to buy from there after testing this area by the market and its pull back above pivot with stop below 1.4088;
4. Target – 1.43 - 1.4350. It’s difficult to predict will it be 1.27 target of 4-hour butterfly or 1.618.
5. If market will hold below pivot point – don’t be long.
The technical portion of Sive's analysis owes a great deal to Joe DiNapoli's methods, and uses a number of Joe's proprietary indicators. Please note that Sive's analysis is his own view of the market and is not endorsed by Joe DiNapoli or any related companies.
Last edited: