Sive Morten
Special Consultant to the FPA
- Messages
- 18,760
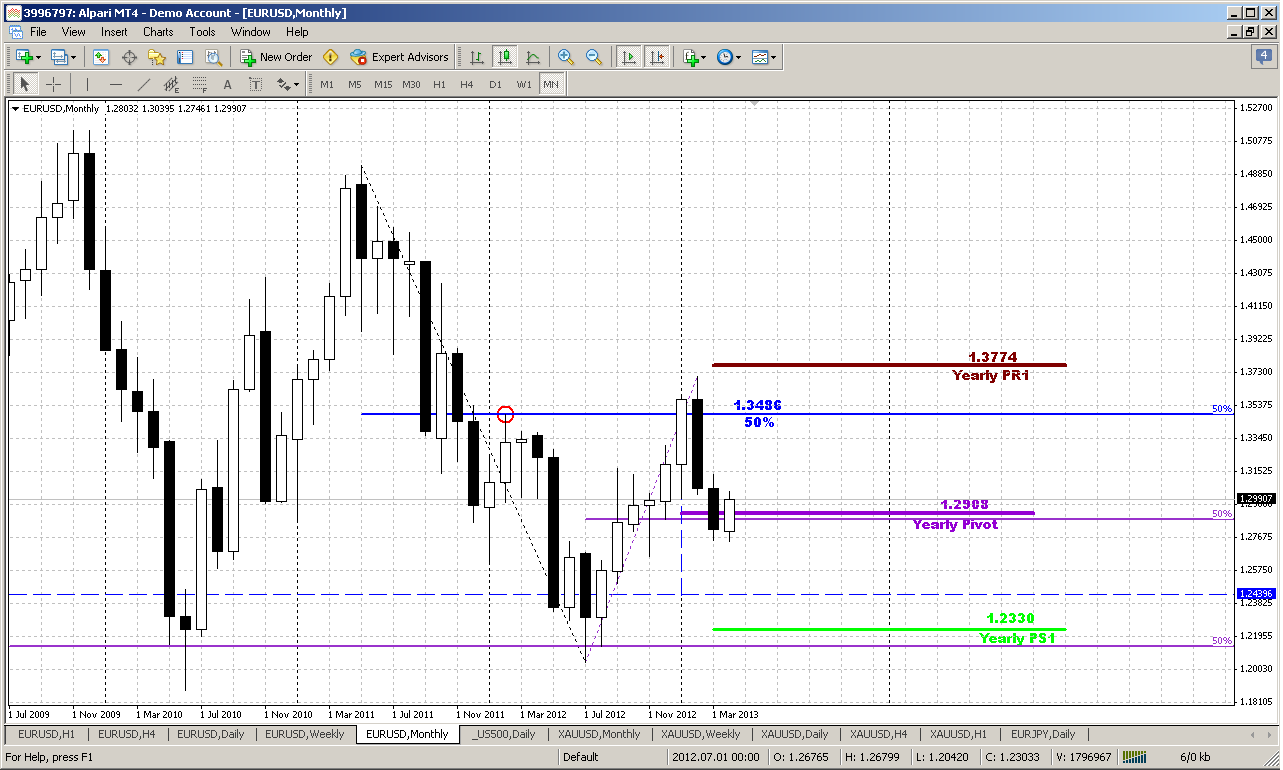
Monthly
On big picture we see price bounce from support. It is difficult to say whether this reaction on yearly pivot or on 50% support level – anyway bounce has started, we’ve talked about it much in our day-by-day analysis. Still, probably this should be treated just as retracement, because we need breakout of 1.3710 highs to speak again about bull trend. Until this will not happen – price action will remain just retracement. Besides, nobody has cancelled bearish engulfing pattern and I see nothing curious with this minor bounce. If you will take a look at engulfing patterns, especially on long-term charts, you’ll see that in most cases some at least small retracement happens after pattern has been completed. And here we have support right below it. As the conclusion of monthly analysis we can say that we have bearish pattern that points on long-term perspective down to 1.25 area. Hence current bounce could be used as a rally to Sell into. As a result, our major task is to estimate where this retracement rally could finish and determine potential entry point on lower time frames.
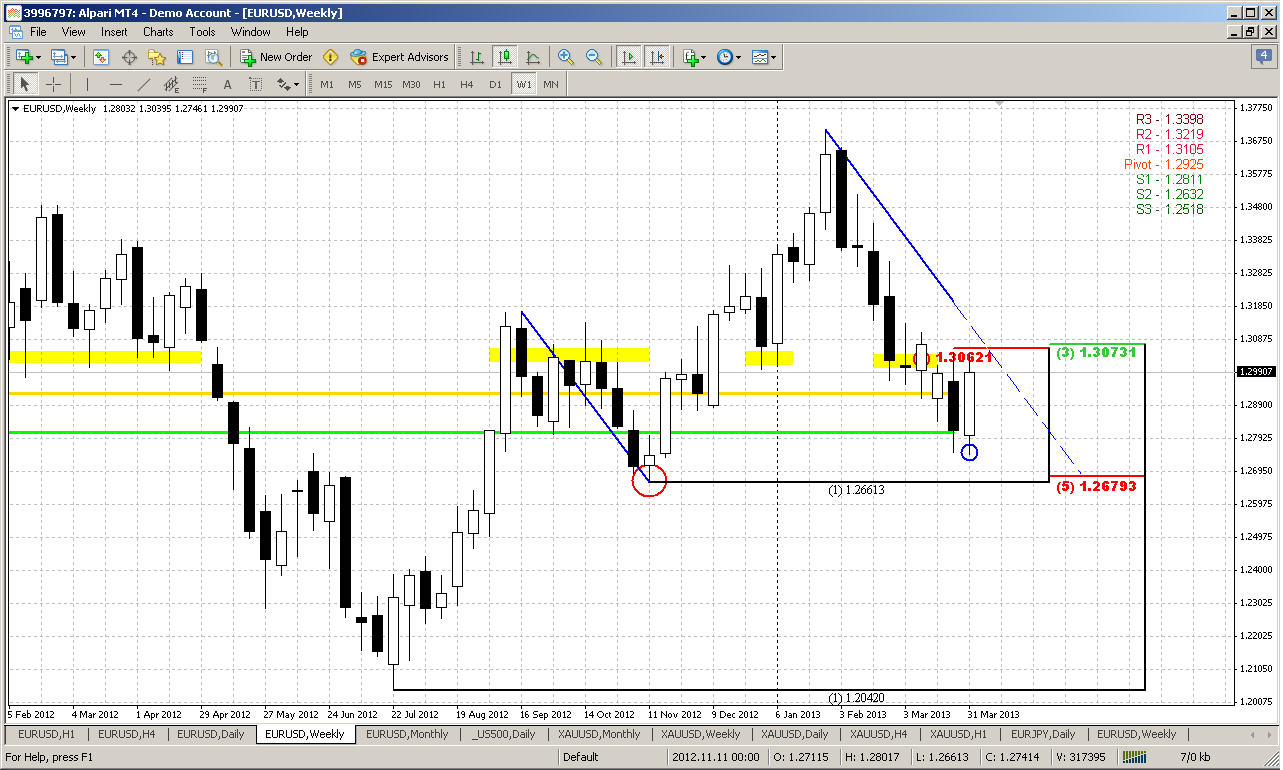
Weekly
Trend is bearish here, market is not at oversold. On the first glance situation looks slightly confusing. Market is bouncing somewhere between significant targets – it slightly has not reached major 5/8 support and has stopped prior the end of harmonic swing. At the same time current level includes yearly pivot point area, MPS1 and monthly 50% support. This probably was enough to hold price for some time. Now I do not want to speak about re-testing of disrespected K-support area, since this almost has happened. Currently on the week chart I’m interesting with two moments. First is current tendency and second is – bullish engulfing pattern.
Despite how bearish market is on daily time frame, take a look it has not broken yet major bullish tendency here and it is still forming higher highs and higher lows. Current low is higher than previous one. And to speak strictly, we can say that long-term bear trend is re-established only if market will move below 5/8 major support here and previous low. This is first moment.
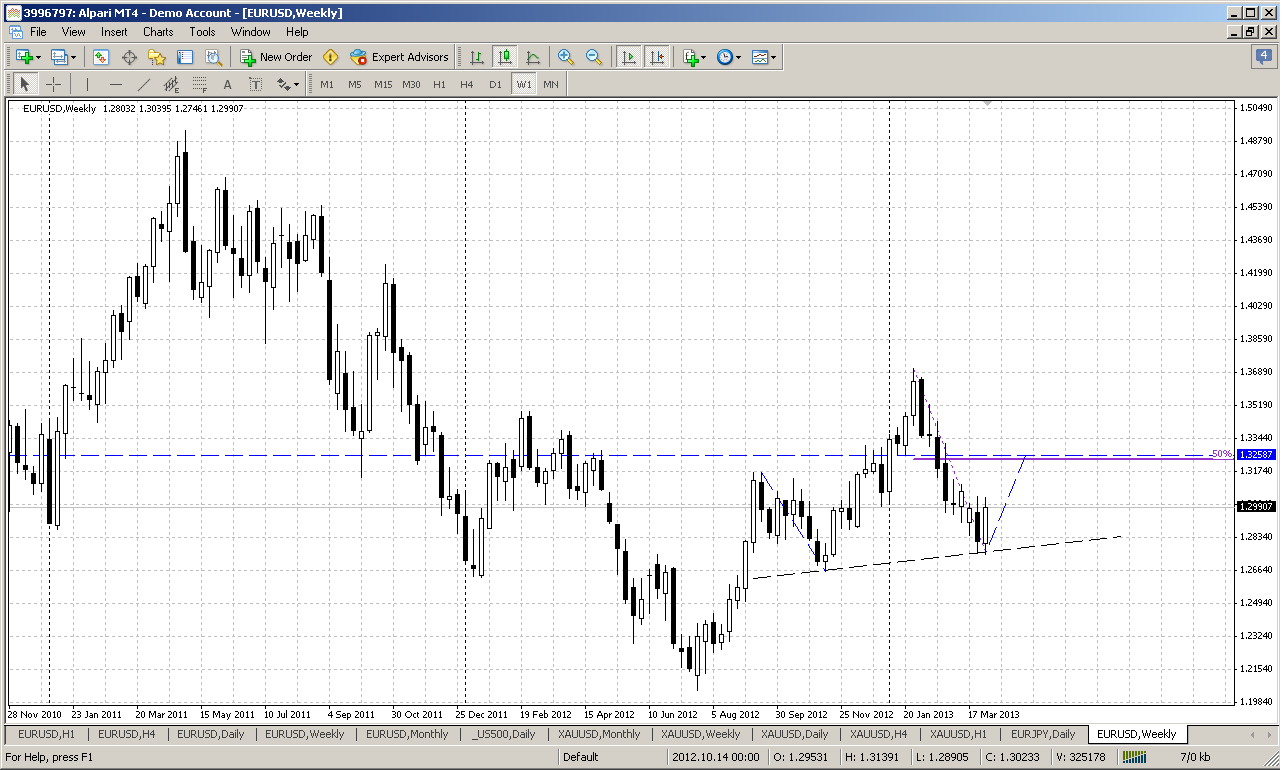
Second moment is current bullish engulfing pattern. It has two consequences. It limits us with our bearish ambitions, since until it will not been cancelled, theoretically context will remain bullish. Another possible consequence is shown on weekly #2 chart could take at least the shape of H&S.
Yes, it might be some kind of H&S pattern. Although I think that H&S pattern has to appear on significant tops but here we do not have any, but the price action that could take the shape of H&S. Despite whether we would call it as H&S or not, it just means that retracement could reach as far as 1.3260 area – 50% resistance of whole current downward move (by applying the harmony). And we know that EUR likes 50% level most of all others.
There is no contradiction between monthly and weekly setups. Current combination just means that downward continuation due monthly pattern could start from higher price – where weekly bullish pattern will exhaust and reach its target. Since we trade on daily chart and intraday, for us this means that we are bullish in short term until target will be hit or bullish engulfing pattern will be vanished by breaking through its low.
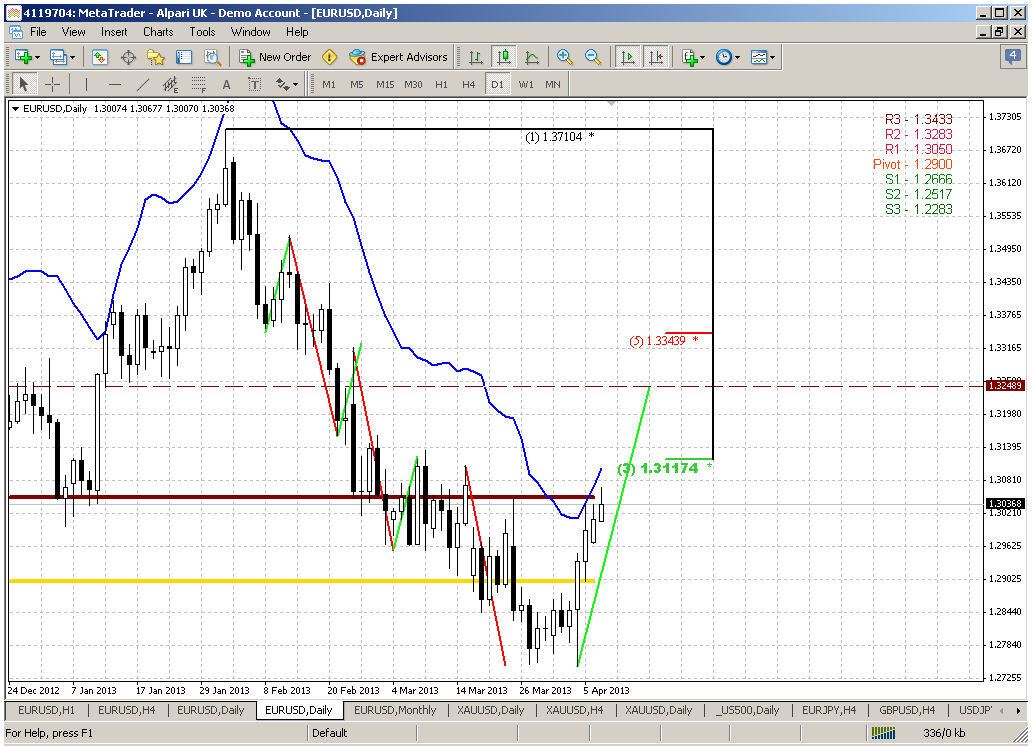
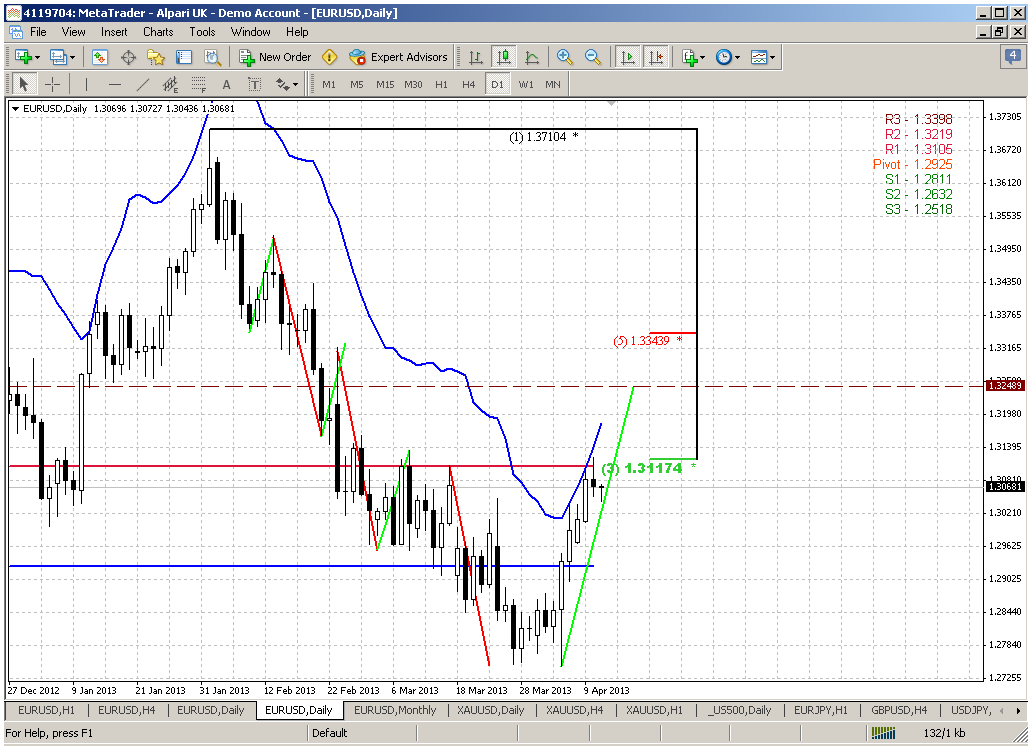
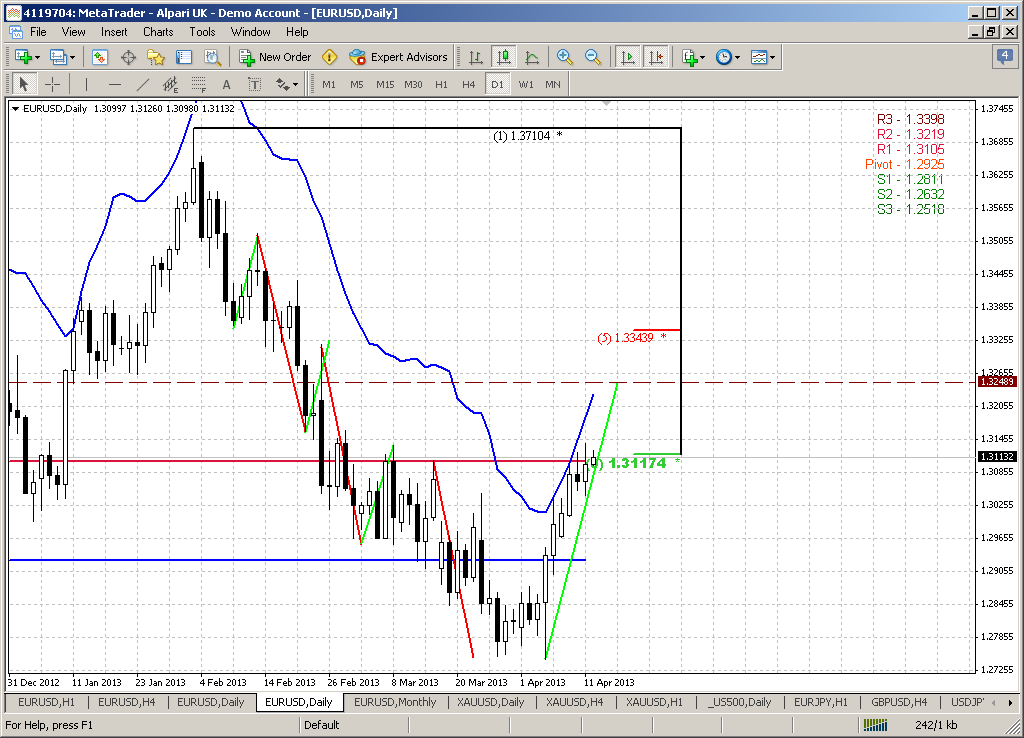
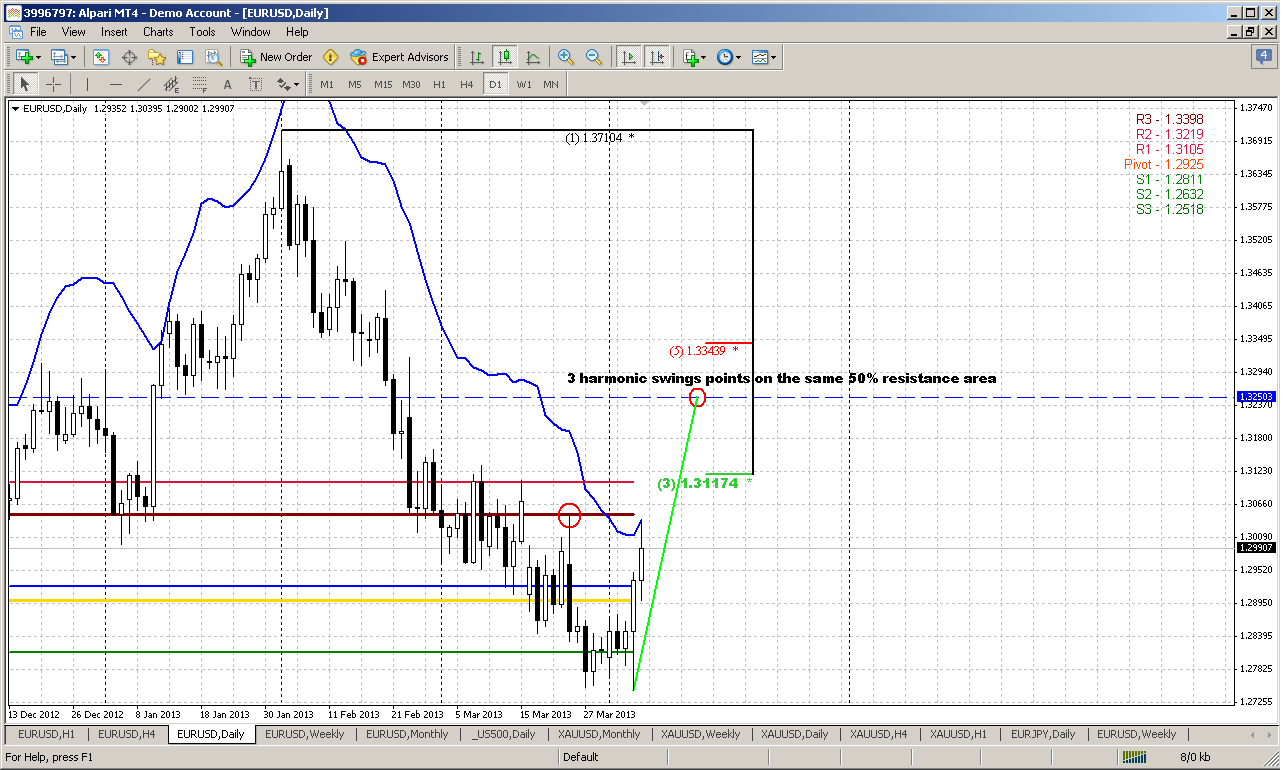
Daily
So, we’ve decided that in short term perspective market probably is more bullish rather than bearish. On daily time frame trend is up and price action confirms it by nice jump right to overbought condition and MPR1. This probably was a barrier and has prevented market from reaching double of harmonic swing. We know that price at resistance and we should be ready for some pullback in the beginning of the week, especially if we take into consideration new WPP at 1.2925.
Interesting is that 3 harmonic swings up points on the same 1.3250 area as on weekly chart. But before that there is another major 3/8 resistance at 1.3217, double of harmonic swing and WPR1 – that probably will be target for the first part of current week, or even for the whole week.
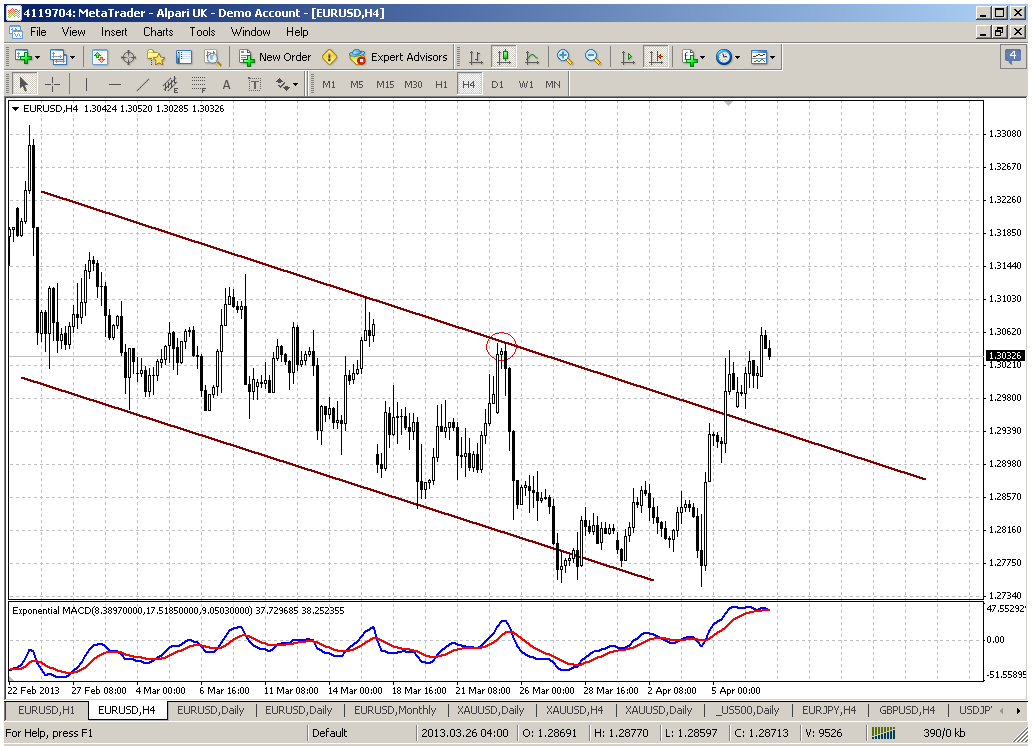
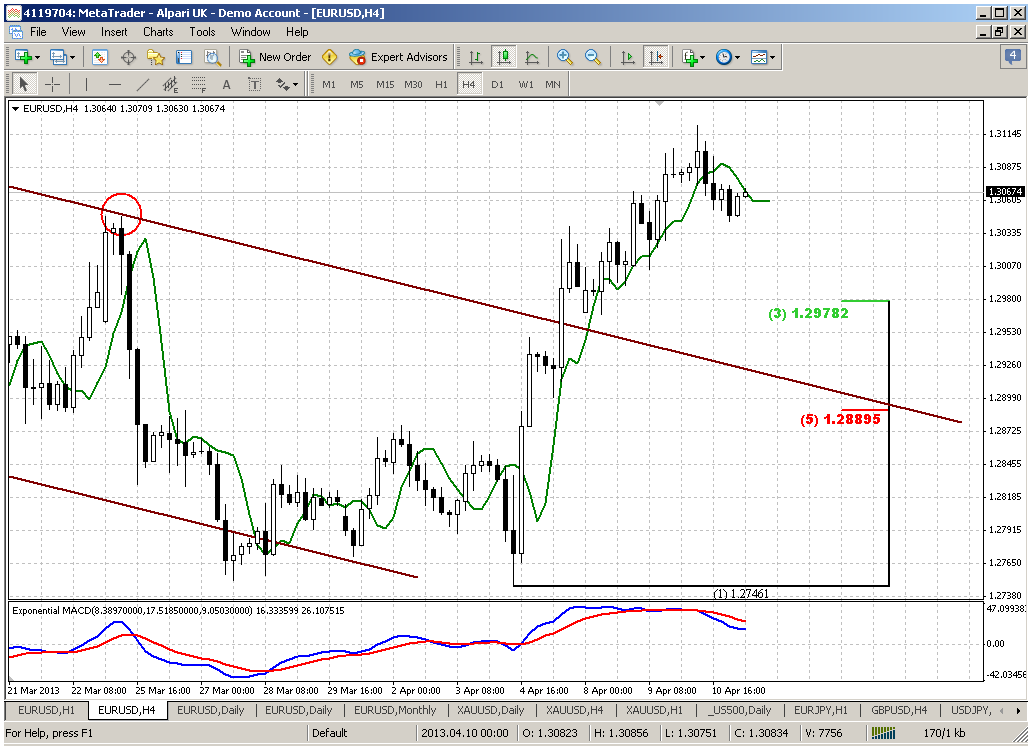
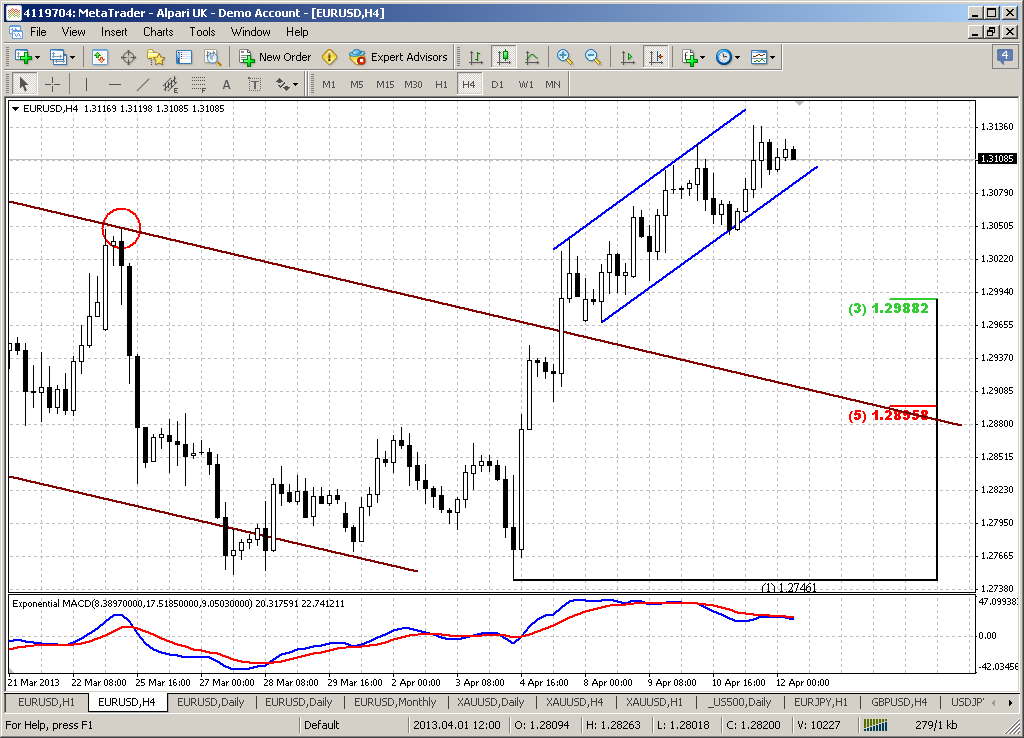
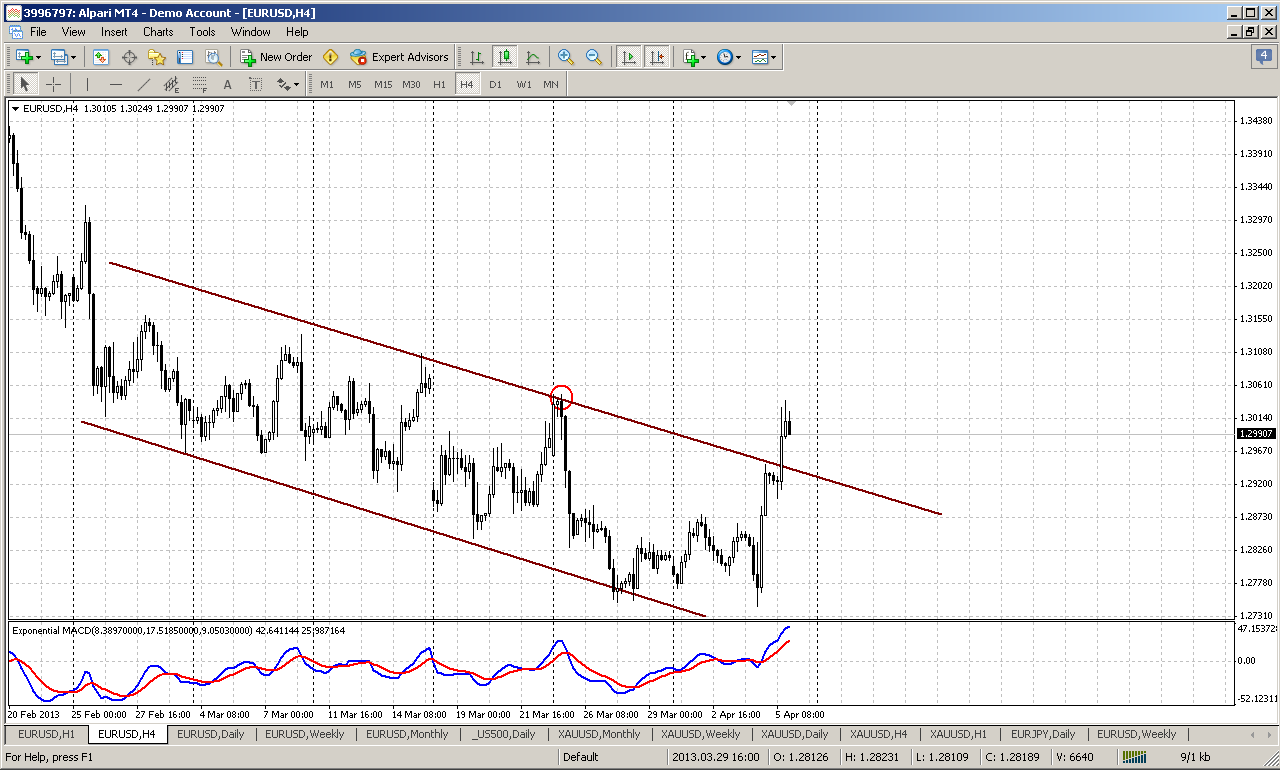
4-hour
Here we finally have got another bullish confirmation – upward breakout from tendency. Still there is another additional moment to watch – moving above previous swing high. This will finally confirm short-term upward reversal.
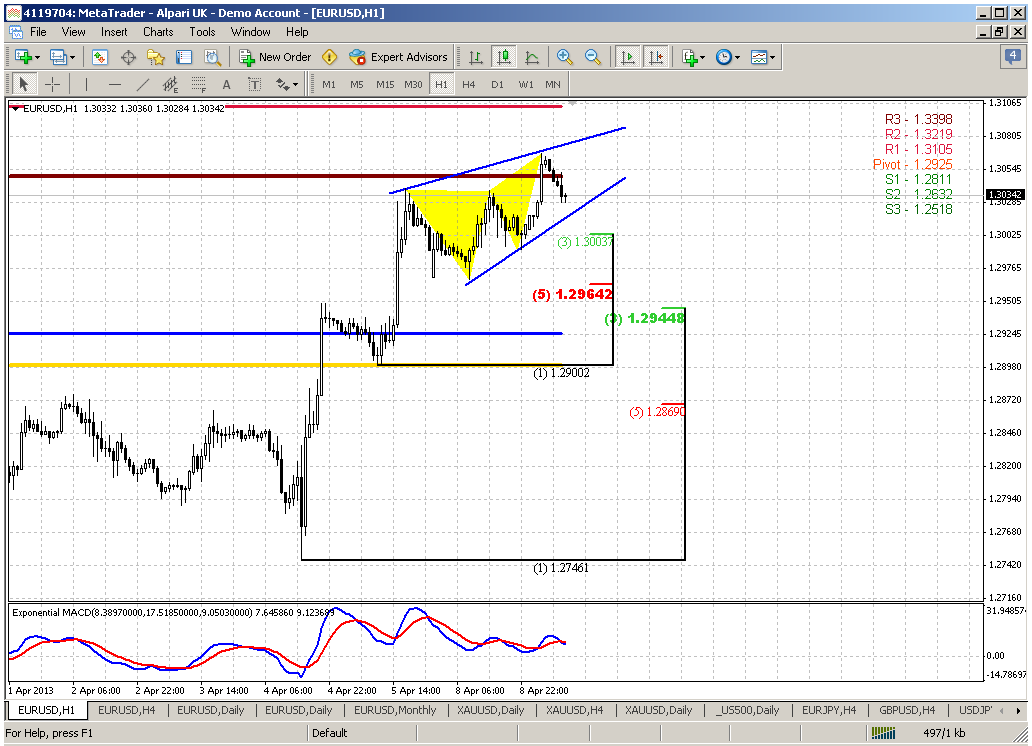
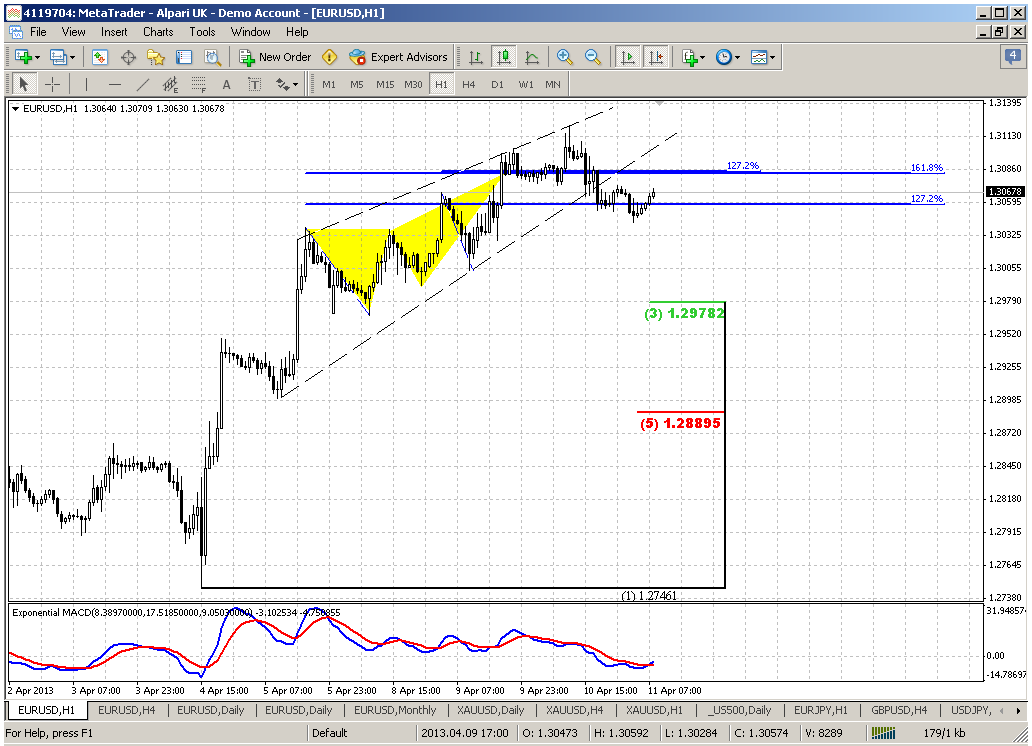
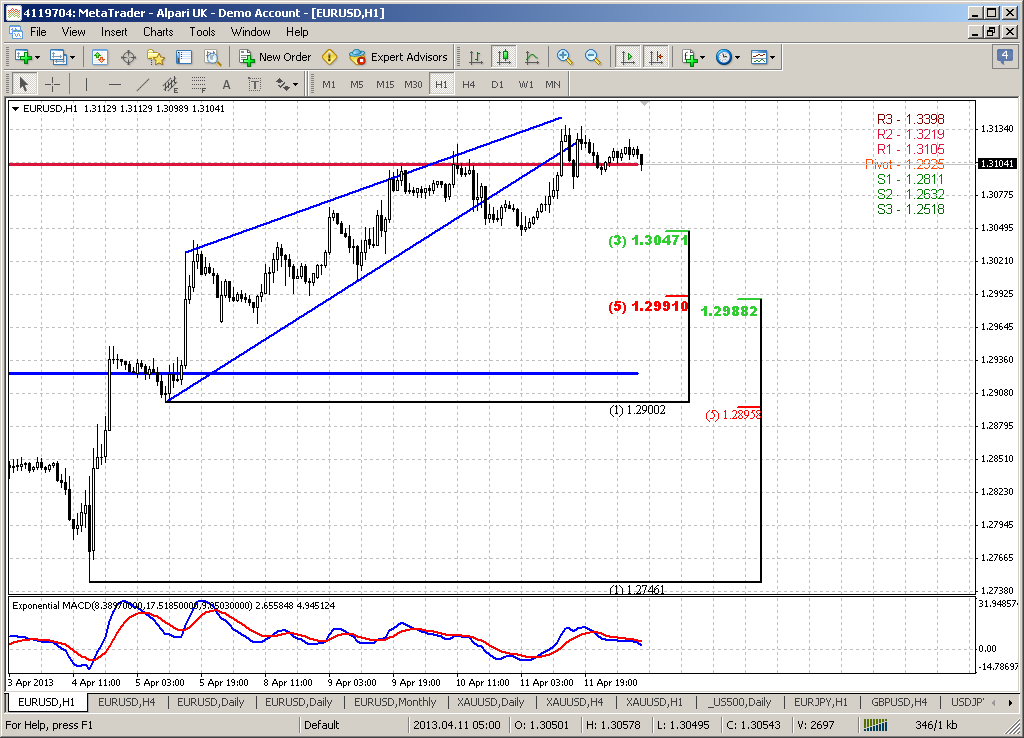
60-min
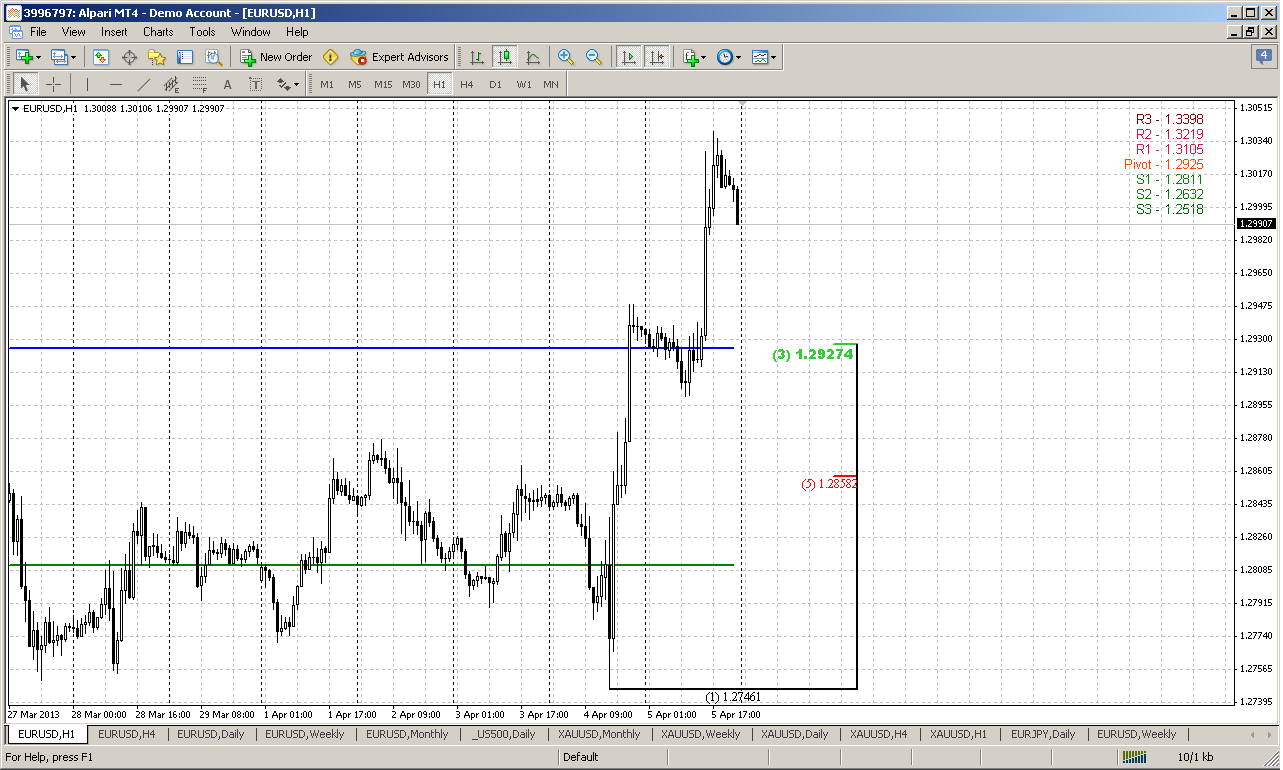
And here is a level for potential long entry. Although we can get higher Fib levels from most recent swing up, but we’re at daily overbought, so some deeper retracment could follow. From that point of view 1.2930 looks attractive as first area to watch for buying opportunity. This is WPP and 3/8 support level. If market will show this move – it simultaneously will become re-testing of broken upper border of the channel on 4-hour chart.
Conclusion:
Despite the moment that long-term picture is bearish, in short-term perspective market looks bullish and gives hints that it could show deeper retracement up. Probable target on current week will be 1.3120 area, while a bit extended target could be 1.3250.
The technical portion of Sive's analysis owes a great deal to Joe DiNapoli's methods, and uses a number of Joe's proprietary indicators. Please note that Sive's analysis is his own view of the market and is not endorsed by Joe DiNapoli or any related companies.
On big picture we see price bounce from support. It is difficult to say whether this reaction on yearly pivot or on 50% support level – anyway bounce has started, we’ve talked about it much in our day-by-day analysis. Still, probably this should be treated just as retracement, because we need breakout of 1.3710 highs to speak again about bull trend. Until this will not happen – price action will remain just retracement. Besides, nobody has cancelled bearish engulfing pattern and I see nothing curious with this minor bounce. If you will take a look at engulfing patterns, especially on long-term charts, you’ll see that in most cases some at least small retracement happens after pattern has been completed. And here we have support right below it. As the conclusion of monthly analysis we can say that we have bearish pattern that points on long-term perspective down to 1.25 area. Hence current bounce could be used as a rally to Sell into. As a result, our major task is to estimate where this retracement rally could finish and determine potential entry point on lower time frames.
Weekly
Trend is bearish here, market is not at oversold. On the first glance situation looks slightly confusing. Market is bouncing somewhere between significant targets – it slightly has not reached major 5/8 support and has stopped prior the end of harmonic swing. At the same time current level includes yearly pivot point area, MPS1 and monthly 50% support. This probably was enough to hold price for some time. Now I do not want to speak about re-testing of disrespected K-support area, since this almost has happened. Currently on the week chart I’m interesting with two moments. First is current tendency and second is – bullish engulfing pattern.
Despite how bearish market is on daily time frame, take a look it has not broken yet major bullish tendency here and it is still forming higher highs and higher lows. Current low is higher than previous one. And to speak strictly, we can say that long-term bear trend is re-established only if market will move below 5/8 major support here and previous low. This is first moment.
Second moment is current bullish engulfing pattern. It has two consequences. It limits us with our bearish ambitions, since until it will not been cancelled, theoretically context will remain bullish. Another possible consequence is shown on weekly #2 chart could take at least the shape of H&S.
Yes, it might be some kind of H&S pattern. Although I think that H&S pattern has to appear on significant tops but here we do not have any, but the price action that could take the shape of H&S. Despite whether we would call it as H&S or not, it just means that retracement could reach as far as 1.3260 area – 50% resistance of whole current downward move (by applying the harmony). And we know that EUR likes 50% level most of all others.
There is no contradiction between monthly and weekly setups. Current combination just means that downward continuation due monthly pattern could start from higher price – where weekly bullish pattern will exhaust and reach its target. Since we trade on daily chart and intraday, for us this means that we are bullish in short term until target will be hit or bullish engulfing pattern will be vanished by breaking through its low.
Daily
So, we’ve decided that in short term perspective market probably is more bullish rather than bearish. On daily time frame trend is up and price action confirms it by nice jump right to overbought condition and MPR1. This probably was a barrier and has prevented market from reaching double of harmonic swing. We know that price at resistance and we should be ready for some pullback in the beginning of the week, especially if we take into consideration new WPP at 1.2925.
Interesting is that 3 harmonic swings up points on the same 1.3250 area as on weekly chart. But before that there is another major 3/8 resistance at 1.3217, double of harmonic swing and WPR1 – that probably will be target for the first part of current week, or even for the whole week.
4-hour
Here we finally have got another bullish confirmation – upward breakout from tendency. Still there is another additional moment to watch – moving above previous swing high. This will finally confirm short-term upward reversal.
60-min
And here is a level for potential long entry. Although we can get higher Fib levels from most recent swing up, but we’re at daily overbought, so some deeper retracment could follow. From that point of view 1.2930 looks attractive as first area to watch for buying opportunity. This is WPP and 3/8 support level. If market will show this move – it simultaneously will become re-testing of broken upper border of the channel on 4-hour chart.
Conclusion:
Despite the moment that long-term picture is bearish, in short-term perspective market looks bullish and gives hints that it could show deeper retracement up. Probable target on current week will be 1.3120 area, while a bit extended target could be 1.3250.
The technical portion of Sive's analysis owes a great deal to Joe DiNapoli's methods, and uses a number of Joe's proprietary indicators. Please note that Sive's analysis is his own view of the market and is not endorsed by Joe DiNapoli or any related companies.