- Forex, Gold, BTC Market Analysis | Trading Signals
- Sive Morten- Currencies, Gold, Bitcoin Daily Video
You are using an out of date browser. It may not display this or other websites correctly.
You should upgrade or use an alternative browser.
You should upgrade or use an alternative browser.
FOREX PRO Weekly April 15-19, 2013
- Thread starter Sive Morten
- Start date
Google could not help me much. Would you please tell me Sive what is the VOB patter. What is its elaborated name.
www.forexpeacearmy.com/forex-forum/...-detrended-oscillator-momentum-indicator.html
Sive Morten
Special Consultant to the FPA
- Messages
- 18,760
Hi Bigbuck,
VOB could appear anywhere, but it doesn't not transfer automatically on other pairs that have relation to EUR or JPY.
Look at DOSC.
VOB could appear anywhere, but it doesn't not transfer automatically on other pairs that have relation to EUR or JPY.
Look at DOSC.
handlerforex
Recruit
- Messages
- 6
Sive,
Thank you so much! You are the king, man!!!
Thank you so much! You are the king, man!!!
Hi Sive!
I must say I`d really appreciate if you kept updating EUR/USD pair every single day instead jumping from one pair to another. Of course I have nothing against JPY pair as long as you don`t forget about EUR.
Anyway hope that today`s move up will be worth to make another update and thanks again for your helpful analyzes!
LeoDvinchi
Private
- Messages
- 17
I will present myself,
my nick is Leo (my name is not) and first of all I would like to thank Sive for his work and everyone else who has built and contributed this wonderful site. Special thanks to Sive, who treats all of us with special care.
I'm a automobile designer, so any comment I make has to be put into that context; but I follow closely the markets and I trade often.
LeoDvinchi
Private
- Messages
- 17
I have a question regarding correlation
At the moment you are following two pairs. EURUSD and EURJPY. I understand the logic of both trades but the context is suggesting to me that one of the two pairs is not telling us the truth
On the EURUSD we are expecting a pullback to zone 1.3230-80 and we are almost there. On the EURJPY we are looking at an 161f impulse above max. Which means:
1) If we are going to get both of these simultaneously it means the USDJPY has to go through a vicious impulse and this is the pair to follow for longs and not the EURJPY
2) Could we be getting a W&R on the EURJPY instead.
LeoDvinchi
Private
- Messages
- 17
Relating to the question above
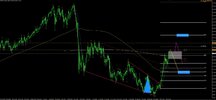
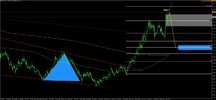
I attach my view on the weekly EURJPY:
1) blue - my target and retracement target
2) in yellow - w&R scenario I asked about previously
3) In white - the impulse i believe to be the good one
4) the grey box - above, it's a buy. Bellow, it's a sell. W&R scenario to anticipate the sell options
I hope I can't upload the picture

Last edited:
LeoDvinchi
Private
- Messages
- 17
LeoDvinchi
Private
- Messages
- 17
Last picture
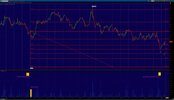
Dollar Index and - correlation with Euro
During the night of the Cyprus deal the Dollar Index made a huge inverted hammer (see picture) it didn't have massive volume but the range was massive, Do you think this candle can tell us something? or am I thinking too much?:
1) Watch how significant the fibo levels of this candle are. Coincidence?
2) Yesterday we had a huge spike in volume as it approached the 50% fibo. The volume was similar to the levels seen during the Cyprus week. (Volumes are of the futures - regulated and used by professionals I believe)
3) I did not see a similar (inverted) candle in the EUR or any other pair - how is this possible?
4)I did check with the broker and this candle is not a platform error

Last edited:
Similar threads
- Replies
- 0
- Views
- 46
- Replies
- 7
- Views
- 216
- Replies
- 7
- Views
- 232
- Replies
- 0
- Views
- 76
- Forex, Gold, BTC Market Analysis | Trading Signals
- Sive Morten- Currencies, Gold, Bitcoin Daily Video
