Sive Morten
Special Consultant to the FPA
- Messages
- 18,673
Monthly
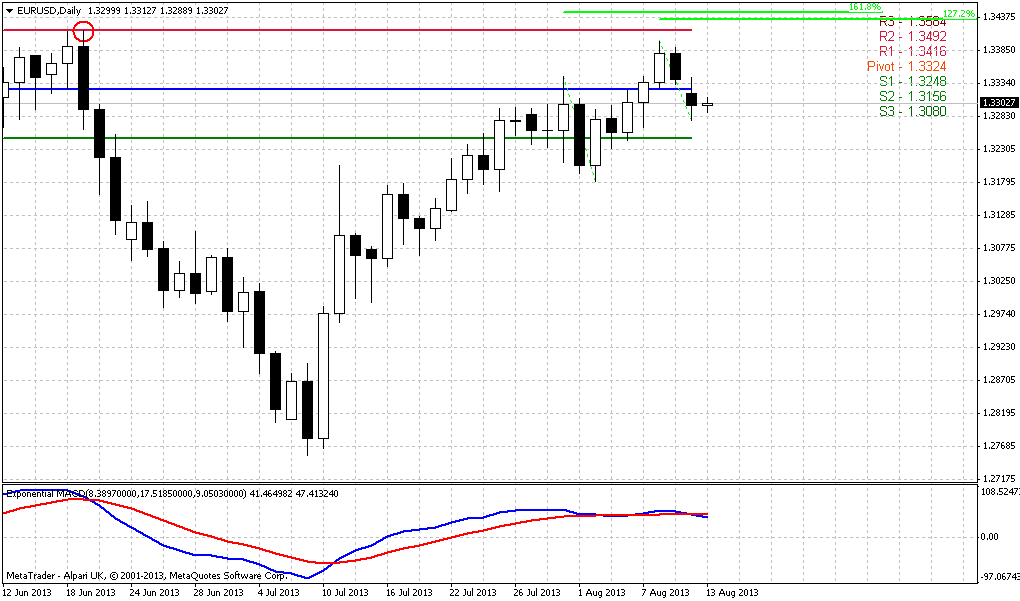
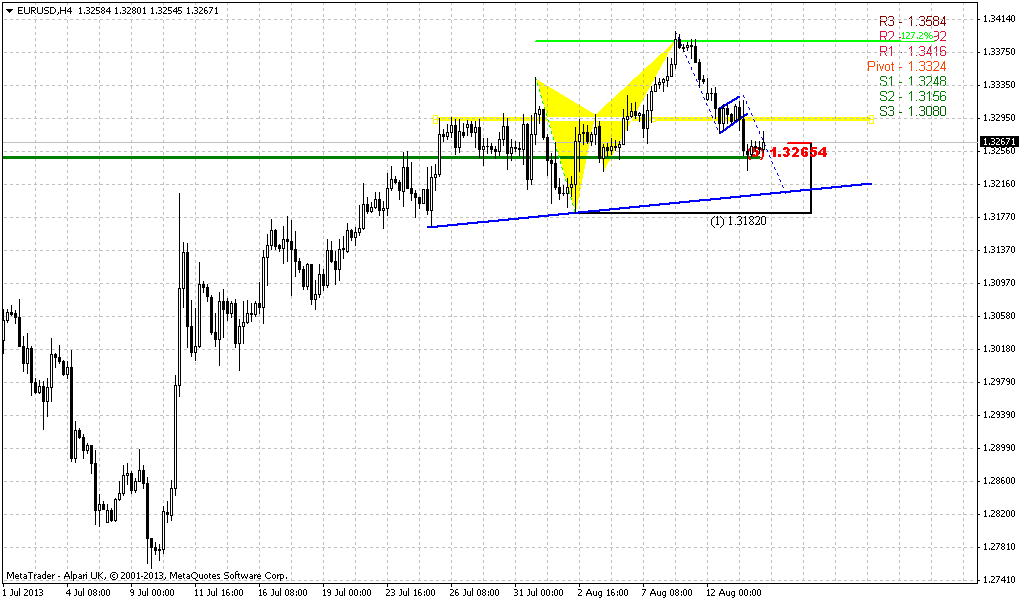
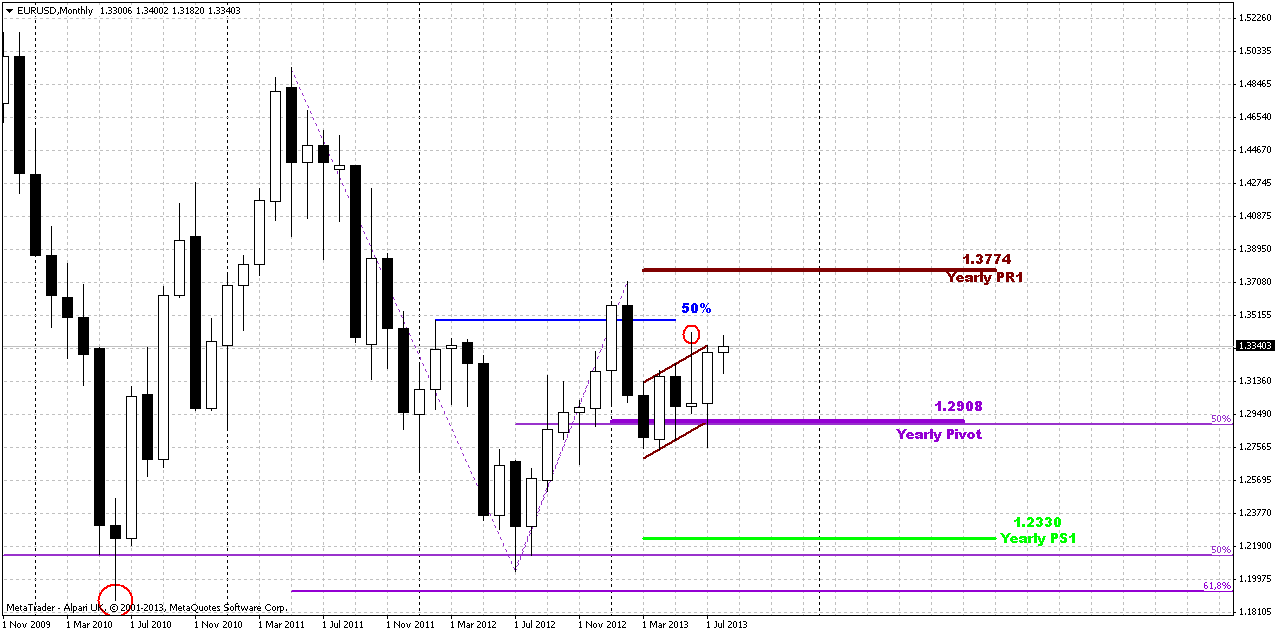
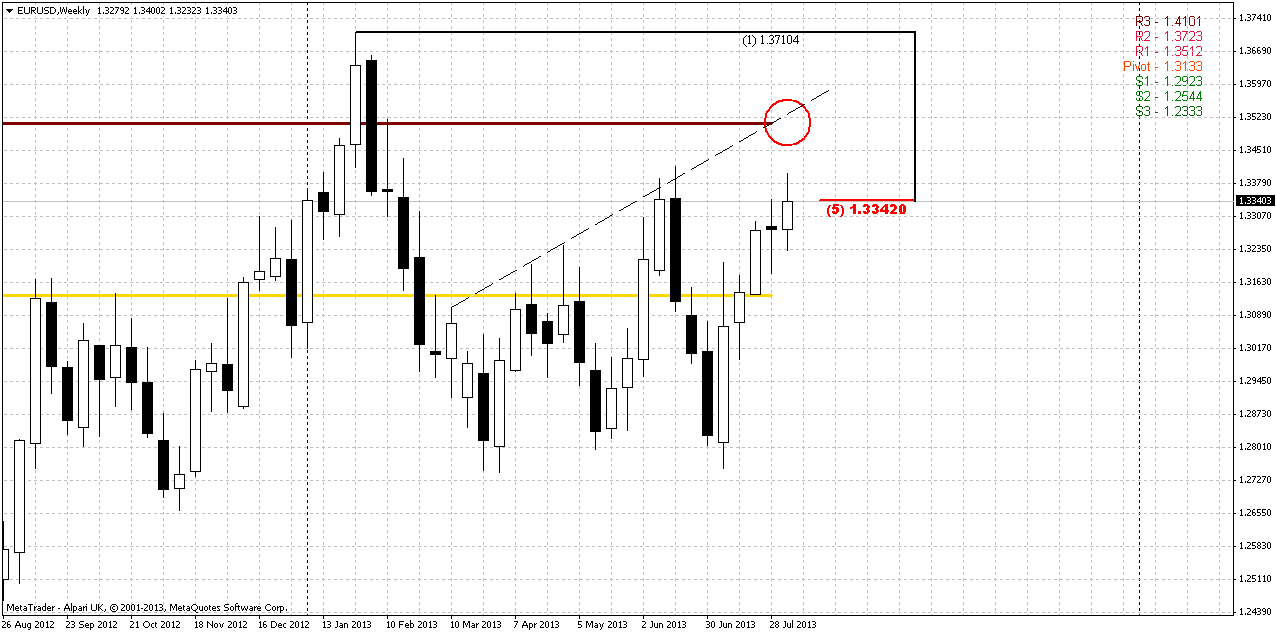
Previously we have discussed in details possible scenarios and why current price location is very important. At first glance it could be seen that here is nothing special and no big deal around, but in reality the oposite is true – it is a big deal around current level. Direction of real breakout of the flag pattern could set the direction of the market in long-term perspective. As you can see price action on passed week was not impressive, but market now stands slightly closer to previous highs. It is probably rather milestone sign that market is forming indecision pattern right around breakeven point of long-term sentiment, I mean yearly pivot point. It is very simbolical at current moment. Speaking about flag pattern itself, we already can find a lot of covert signs. For example, usually when price shows bullish trap action, i.e. fake upward breakout, in 90% of cases oposite real breakout follows. But what we see here? We see double failure. First it was bullish trap and then it was cancelled by bearish trap, since breakout down was also false and now is the question will real breakout up follow or not. We could think that as market has vanished bearish pattern – it must be strong bullish moment and may be this is true, especially because market still hold above yearly pivot. But we can ask – why this can’t happen again? Well may be it could, now we do not tell that we can estimate further direction from current messy action and do not even try to do this. we just want to indicate the current condition - action is really indecisive in big meaning of this word, since we see two fake breakouts around yearly pivot, that itself is a breakeven of yearly sentiment.
And market gradually becomes closer and closer to critical point – attempt to challenge previous highs and pretention on upward breakout. Probalby coming week will not become “that week”, but if market will continue as it stands – this is a question of 2-3 weeks probably, when price will reach the edge and we will undertsand whether we will get upward breakout or not.
Weekly
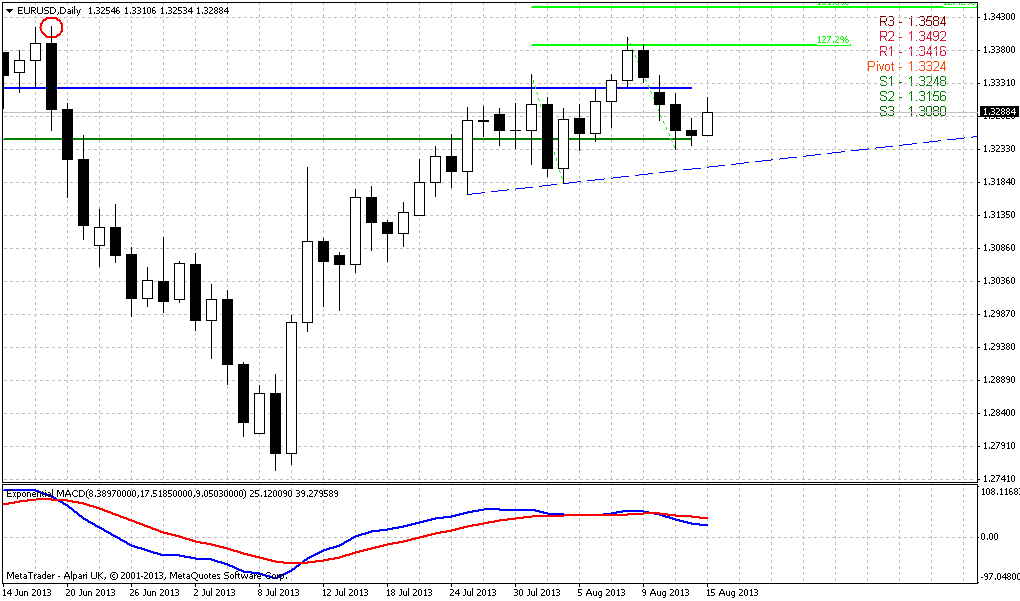
Well, trend holds bullish here, market not at overbought and price is tested 5/8 Fib resistance again. Also that was a WPR1. Market strongly stands above MPP and shows upward action 5 weeks in a row.
As we’ve discussed previously in current price action on weekly there are more bullish signs rather than bearish ones. This conclusion mostly comes from the way of market’s respect on 1.2750 support area. You probably remember that this level was a neckline of H&S pattern, 0.618 extension of AB-CD pattern, some fib level – in short it was solid support. Normal bearish development didn’t forbid a bounce from that area, but later market should return right back and pass through this support area. Bounce should not be too extended. But here market almost has reached the top of former right shoulder, price has erased bearish stop grabber pattern, that could not have come at a better time. Intially pretty looking H&S pattern has lost it’s harmony and now stands on the way to failure. We’ve suspected that since H&S was too obvious. But one deal is to suspect and quite different is to see that price is trying to destroy the pattern.
Now trend has turned bullish. Other words, market has vanished all bearish signs that were formed previously. That’s why something put me to think that bullish development is more probable here in nearest future, although technically we do have nothing except bullish engulfing pattern and bull trend. From the other side, I do not see any bearish issues right now at all. Next significant resistance, based on weekly is a crossing of MPR1 and trend resistance line – that is the border of megaphone pattern and it stands at 1.3512 area. If market will hold current pace up it could reach it within 1-2 weeks...
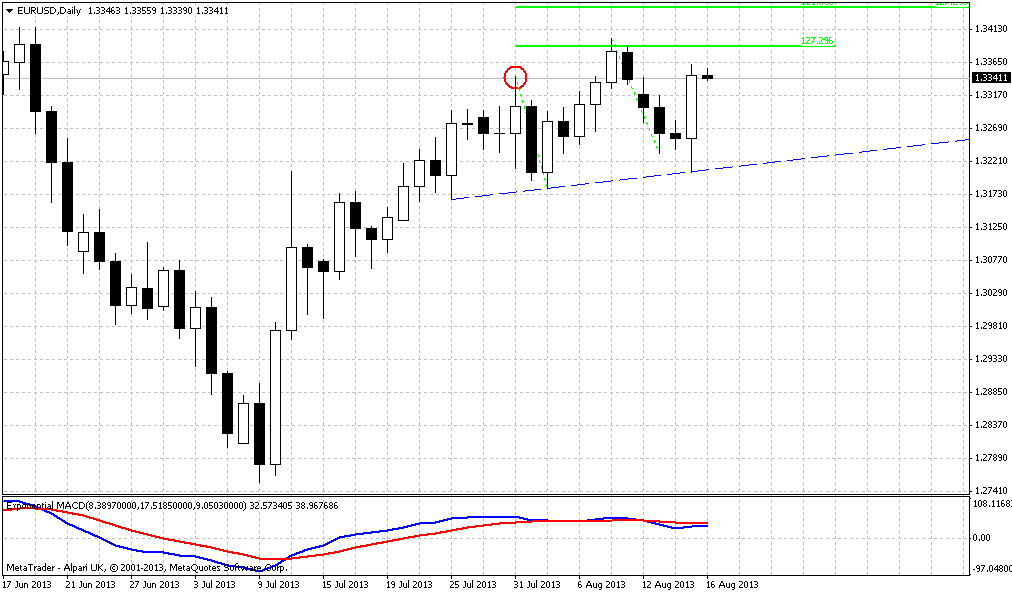
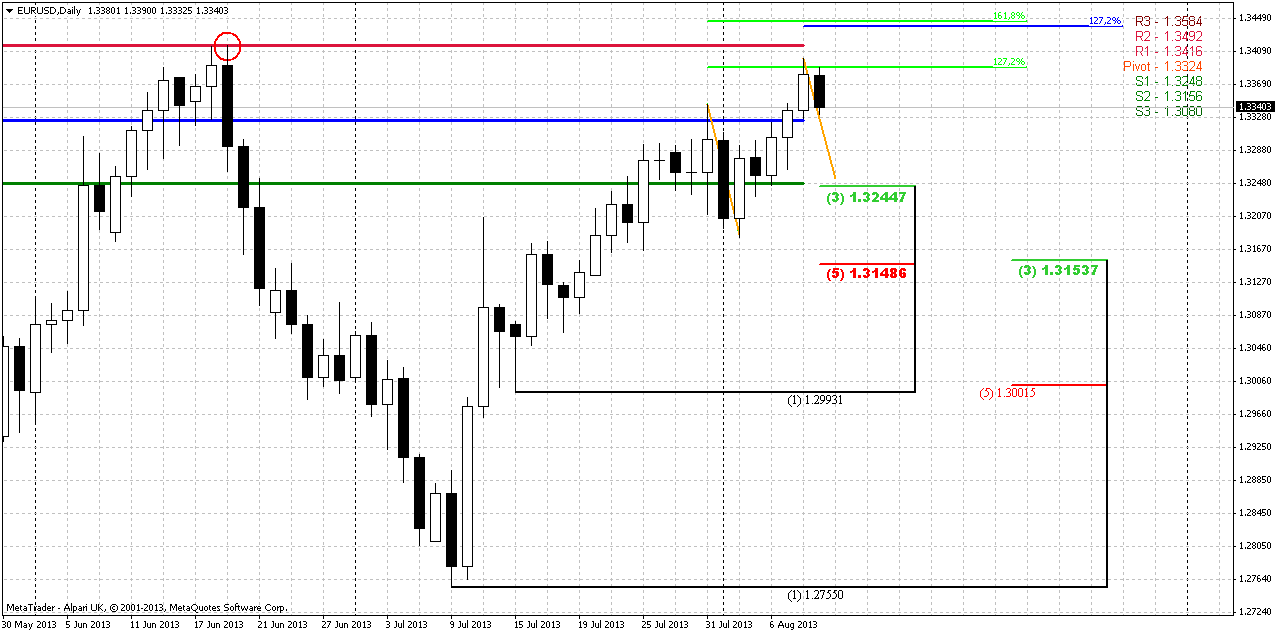
Daily
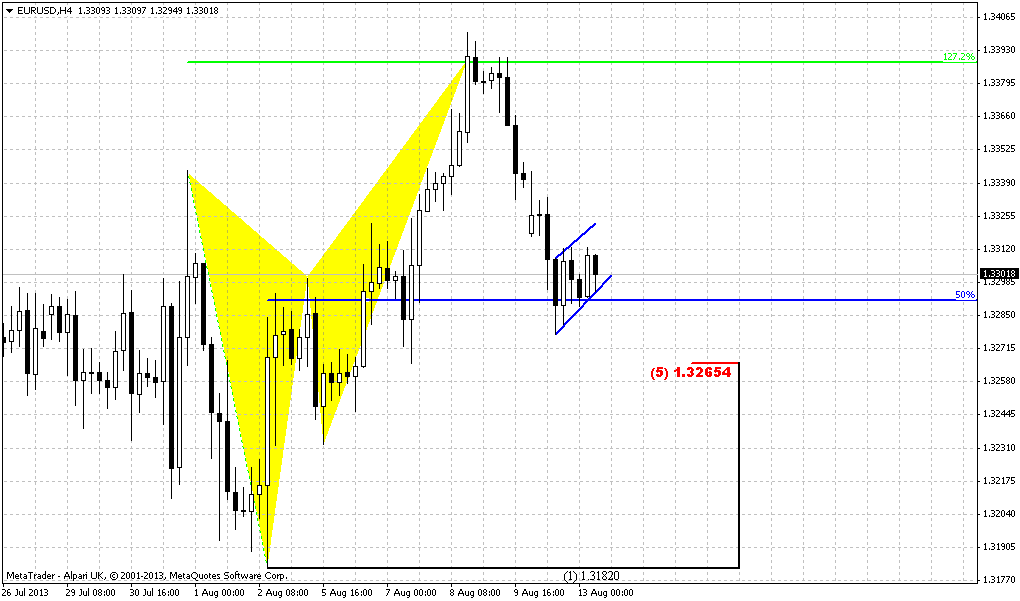
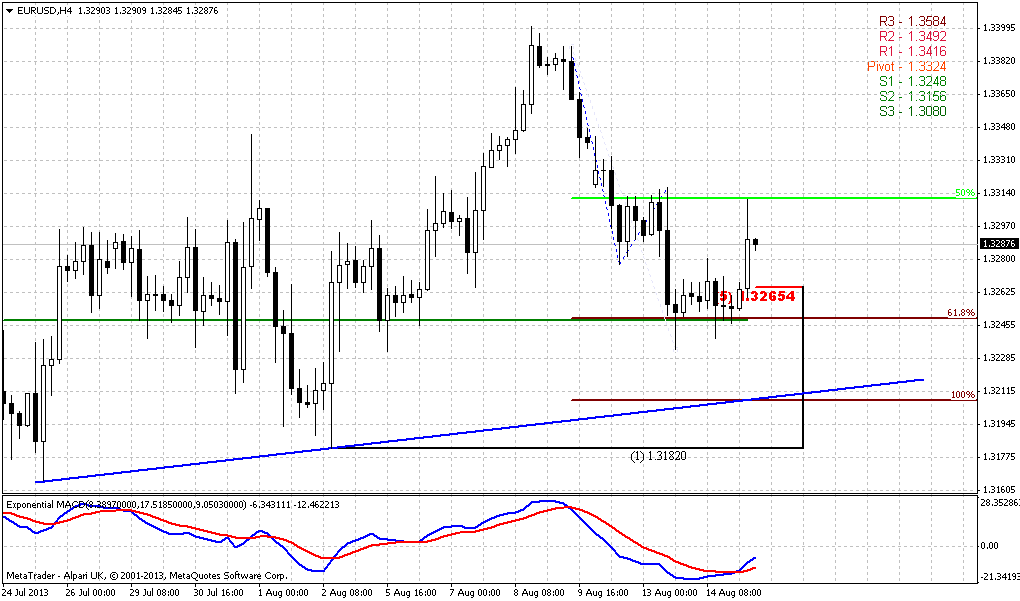
Well guys, situation on daily time frame looks really intriguing mostly because we stand near the significant highs. Very often market creates reversal patterns in such sort of areas and even oftener these patterns fail. I suspect that we could something of that sort on next week. Recall that current action up is a butterfly on 4-hour chart. On Friday we’ve said that some retracement probably will happen, since market has reached 1.27 extension and retracement truly has come. But since price was rather fast on a road to 1.27 target, this usually indicates further continuation to 1.618. If this will be really the case then butterfly could shift to 3-Drive “Sell” pattern when current retracement will finish. As you can see on the chart, to make this possibility real retracement should be to area around 1.3250 – Fib support and WPS1. But whatever will happen – whether it will be 3-Drive with retracement to 1.3250 or market just will continue move up to 1.618 butterfly – never mind. The most significant issue is the placement of 1.618 extension – 1.3445 area. Guys, that’s above previous highs. Since there are a lot of stops have been placed around – market has a lot of chances to just accelerate due stops’ triggering. In this case any reversal pattern could fail. That’s why it happens very often and we could become eyewitnesses of double scream of those who previously have place stops above these highs and those who will take shorts too early based on this possible reversal patterns. Another significant moment is that previous highs coincide with WPR1 and acceleration above it, standing above it will probably lead to further medium term appreciation.
Speaking about Monday-Tuesday, well, we almost have bearish engulfing pattern here, although Friday’s candle is inside one, but they are almost equal – I mean ranges of Thursday and Friday trading sessions. Thus we need to drop lower to understand what is going on there.
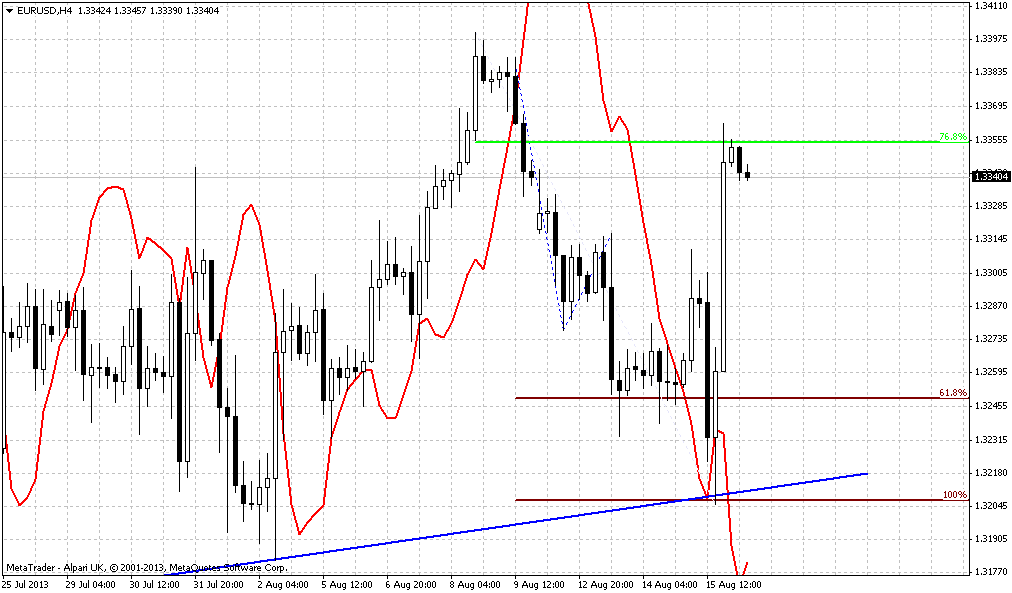
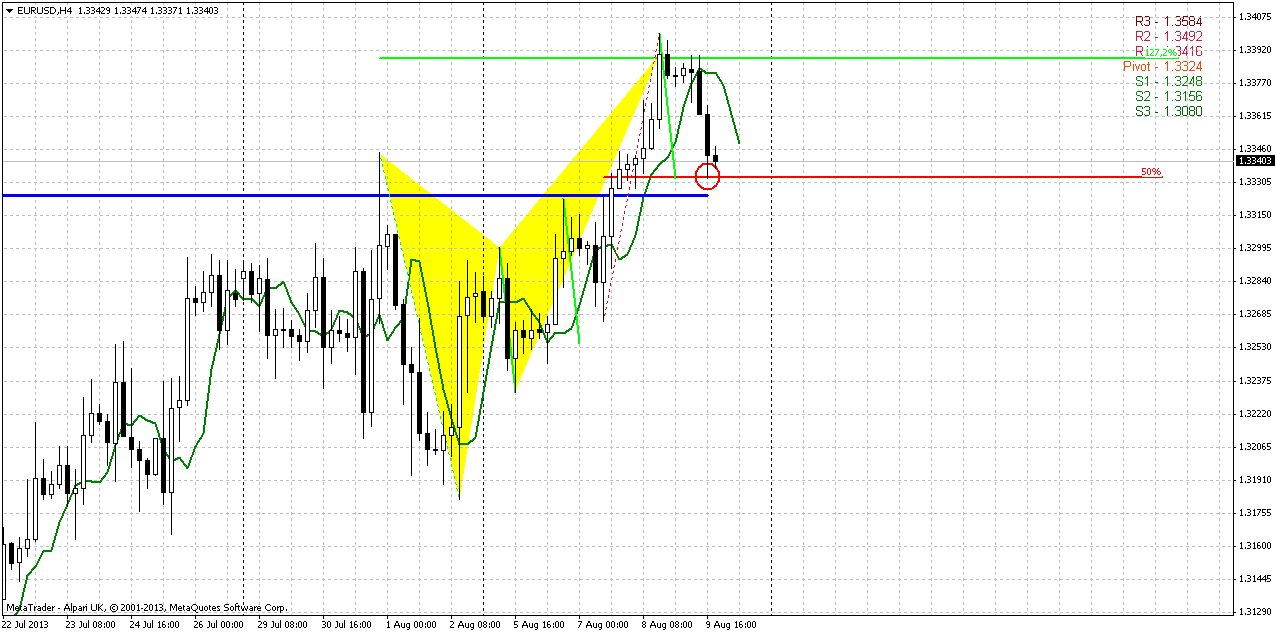
4-hour
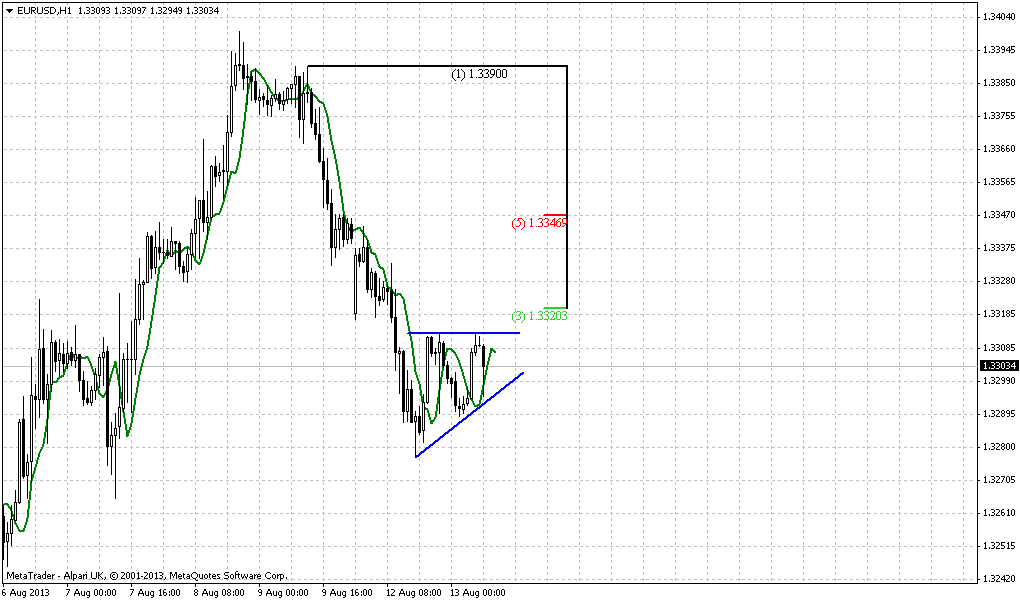
This is, guys our major chart for Monday. Retracement that we’ve expected has come and market has hit 50% support within 3 candles below 3x3 DMA. We know that EUR likes 50% level, still I can’t exclude that we will see some spike or open that will test WPP, since it stands rather close to current level.
Thus, here we have not bad context for B&B “Buy” trade. Currently it is difficult to say whether market will continue move streight right up, or we will turn to compound AB=CD retracement down, as we’ve discussed on daily. But who cares about it? This B&B is a great chance to take possition on possible upward breakout in advance of this event, and not when turmoil of breakout will be in progress. I like such kind of anticipation. If market will continue move higher right to 1.618 extension – we can keep our B&B-opened position and move stop to breakeven. If market will show just minor bounce up – well, we can take profit just from B&B trade and what will happen next.
And the last moment here... Besides of 50% support, WPP and previous swing high market also has accomplished harmonic retracement swing down – lime lines on the chart. As you can see it has made the same retracement twice already.
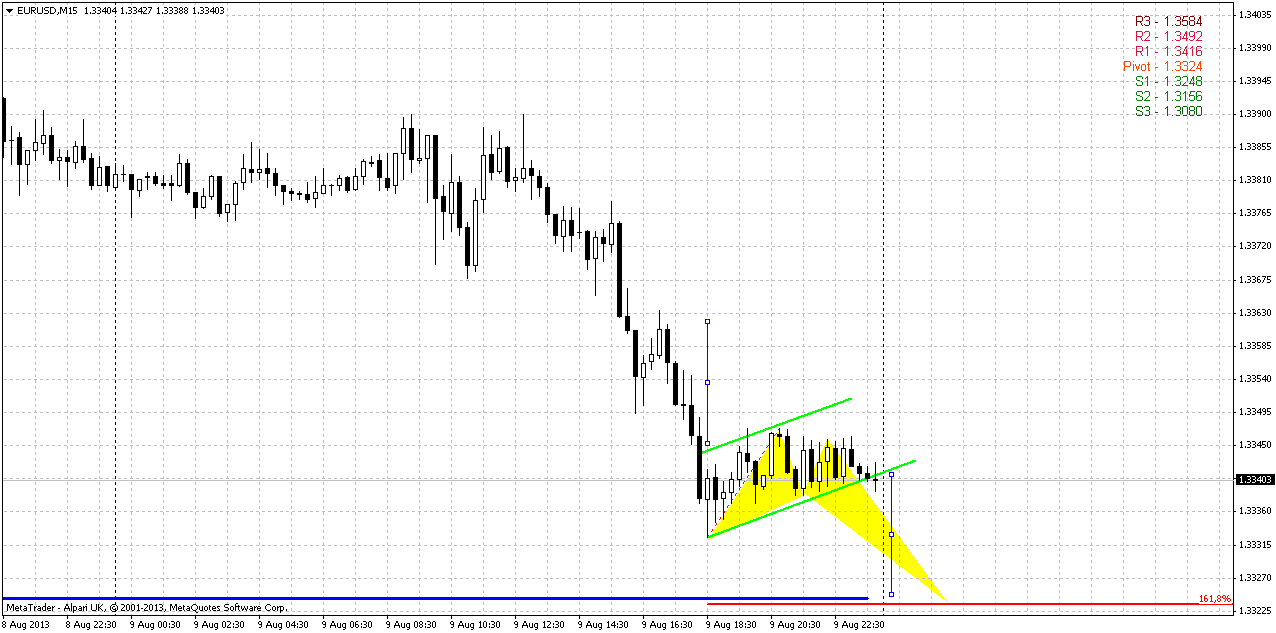
15-min
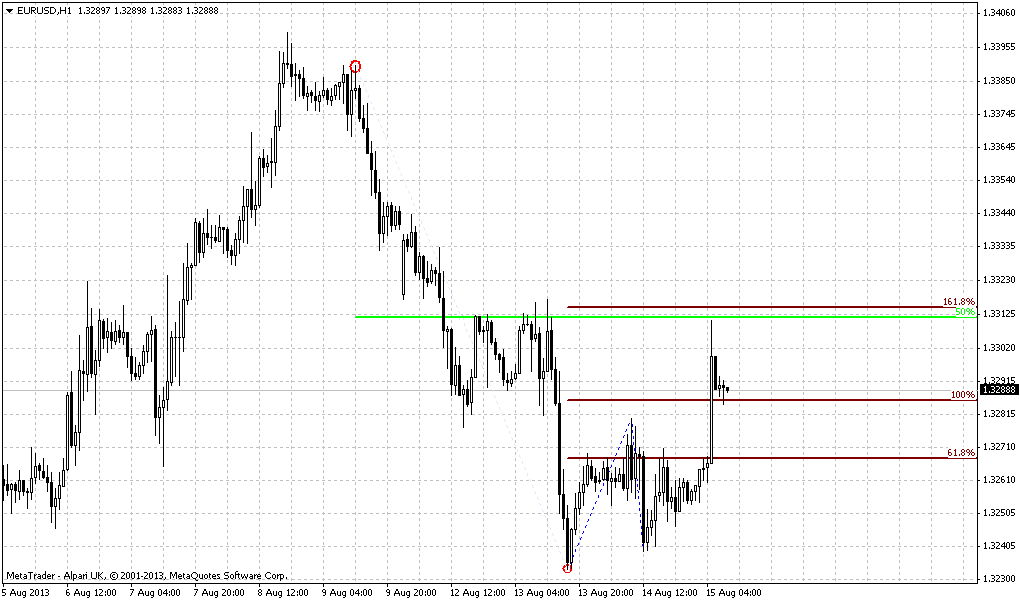
Today we will use 15-min charts, since on hourly recent price action looks like just flag pattern and we do not see other details. Usually, even when we deal with B&B it is prefferable to get some pattern on your side before enter this trade. Here we have two moments to watch for. As we’ve said, market probably will try to test WPP at open, since it stands rather close. The pattern that could appear here is 1.618 Butterlfy “buy” – its target stands right around WPP. Later it could become a part of reverse H&S - that is also possible, but this is not as important.
Second moment is – classical target of flag pattern equals to its mast and it points on the same area as butterfly. Thus our thought here – it makes sense to get pattern before taking position on B&B “Buy”.
Conclusion:
In long term perspective, market mostly still stands indecision, because is coiling around long-term sentiment breakeven point – yearly pivot. To point on direction price has to show break – out from current range. Until this will happen we can’t take sequence of trades in any direction. All that we can do in such environment is to search short-term clear setups and trade them fast. Although we can’t miss existence of slow but gradual move to the upside.
In short-term perspective we need to take position in advance of possible breakout up. B&B “Buy” setup lets us to do this, if we will get reversal pattern on 15-min chart.
The technical portion of Sive's analysis owes a great deal to Joe DiNapoli's methods, and uses a number of Joe's proprietary indicators. Please note that Sive's analysis is his own view of the market and is not endorsed by Joe DiNapoli or any related companies.
Previously we have discussed in details possible scenarios and why current price location is very important. At first glance it could be seen that here is nothing special and no big deal around, but in reality the oposite is true – it is a big deal around current level. Direction of real breakout of the flag pattern could set the direction of the market in long-term perspective. As you can see price action on passed week was not impressive, but market now stands slightly closer to previous highs. It is probably rather milestone sign that market is forming indecision pattern right around breakeven point of long-term sentiment, I mean yearly pivot point. It is very simbolical at current moment. Speaking about flag pattern itself, we already can find a lot of covert signs. For example, usually when price shows bullish trap action, i.e. fake upward breakout, in 90% of cases oposite real breakout follows. But what we see here? We see double failure. First it was bullish trap and then it was cancelled by bearish trap, since breakout down was also false and now is the question will real breakout up follow or not. We could think that as market has vanished bearish pattern – it must be strong bullish moment and may be this is true, especially because market still hold above yearly pivot. But we can ask – why this can’t happen again? Well may be it could, now we do not tell that we can estimate further direction from current messy action and do not even try to do this. we just want to indicate the current condition - action is really indecisive in big meaning of this word, since we see two fake breakouts around yearly pivot, that itself is a breakeven of yearly sentiment.
And market gradually becomes closer and closer to critical point – attempt to challenge previous highs and pretention on upward breakout. Probalby coming week will not become “that week”, but if market will continue as it stands – this is a question of 2-3 weeks probably, when price will reach the edge and we will undertsand whether we will get upward breakout or not.
Weekly
Well, trend holds bullish here, market not at overbought and price is tested 5/8 Fib resistance again. Also that was a WPR1. Market strongly stands above MPP and shows upward action 5 weeks in a row.
As we’ve discussed previously in current price action on weekly there are more bullish signs rather than bearish ones. This conclusion mostly comes from the way of market’s respect on 1.2750 support area. You probably remember that this level was a neckline of H&S pattern, 0.618 extension of AB-CD pattern, some fib level – in short it was solid support. Normal bearish development didn’t forbid a bounce from that area, but later market should return right back and pass through this support area. Bounce should not be too extended. But here market almost has reached the top of former right shoulder, price has erased bearish stop grabber pattern, that could not have come at a better time. Intially pretty looking H&S pattern has lost it’s harmony and now stands on the way to failure. We’ve suspected that since H&S was too obvious. But one deal is to suspect and quite different is to see that price is trying to destroy the pattern.
Now trend has turned bullish. Other words, market has vanished all bearish signs that were formed previously. That’s why something put me to think that bullish development is more probable here in nearest future, although technically we do have nothing except bullish engulfing pattern and bull trend. From the other side, I do not see any bearish issues right now at all. Next significant resistance, based on weekly is a crossing of MPR1 and trend resistance line – that is the border of megaphone pattern and it stands at 1.3512 area. If market will hold current pace up it could reach it within 1-2 weeks...
Daily
Well guys, situation on daily time frame looks really intriguing mostly because we stand near the significant highs. Very often market creates reversal patterns in such sort of areas and even oftener these patterns fail. I suspect that we could something of that sort on next week. Recall that current action up is a butterfly on 4-hour chart. On Friday we’ve said that some retracement probably will happen, since market has reached 1.27 extension and retracement truly has come. But since price was rather fast on a road to 1.27 target, this usually indicates further continuation to 1.618. If this will be really the case then butterfly could shift to 3-Drive “Sell” pattern when current retracement will finish. As you can see on the chart, to make this possibility real retracement should be to area around 1.3250 – Fib support and WPS1. But whatever will happen – whether it will be 3-Drive with retracement to 1.3250 or market just will continue move up to 1.618 butterfly – never mind. The most significant issue is the placement of 1.618 extension – 1.3445 area. Guys, that’s above previous highs. Since there are a lot of stops have been placed around – market has a lot of chances to just accelerate due stops’ triggering. In this case any reversal pattern could fail. That’s why it happens very often and we could become eyewitnesses of double scream of those who previously have place stops above these highs and those who will take shorts too early based on this possible reversal patterns. Another significant moment is that previous highs coincide with WPR1 and acceleration above it, standing above it will probably lead to further medium term appreciation.
Speaking about Monday-Tuesday, well, we almost have bearish engulfing pattern here, although Friday’s candle is inside one, but they are almost equal – I mean ranges of Thursday and Friday trading sessions. Thus we need to drop lower to understand what is going on there.
4-hour
This is, guys our major chart for Monday. Retracement that we’ve expected has come and market has hit 50% support within 3 candles below 3x3 DMA. We know that EUR likes 50% level, still I can’t exclude that we will see some spike or open that will test WPP, since it stands rather close to current level.
Thus, here we have not bad context for B&B “Buy” trade. Currently it is difficult to say whether market will continue move streight right up, or we will turn to compound AB=CD retracement down, as we’ve discussed on daily. But who cares about it? This B&B is a great chance to take possition on possible upward breakout in advance of this event, and not when turmoil of breakout will be in progress. I like such kind of anticipation. If market will continue move higher right to 1.618 extension – we can keep our B&B-opened position and move stop to breakeven. If market will show just minor bounce up – well, we can take profit just from B&B trade and what will happen next.
And the last moment here... Besides of 50% support, WPP and previous swing high market also has accomplished harmonic retracement swing down – lime lines on the chart. As you can see it has made the same retracement twice already.
15-min
Today we will use 15-min charts, since on hourly recent price action looks like just flag pattern and we do not see other details. Usually, even when we deal with B&B it is prefferable to get some pattern on your side before enter this trade. Here we have two moments to watch for. As we’ve said, market probably will try to test WPP at open, since it stands rather close. The pattern that could appear here is 1.618 Butterlfy “buy” – its target stands right around WPP. Later it could become a part of reverse H&S - that is also possible, but this is not as important.
Second moment is – classical target of flag pattern equals to its mast and it points on the same area as butterfly. Thus our thought here – it makes sense to get pattern before taking position on B&B “Buy”.
Conclusion:
In long term perspective, market mostly still stands indecision, because is coiling around long-term sentiment breakeven point – yearly pivot. To point on direction price has to show break – out from current range. Until this will happen we can’t take sequence of trades in any direction. All that we can do in such environment is to search short-term clear setups and trade them fast. Although we can’t miss existence of slow but gradual move to the upside.
In short-term perspective we need to take position in advance of possible breakout up. B&B “Buy” setup lets us to do this, if we will get reversal pattern on 15-min chart.
The technical portion of Sive's analysis owes a great deal to Joe DiNapoli's methods, and uses a number of Joe's proprietary indicators. Please note that Sive's analysis is his own view of the market and is not endorsed by Joe DiNapoli or any related companies.