Sive Morten
Special Consultant to the FPA
- Messages
- 18,673
Monthly
As Reuters reports the dollar rose against the yen on Friday after stronger-than-expected U.S. jobs data raised chances the Federal Reserve may start paring its bond buying program sooner than expected. U.S. employers added 203,000 new jobs in November and the jobless rate fell to a five-year low of 7.0 percent, the Labor Department said. As we know the central bank has been buying $85 billion in Treasury and mortgage-backed bonds each month to hold long-term borrowing costs down in a bid to spur a stronger economic recovery. A reduction in these purchases would lift U.S. bond yields, boosting the dollar.
The dollar last traded 1 percent higher at 102.84 yen, its strongest daily gain since Nov. 21. It earlier hit a session peak of 102.96 yen, not far from a six-month high of 103.37 yen set earlier in the week. "A strong overall report, strong details as well. It keeps the December tapering risk alive from the Federal Reserve," said Richard Franulovich, senior currency strategist at Westpac in New York. Still, some analysts doubted the report was strong enough to push the Fed to move when policymakers meet on Dec. 17-18. Many said the central bank was still likely to hold off reducing its purchases until January or March to ensure the economy was on solid ground. "We feel this is consistent with material improvement as regards unemployment, however, we’ve seen no improvement yet in participation," said Michael Woolfolk, senior currency strategist at BNY Mellon in New York. "Non-farm payrolls number is probably not enough to persuade the Fed to taper in December. We still think the earliest they move is March."
Economists believe the Fed will probably not want to pull back on its stimulus before lawmakers on Capitol Hill strike a deal to fund the government. That could come as soon as next week, however. Congressional aides have said negotiators were down to the final details as they tried to close a deal. The dollar continues to be driven by equity markets rather than the fixed income market," said Sebastien Galy, foreign exchange strategist at Societe Generale in New York. "That is why the U.S. dollar and New Zealand dollar are rising even as the broad dollar is mixed," he said.
Currency speculators trimmed their bets in favor of the U.S. dollar in the latest week, according to data from the Commodity Futures Trading Commission and Thomson Reuters released on Friday. The value of the dollar's net long position slipped to $19.85 billion in the week ended Dec. 3, from $20.39 billion the week before. It was, however, the fifth straight week of long positions in the U.S. dollar. (The Reuters calculation for the aggregate U.S. dollar position is derived from net positions of International Monetary Market speculators in the yen, euro, British pound, Swiss franc, Canadian and Australian dollars.
Technical
I was thinking what pair to choose for today’s weekly research and have decided that JPY is most interesting right now. It does not mean that we ignore the EUR, but by taking a look at it I see that we still do not have any reversal pattern there. Thus we can wait a bit more and take a look at JPY meantime. Every time frame on JPY is very interesting right now. So let’s start from monthly, as usual.
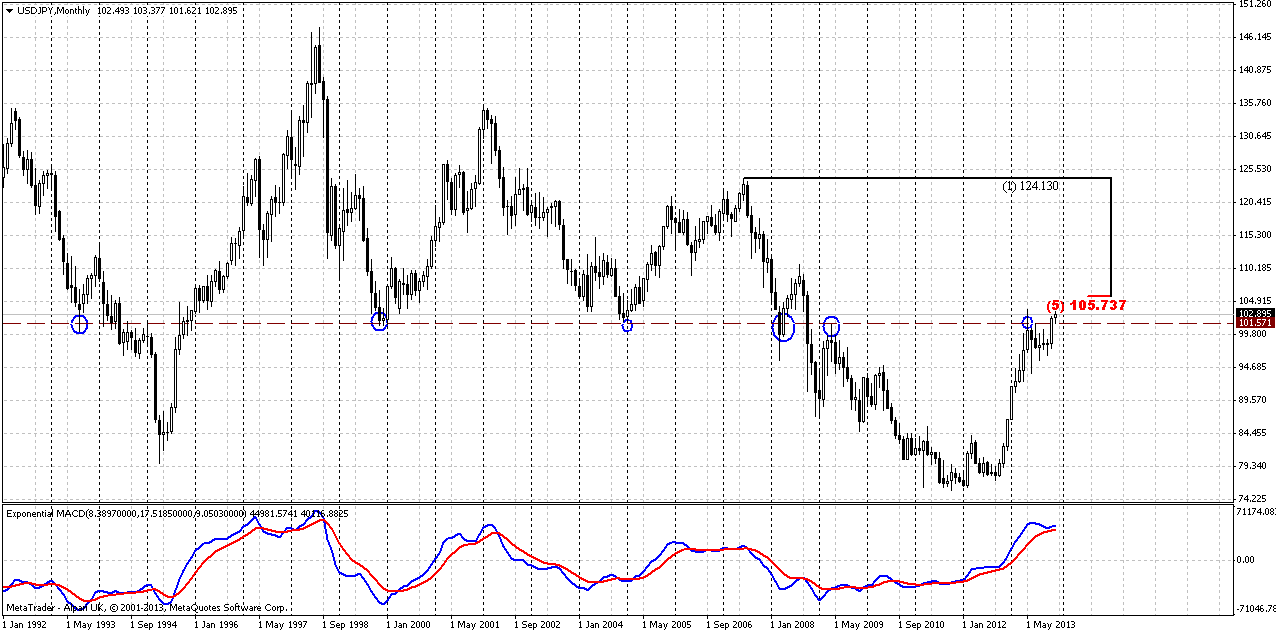
Let’s take a look at contracted JPY chart first. Here is some very tricky moment hidden and if you careful enough you could find him. First of all, we see that 101.50 area is long-term natural support/resistance line. Sometimes market has pierced it significantly but this line holds. Now we also see that on previous touch market has pierced it as well, but has not broken it. No price stands slightly higher than the line that I’ve drawn, but still lower than previous high. It means that market has not passed through this resistance yet, although at first glance it seems the opposite is true. Now I would ask you – what do you expect to happen when you have natural resistance line and slightly higher solid Fib resistance level? Will chances on true breakout of resistance be greater or smaller? Market could loss a lot of momentum on struggle against natural level and then it will meet Fib resistance. This situation starts to smell as possible W&R or even failure breakout. That’s why it’s very interesting. Anything could happen of cause, but if price will swamp and form some reversal pattern in 101.50-105.5 area this could trigger solid retracement down.
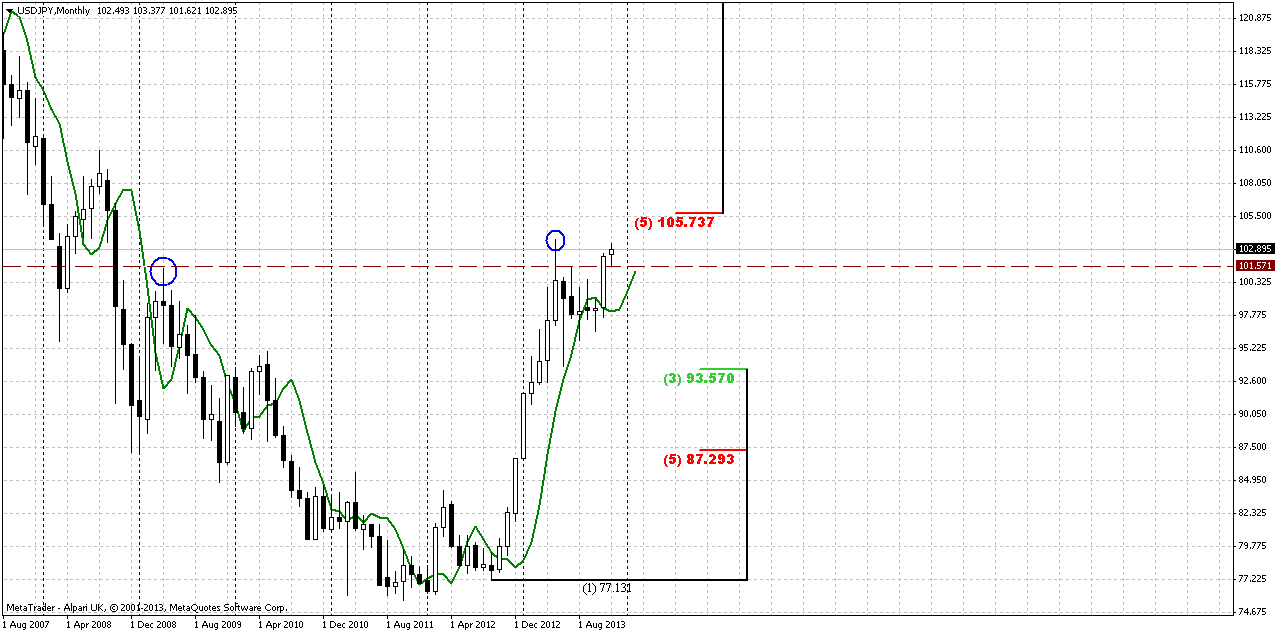
How definitely it could happen? Now let’s see on second monthly picture. Recent retracement down after first touch of 101.50 resistance has not quite reached 3/8 Fib support and it means that all bullish steam is still in the pot. This moment relatively was confirmed by November solid upward continuation. And one of possible patterns that could be formed here is DRPO “Sell”. 101.50 level is not as strong right now as it was at first challenge, thus market has not bad chances to pass through it but once it will happen, market immediately will meet solid 5/8 Fib resistance that has not been tested yet. And I’m not sure that market will have enough power to break it at the first touch. Simultaneously price will create higher top that is preferable for DRPO pattern. DRPO itself will assume retracement to 90 area at minimum. From technical point of view this possible deep retracement looks reasonable, since we have first upward bounce since 2006. So, as you can see situation on JPY is really thrilling and definitely worthy of our attention within nearest 2-3 months.
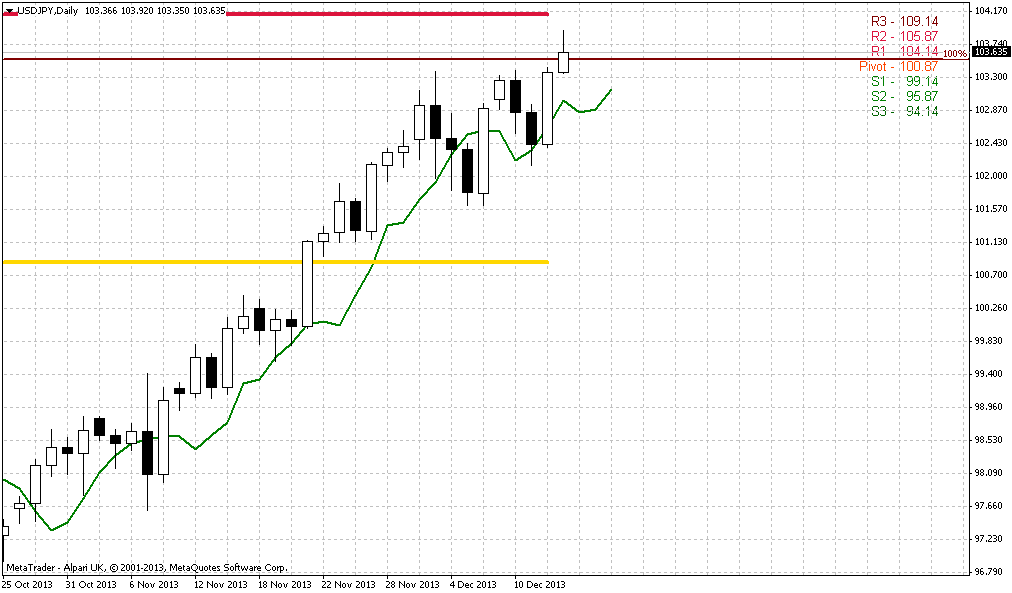
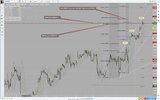
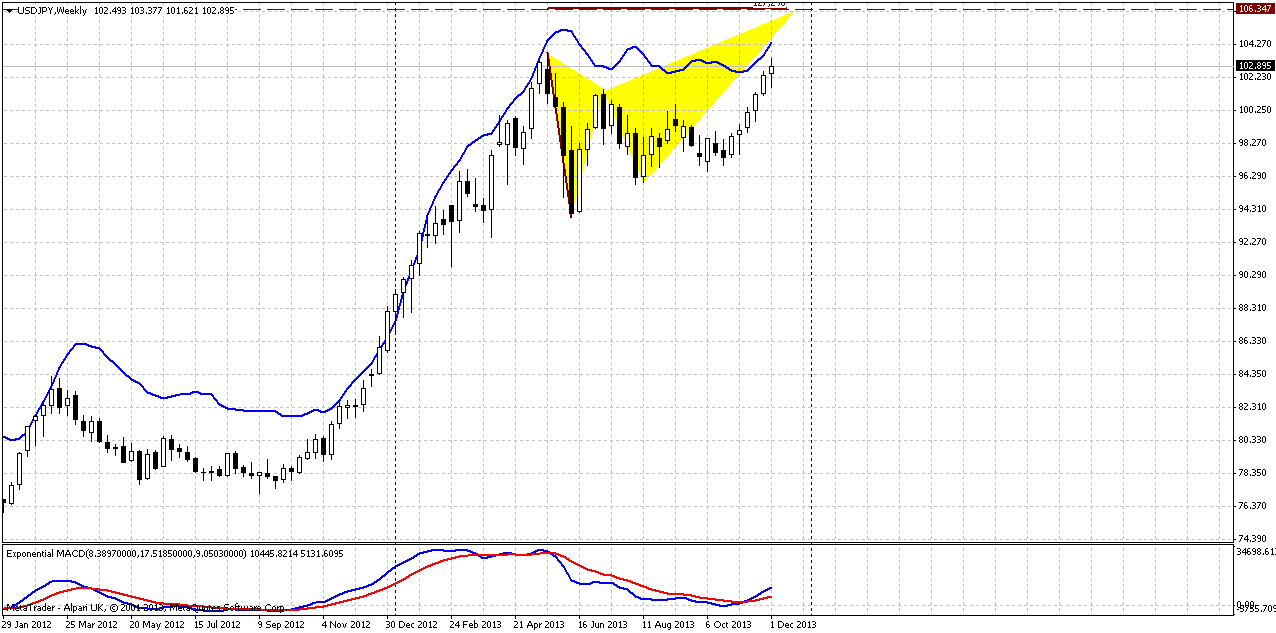
Weekly
Although weekly chart does not care any signal for immediate trading, overall picture here is important. Trend is bullish here, but market stands near weekly overbought. I’ve drawn a butterfly pattern here, but in general we can treat this just as extension of retracement that will create a resistance around 106.30 area. This is not curcial issue right now, since this level stands beyond overbought area but in perspective of 2-3 months it could become more important for our analsyis. May be market will shift to 1.27 H&S pattern that will be look like DRPO on monthly, since we know that butterfies very often become an initial part of H&S. That could give as big assistance as well, since we will be able to trade potential DRPO based on butterfly and not to wait confirmation of DRPO itself. We’ll see...
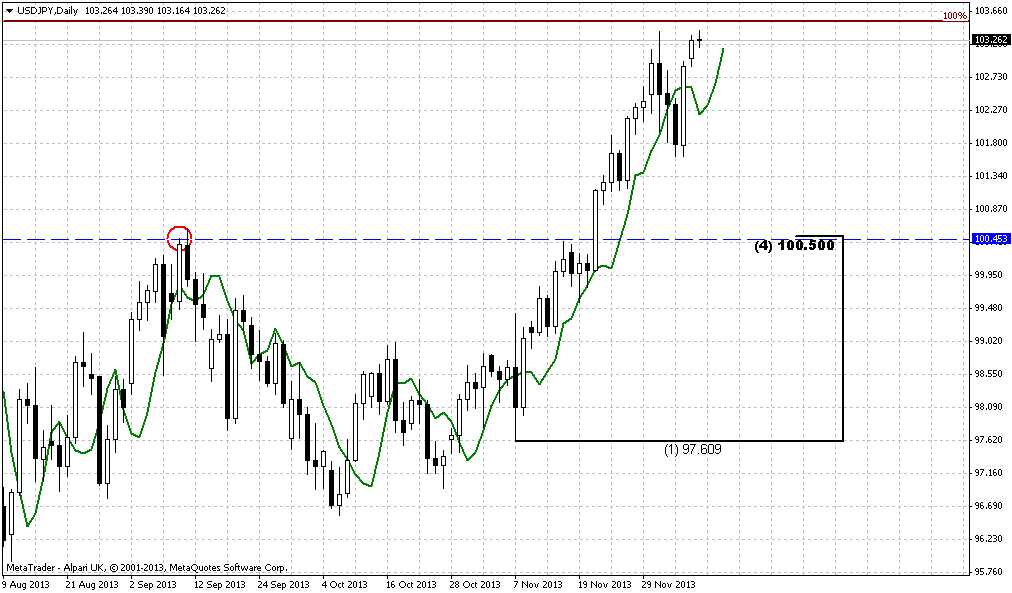
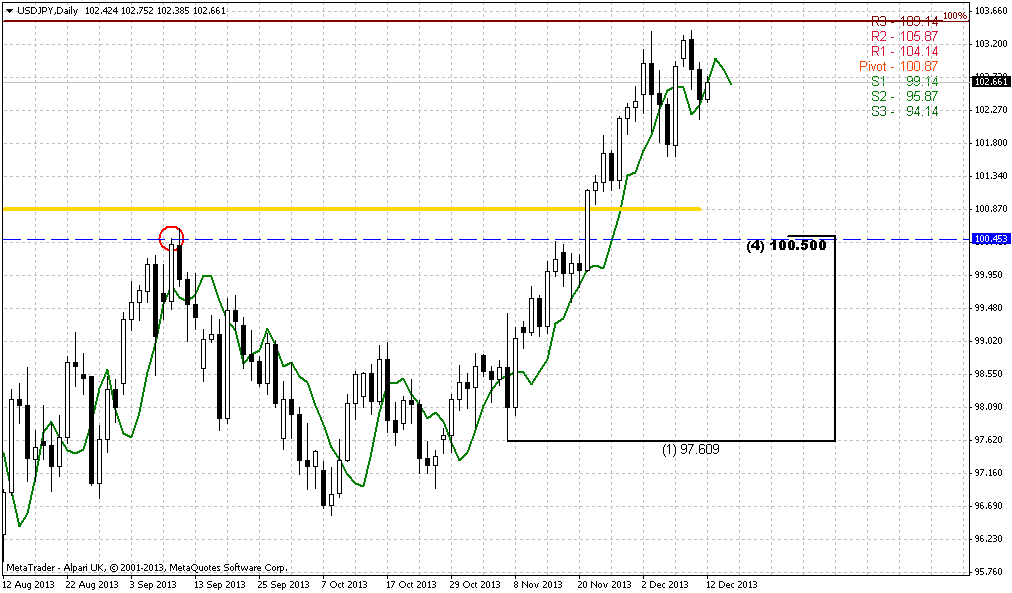
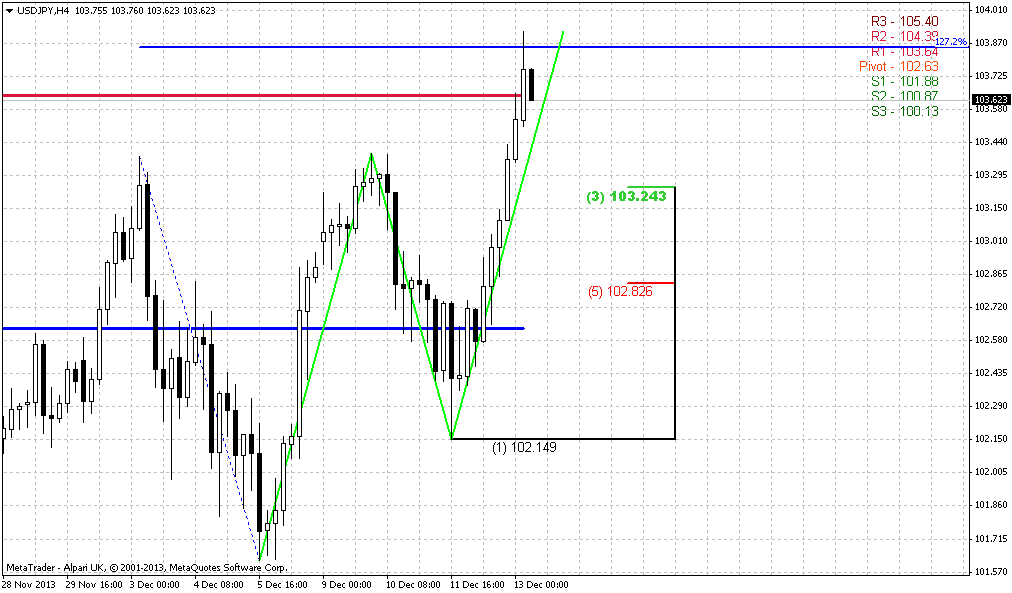
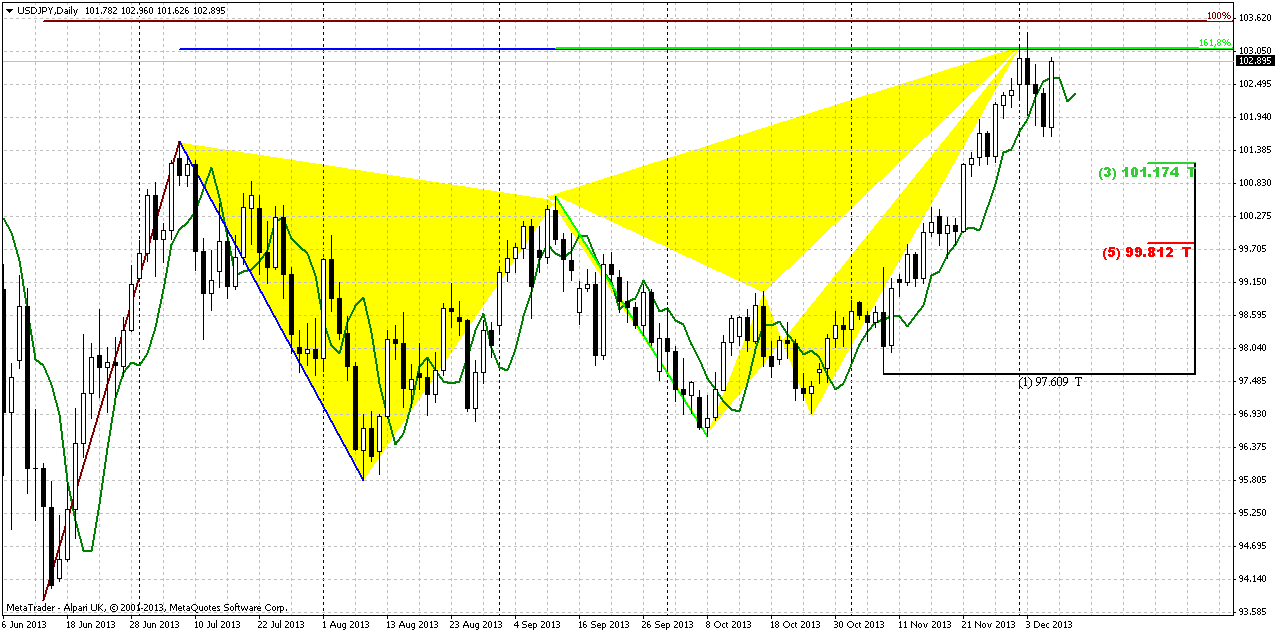
Daily
Daily chart carries its own solid trading setup. While it is a long way to 105.75 area still, in short term market could show a reaction on solid resistance cluster that we have here. Take a look – 2 different targets of different butterflies coincide at 103-103.10 area. Slightly higher, around 103.60 we have AB=CD target. All these stuff could be hit and respect triggered by DRPO “Sell” pattern again. As market has not reached even 101.17 Fib support level and continued move higher – we can’t count on B&B. Hence the only pattern that we could get here is DRPO “Sell” or… right, its failure, but anyway DRPO. Here is again nice chances to see greater second top of DRPO before any move down will start. Particularly this retracement (if it will happen, of cause) could become a basis for further upward run on monthly chart to 105.70 -106 area.
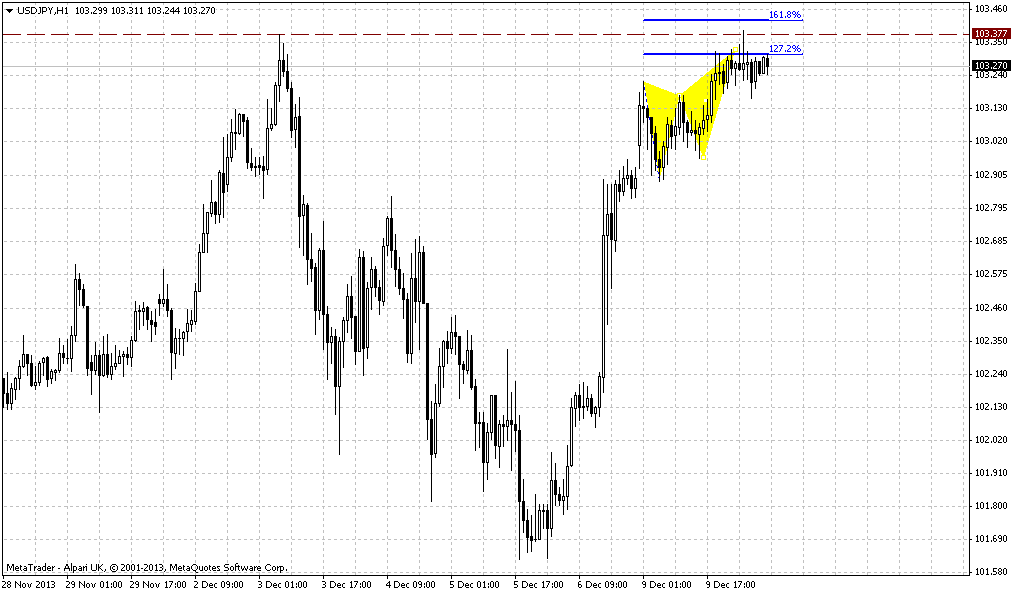
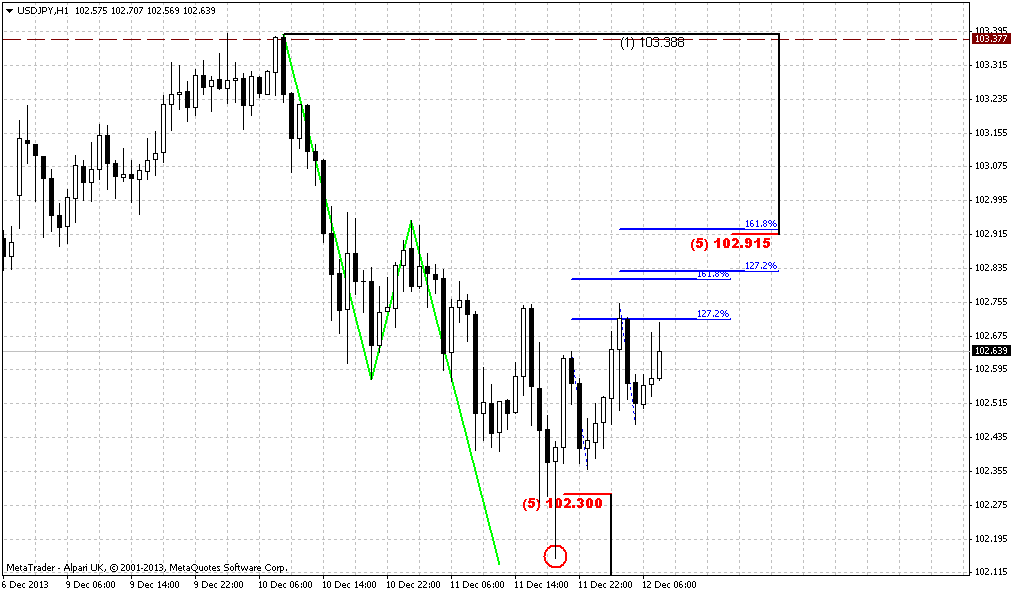
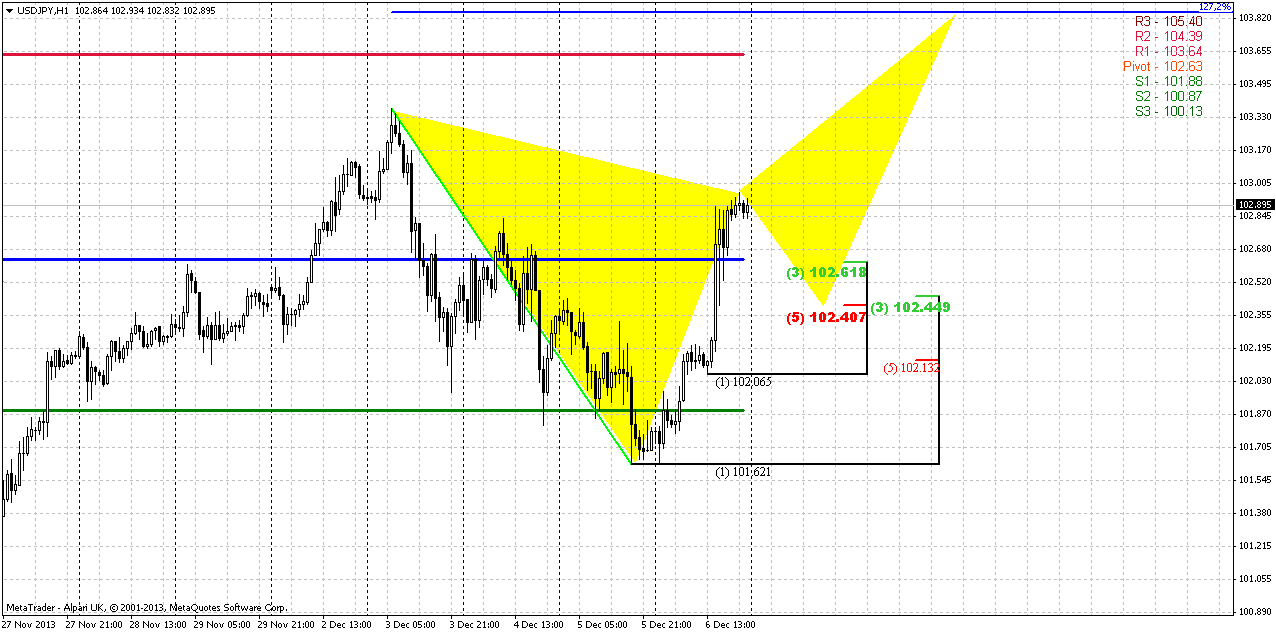
60-min
I do not know guys, how precisely market will continue move to daily 103.80 target, but dare to suggest that it should be some reversal pattern that is based on extension, since target stands above current price. Take a look that WPR1 coincides with this daily AB-CD target. For example, market could show butterfly “Sell” that has 1.27 extension 20 pips higher. If this pattern will be formed this will hit all targets on daily chart and could trigger a daily DRPO “Sell” that is what we want to see. In fact we’re not as interesting with upward continuation and how daily targets will be hit as with short entry based on daily pattern and in longer perspective – long entry with monthly upward continuation. Still may be situation on hourly chart will become useful for somebody.
Conclusion:
So, guys, I hope you‘re not confused and overloaded with multiple DRPO’s and butterflies almost on all time frames. To make understanding easier let’s structure consequences of events.
1. In long term perspective we expect possible continuation to 105.70 area – major 5/8 Fib resistance on monthly chart and possible monthly DRPO “Sell” (or DRPO Failure – this is also possible) could become culmination of long-term setup. It could trigger move down to 90 area at minimum – 15 point on JPY. DRPO looks very probable by two reasons. First is existence side-by-side two solid resistance levels of different kind. Second – solid previous bearish momentum. Usually market shows deep retracement right after first swing up – and this is precisely what we see on monthly chart.
2. In shorter-term we have another resistance area that is based on daily patterns – 2 butterflies, WPR1 and AB=CD target. Respect to this area also could be triggered by daily DRPO pattern. Here we will try to trade it down first and then, use this retracement for long entry. It is very probable that if DRPO will take place, market will re-test 100.00 area.
So, as you can see potential is impressive on all time frames, but how it will be realized by the market – that’s the question.
The technical portion of Sive's analysis owes a great deal to Joe DiNapoli's methods, and uses a number of Joe's proprietary indicators. Please note that Sive's analysis is his own view of the market and is not endorsed by Joe DiNapoli or any related companies.
As Reuters reports the dollar rose against the yen on Friday after stronger-than-expected U.S. jobs data raised chances the Federal Reserve may start paring its bond buying program sooner than expected. U.S. employers added 203,000 new jobs in November and the jobless rate fell to a five-year low of 7.0 percent, the Labor Department said. As we know the central bank has been buying $85 billion in Treasury and mortgage-backed bonds each month to hold long-term borrowing costs down in a bid to spur a stronger economic recovery. A reduction in these purchases would lift U.S. bond yields, boosting the dollar.
The dollar last traded 1 percent higher at 102.84 yen, its strongest daily gain since Nov. 21. It earlier hit a session peak of 102.96 yen, not far from a six-month high of 103.37 yen set earlier in the week. "A strong overall report, strong details as well. It keeps the December tapering risk alive from the Federal Reserve," said Richard Franulovich, senior currency strategist at Westpac in New York. Still, some analysts doubted the report was strong enough to push the Fed to move when policymakers meet on Dec. 17-18. Many said the central bank was still likely to hold off reducing its purchases until January or March to ensure the economy was on solid ground. "We feel this is consistent with material improvement as regards unemployment, however, we’ve seen no improvement yet in participation," said Michael Woolfolk, senior currency strategist at BNY Mellon in New York. "Non-farm payrolls number is probably not enough to persuade the Fed to taper in December. We still think the earliest they move is March."
Economists believe the Fed will probably not want to pull back on its stimulus before lawmakers on Capitol Hill strike a deal to fund the government. That could come as soon as next week, however. Congressional aides have said negotiators were down to the final details as they tried to close a deal. The dollar continues to be driven by equity markets rather than the fixed income market," said Sebastien Galy, foreign exchange strategist at Societe Generale in New York. "That is why the U.S. dollar and New Zealand dollar are rising even as the broad dollar is mixed," he said.
Currency speculators trimmed their bets in favor of the U.S. dollar in the latest week, according to data from the Commodity Futures Trading Commission and Thomson Reuters released on Friday. The value of the dollar's net long position slipped to $19.85 billion in the week ended Dec. 3, from $20.39 billion the week before. It was, however, the fifth straight week of long positions in the U.S. dollar. (The Reuters calculation for the aggregate U.S. dollar position is derived from net positions of International Monetary Market speculators in the yen, euro, British pound, Swiss franc, Canadian and Australian dollars.
Technical
I was thinking what pair to choose for today’s weekly research and have decided that JPY is most interesting right now. It does not mean that we ignore the EUR, but by taking a look at it I see that we still do not have any reversal pattern there. Thus we can wait a bit more and take a look at JPY meantime. Every time frame on JPY is very interesting right now. So let’s start from monthly, as usual.
Let’s take a look at contracted JPY chart first. Here is some very tricky moment hidden and if you careful enough you could find him. First of all, we see that 101.50 area is long-term natural support/resistance line. Sometimes market has pierced it significantly but this line holds. Now we also see that on previous touch market has pierced it as well, but has not broken it. No price stands slightly higher than the line that I’ve drawn, but still lower than previous high. It means that market has not passed through this resistance yet, although at first glance it seems the opposite is true. Now I would ask you – what do you expect to happen when you have natural resistance line and slightly higher solid Fib resistance level? Will chances on true breakout of resistance be greater or smaller? Market could loss a lot of momentum on struggle against natural level and then it will meet Fib resistance. This situation starts to smell as possible W&R or even failure breakout. That’s why it’s very interesting. Anything could happen of cause, but if price will swamp and form some reversal pattern in 101.50-105.5 area this could trigger solid retracement down.
How definitely it could happen? Now let’s see on second monthly picture. Recent retracement down after first touch of 101.50 resistance has not quite reached 3/8 Fib support and it means that all bullish steam is still in the pot. This moment relatively was confirmed by November solid upward continuation. And one of possible patterns that could be formed here is DRPO “Sell”. 101.50 level is not as strong right now as it was at first challenge, thus market has not bad chances to pass through it but once it will happen, market immediately will meet solid 5/8 Fib resistance that has not been tested yet. And I’m not sure that market will have enough power to break it at the first touch. Simultaneously price will create higher top that is preferable for DRPO pattern. DRPO itself will assume retracement to 90 area at minimum. From technical point of view this possible deep retracement looks reasonable, since we have first upward bounce since 2006. So, as you can see situation on JPY is really thrilling and definitely worthy of our attention within nearest 2-3 months.
Weekly
Although weekly chart does not care any signal for immediate trading, overall picture here is important. Trend is bullish here, but market stands near weekly overbought. I’ve drawn a butterfly pattern here, but in general we can treat this just as extension of retracement that will create a resistance around 106.30 area. This is not curcial issue right now, since this level stands beyond overbought area but in perspective of 2-3 months it could become more important for our analsyis. May be market will shift to 1.27 H&S pattern that will be look like DRPO on monthly, since we know that butterfies very often become an initial part of H&S. That could give as big assistance as well, since we will be able to trade potential DRPO based on butterfly and not to wait confirmation of DRPO itself. We’ll see...
Daily
Daily chart carries its own solid trading setup. While it is a long way to 105.75 area still, in short term market could show a reaction on solid resistance cluster that we have here. Take a look – 2 different targets of different butterflies coincide at 103-103.10 area. Slightly higher, around 103.60 we have AB=CD target. All these stuff could be hit and respect triggered by DRPO “Sell” pattern again. As market has not reached even 101.17 Fib support level and continued move higher – we can’t count on B&B. Hence the only pattern that we could get here is DRPO “Sell” or… right, its failure, but anyway DRPO. Here is again nice chances to see greater second top of DRPO before any move down will start. Particularly this retracement (if it will happen, of cause) could become a basis for further upward run on monthly chart to 105.70 -106 area.
60-min
I do not know guys, how precisely market will continue move to daily 103.80 target, but dare to suggest that it should be some reversal pattern that is based on extension, since target stands above current price. Take a look that WPR1 coincides with this daily AB-CD target. For example, market could show butterfly “Sell” that has 1.27 extension 20 pips higher. If this pattern will be formed this will hit all targets on daily chart and could trigger a daily DRPO “Sell” that is what we want to see. In fact we’re not as interesting with upward continuation and how daily targets will be hit as with short entry based on daily pattern and in longer perspective – long entry with monthly upward continuation. Still may be situation on hourly chart will become useful for somebody.
Conclusion:
So, guys, I hope you‘re not confused and overloaded with multiple DRPO’s and butterflies almost on all time frames. To make understanding easier let’s structure consequences of events.
1. In long term perspective we expect possible continuation to 105.70 area – major 5/8 Fib resistance on monthly chart and possible monthly DRPO “Sell” (or DRPO Failure – this is also possible) could become culmination of long-term setup. It could trigger move down to 90 area at minimum – 15 point on JPY. DRPO looks very probable by two reasons. First is existence side-by-side two solid resistance levels of different kind. Second – solid previous bearish momentum. Usually market shows deep retracement right after first swing up – and this is precisely what we see on monthly chart.
2. In shorter-term we have another resistance area that is based on daily patterns – 2 butterflies, WPR1 and AB=CD target. Respect to this area also could be triggered by daily DRPO pattern. Here we will try to trade it down first and then, use this retracement for long entry. It is very probable that if DRPO will take place, market will re-test 100.00 area.
So, as you can see potential is impressive on all time frames, but how it will be realized by the market – that’s the question.
The technical portion of Sive's analysis owes a great deal to Joe DiNapoli's methods, and uses a number of Joe's proprietary indicators. Please note that Sive's analysis is his own view of the market and is not endorsed by Joe DiNapoli or any related companies.