sive
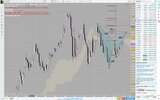
is it possible that we have a 3-drive SELL on H1? i attached the chart to show the levels hit. there are also 2 harmonic structures better visible on higher TFs (one of which some people call 'shark') all completing at key levels where price is currently coiling at MPR1.
forgot to add that if we look at the bollinger band std 2, we get 2 possibilities at this point:
1- spike up to DPR1 and trend line of upper channel, which will push price into standard deviation extreme also coinciding with fib projections from ABCDs (visible on the left in black) and this usually is followed by drop to mid bollinger line (yellow), or
2- we get drop from levels shown in chart as we have non-bullish candles already appearing right at MPR1, 3-drive SELL, 78.6% fib hit (not shown) from most recent daily top.
or am i imagining things?
i bet first target at daily pivot = 3675.
Your chartist uses FXCM data feed,I suppose; here my count is 5 waves impulse meanwhile Dukas has ending diagonal, both H4 TF, nicer seen. I shorted yesterday @1,3718. As I said in my previous post, whipsaw is possible but not neccessary.
Kiwi also hit 20 and now we will see.
Good trading!
ps: if I am right for gold and if euro will be in correlation, then whipsaw and new high on eurois probable and then ´only´1,3675 is possible target
Last edited:
 Good analysis Minimax bro .. you nailed it ..