Sive Morten
Special Consultant to the FPA
- Messages
- 18,796
Fundamentals
Reuters reports The U.S. dollar cut its losses against the euro, extended gains against the yen and reached an 11-year high against the Norwegian crown on plunging oil prices and stronger-than-expected U.S. economic data on Friday.
Oil prices fell to 5-1/2 year lows on concerns of a global glut, dampening inflation expectations. However, lower energy costs also increase the cash consumers have to spend heading into year-end holidays.
U.S. consumer sentiment rose to an eight-year high in December, above economists' forecasts, according to the Thomson Reuters/University of Michigan survey. The gain was fuelled by improved prospects for jobs and wages, while inflation expectations rose as well, bolstering the case for the U.S. Federal Reserve to raise interest rates next year.
"The implication here is this leads to a stronger dollar," said Steven Englander, global head of G10 foreign exchange strategy at CitiFX.
Englander said interest rate forecasts were low and what the Fed really cares about is not shaky equity markets but job creation, while inflation expectations are not as wobbly as previously thought.
"The fact that the Michigan inflation expectations bounced back is significant because it is the last pillar of the (Fed) doves, and even though we are not at full employment, we are approaching it fast," he said.
The Fed's two-day meeting next week ends with its interest rate decision, due on Wednesday.
"The data, especially the inflation component of the University of Michigan report, supports an incrementally more hawkish Fed and in this backdrop of softening growth in other major regions, an incrementally more hawkish Fed is positive for the dollar," said Brian Daingerfield, currency strategist at the Royal Bank of Scotland in Stamford, Connecticut.
Recent CFTC data shows drastical drop in speculative short positions. Although longs also has decreased but this reducing was in a row with weekly fluctuations. Besides, overall trend in long positions stands upside. Open interest also has dropped but mostly due the same short covering. This is very important transformation on EUR. Why investors have turned to closing shorts here? Do they not believe in USD appreciation any more? Or this is just profit taking at the end of the year? Here we have to return back to discussion of our idea – possible investors’ preparation for EU QE that should start in January. Still here is some lack of confirmation. The point is that to confirm our theory we need to see not just short covering, but long opening. We need to see that investors have started to accumulate EUR to put them later in EU assets, bonds and stocks. Otherwise current upside action will fade very soon. Only real inflow and demand for EU currency could support this trend for long period. This CFTC data stands on 9th of December. Let’s see what we will get on next week…
Open interest:
 Shorts:
 Longs:

Recently we’ve made wide comments on complex situation around EUR. As we’ve said previously EUR right now stands in center of geopolitical and economical turmoil and we have mutual 2-side relations EU-US and EU-Russia. And progress of these relations develops not very positive. Shortly speaking US freely gives the law to EU because de facto EU is not totally independent.
Economically US and EU drives on opposite courses. While US is tending to starting rate hiking cycle in mid 2015, ECB gives comments on QE and increasing of balance to the level of March 2012 and this assumes QE on approximately 3 Trln EUR.
This makes us think that EUR now stands under double pressure – EU pulls chestnuts out of the fire for US (in relation with Russia) and particularly due this action makes economical pit deeper. What could bit this sorrow?
As a result of blind or coercive following to US policy, EU meets problems with Russia, it’s 3rd largest trading partner. We suggest that situation will become worse, US will demand more and more sanctions from EU upon Russia. But in turn, economical situation EU-Russia stands in relation with geopolicy where US will not accept any compromises. Any ECB efforts on stabilizing of EU economy could be mitigated by new spiral of geopolitical tensions and painful sanctions. That’s why here is our conclusion – hardly real reversal on EUR is possible any time soon.
But the only one thing exists that could put short-term situation from top to bottom. And this thing is European QE. We already gave some hints on our daily updates on this subject. Here we operate such terms as “short-term” and “long-term”. As we have a habit to treat “short-term” as within a week, here we have to apply absolutely different scale, since right now we touch the sphere of economical policy and there is everything is “long-term”. That’s why I will give you example how correctly understand this.
Recent 2 years we saw QE in US. As result we’ve got huge bubble on stock market and other US assets. This we should treat as “short-term technical impact”. Why it is technical? Because recent huge growth of financial markets were driven not by real growth of economy and wealth of nation, but mostly due re-distribution of money flows. Thus Fed has injected trillions of dollars in financial system and have expected that banks and financial companies will put them in real sector as long-term loans that should support economy, increase job creating and wealth of people. May be some part of money really was applied as it should be, but most part was put in stock market. As a result, while QE functions, we’ve saw “technical short-term” impact as rally on stock market. Now about long-term… In long-term period we should get impact of real economical laws. QE somehow should impact US economy and not necessary that this impact will be positive. In reality nobody knows what will happen. Right now, as QE was closed, we stand just at the eve of new period.
Now, let’s back to EU. Why we think that drastical changes could happen on EUR? Probably you’ve got it already. As financial world already has seen the QE, how it works – investors understand that something of this kind will happen right now in EUR-zone. And this is “easy money”. Just put them in EU assets and wait while ECB will push market higher and higher with its liquidity. Why should QE fail in EU while it has worked in US? And this could change the picture for couple of years on EUR, at least till ECB will keep with QE. That’s why now we keep close eye on CFTC data. We already have first signs that relatively confirm our suspicions. But in the long-term perspective EUR really will remain under pressure. As soon as QE will be over, difference in rate policy between EU and US will start to dominate again and EUR could return back to decreasing. And again, guys, right now hardly somebody could imagine what result will follow from such huge QE programs, as in EU as in US. Short-term effect could be positive, but what will be with inflation? Who knows that it will remain at 2-3%?
Technicals
Monthly
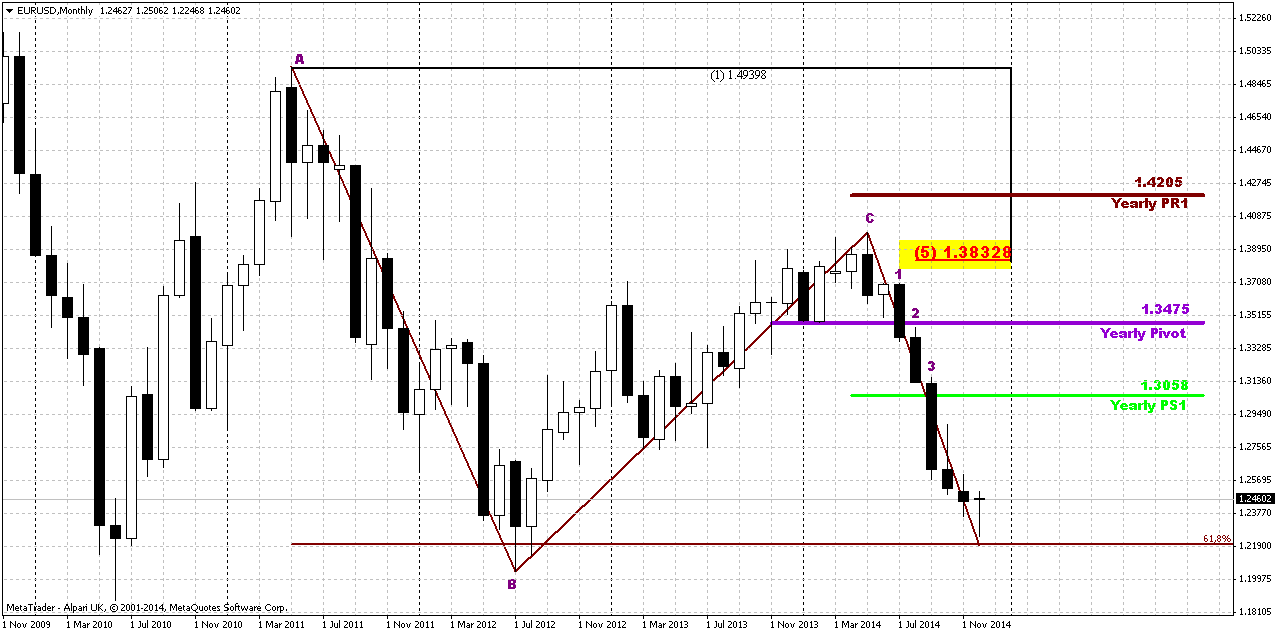
From technical point of view we have large Gartley “222” Sell pattern, it nearest target is 1.22 – 0.618 AB-CD objective point. Last week market has not reached target just for 46 pips. Legs of the pattern very harmonic, speed of CD and AB legs are almost equal. EUR looks really heavy; month by month it opens at the high close at the low. Currently we see some relief and it is difficult to predict when 1.22 target will be hit. This will depend on assets re-structuring procedure due QE but from pure technical approach odds suggest 1.22 target should be hit. It is too long EUR stands in downward action and bearish momentum is still strong. “Three black crows” pattern and breakout through Yearly Pivot Support 1 suggests that 1.22 could become no final target probably, and we should not surprise if we will see decline in next year as well. Only some structural shifts as QE could change situation or postpone downward action.
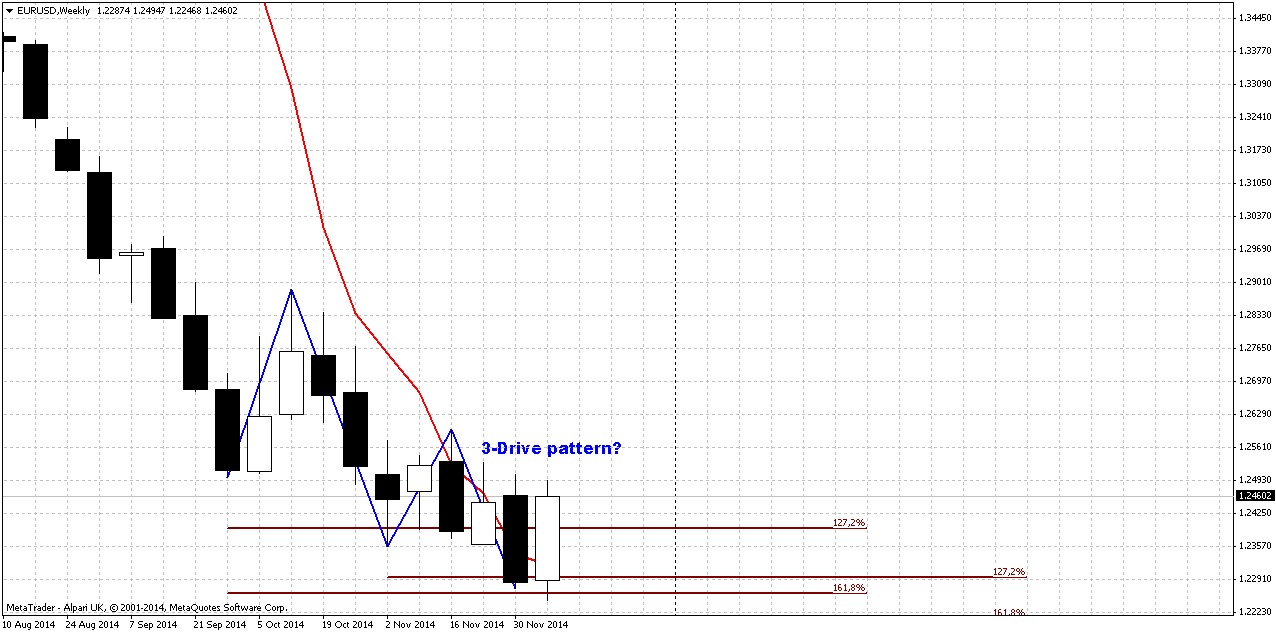
Weekly
Trend has turned bullish. Market has formed 3-Drive pattern and even nicely looking bullish engulfing pattern. This has happened when CFTC data shows solid change in market sentiment. Both patterns make really possible reaching of 1.26 area till the end of December. It is interesting that normal engulfing target approximately coincides with minimum target of 3-Drive.
On previous week market has erased all bearish reaction on NFP release and stands tight near MPP. It means that in short-term perspective we probably will stick with this engulfing pattern. Bearish sentiment could be re-established only if market will pass through current 1.2250 lows…
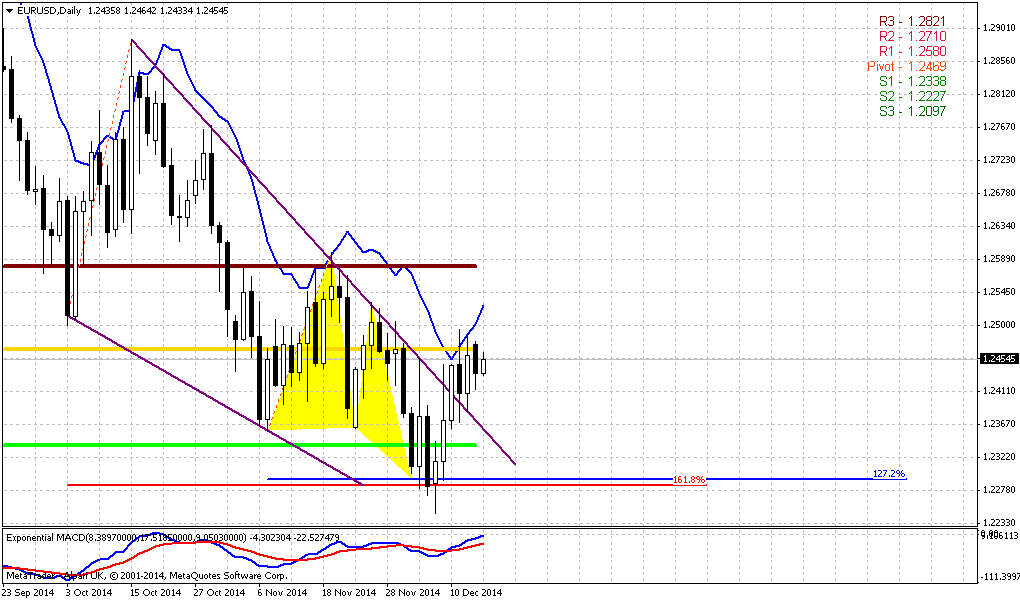
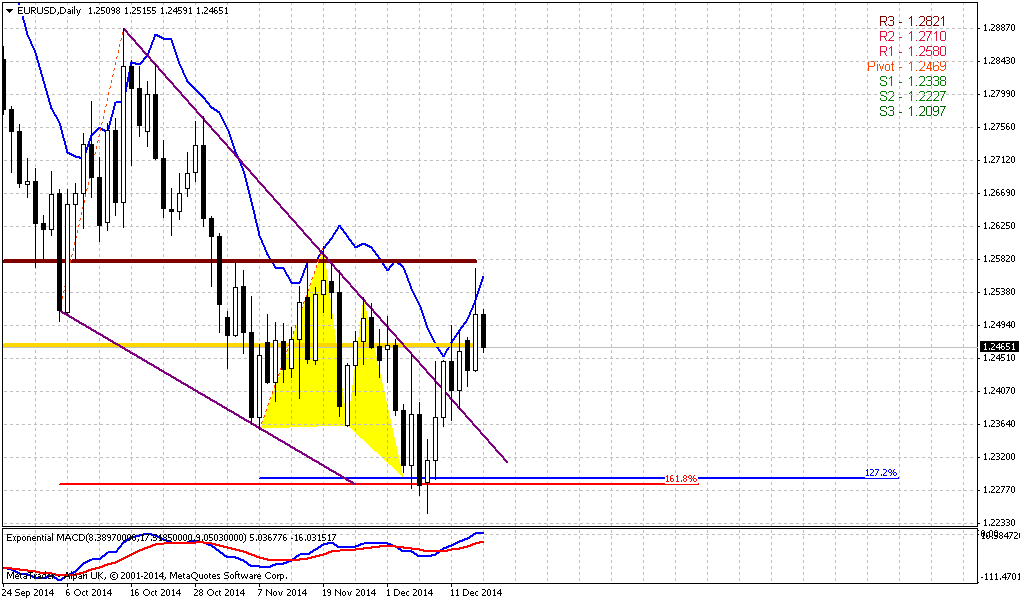
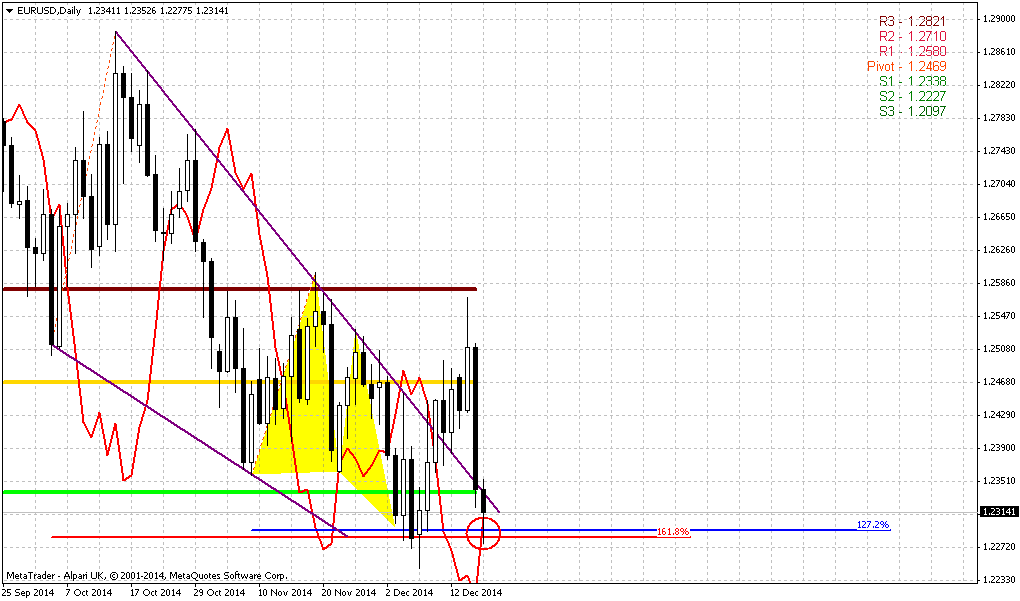
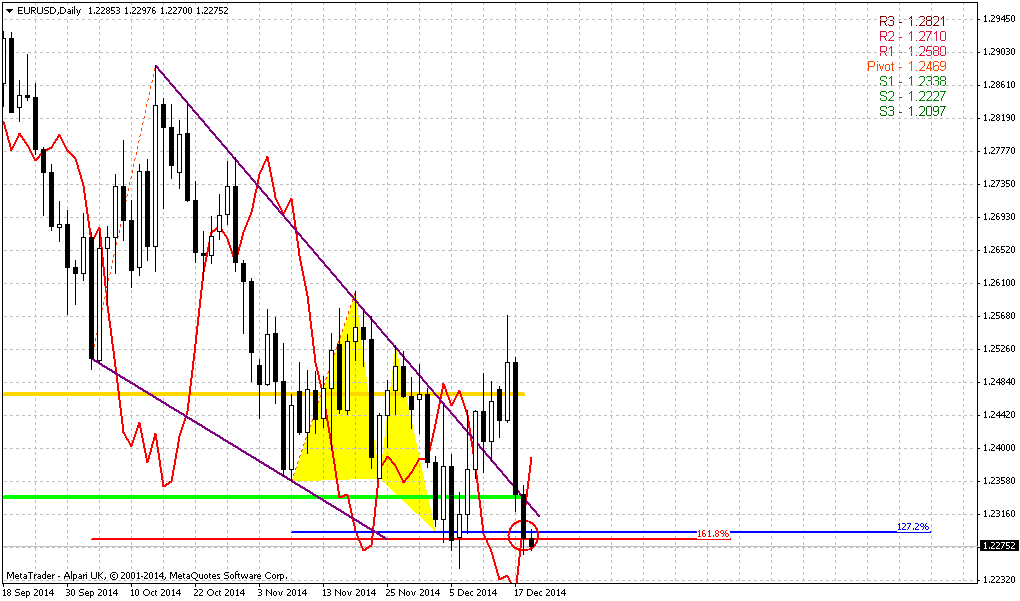
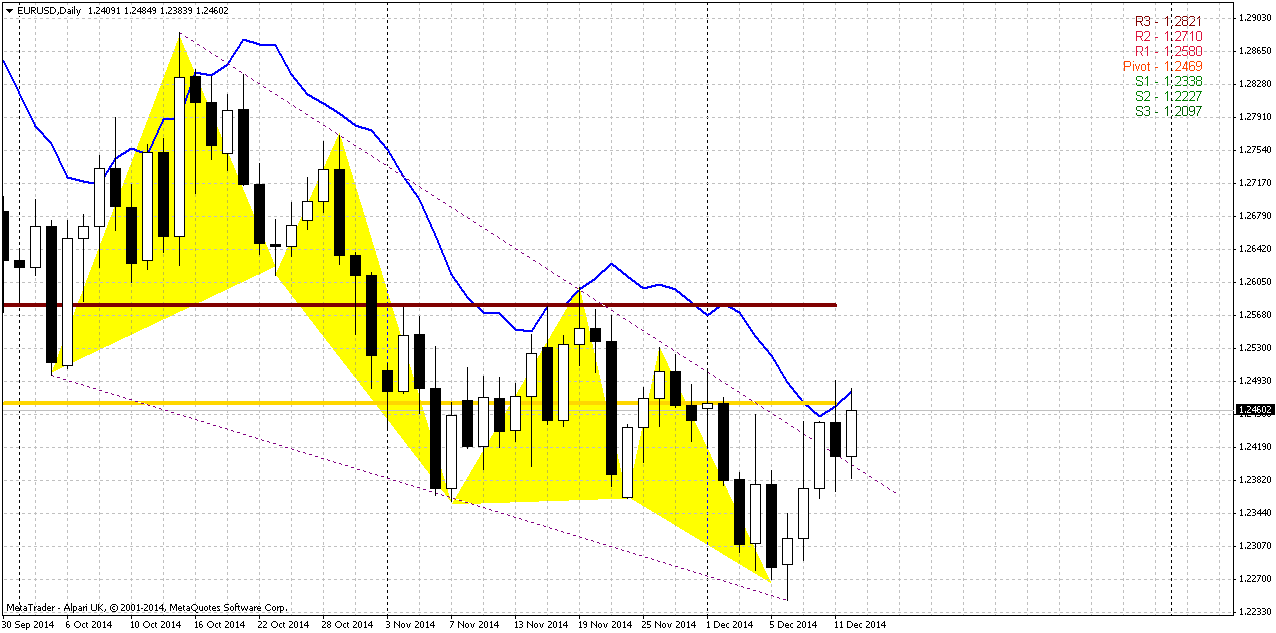
Daily
Daily chart provides not many details. Trend has turned bullish here. In fact, we have confirmation of patterns that we’ve discussed above. Still one major point stands here. Take a look how market coiling below MPP. In general this type of behavior is not typical for bearish market, especially for the market that has target 50 pips below current level. But as we’ve said structural asset shifting could distort normal technical behavior. Another bullish sign here is tight standing below MPP. Actually guys, it seems that only overbought holds EUR from moving above MPP and we probably will get confirmation of this on coming week. Take a look how market just creeps with overbought higher without retracement.
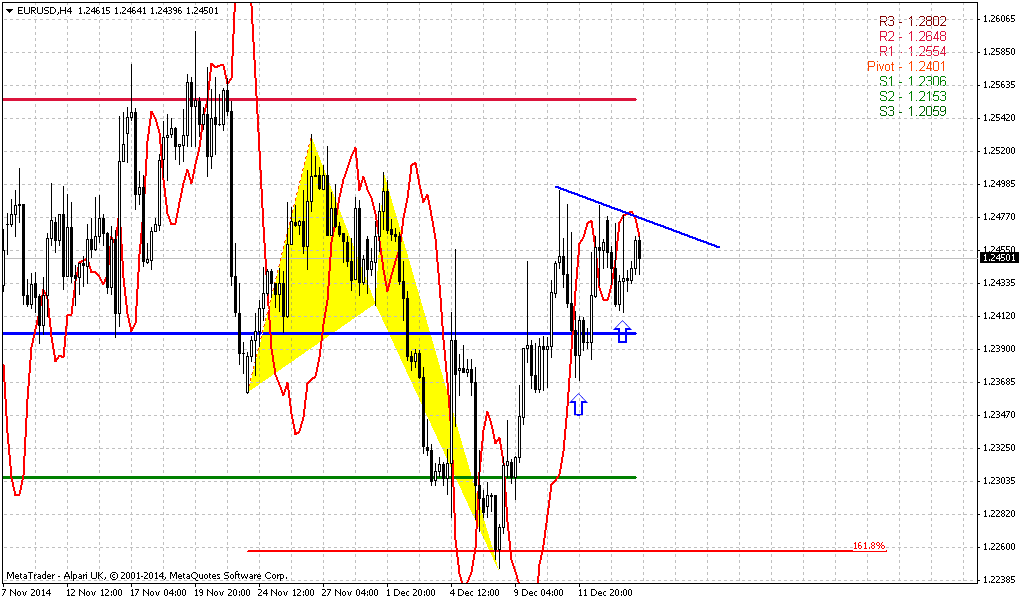
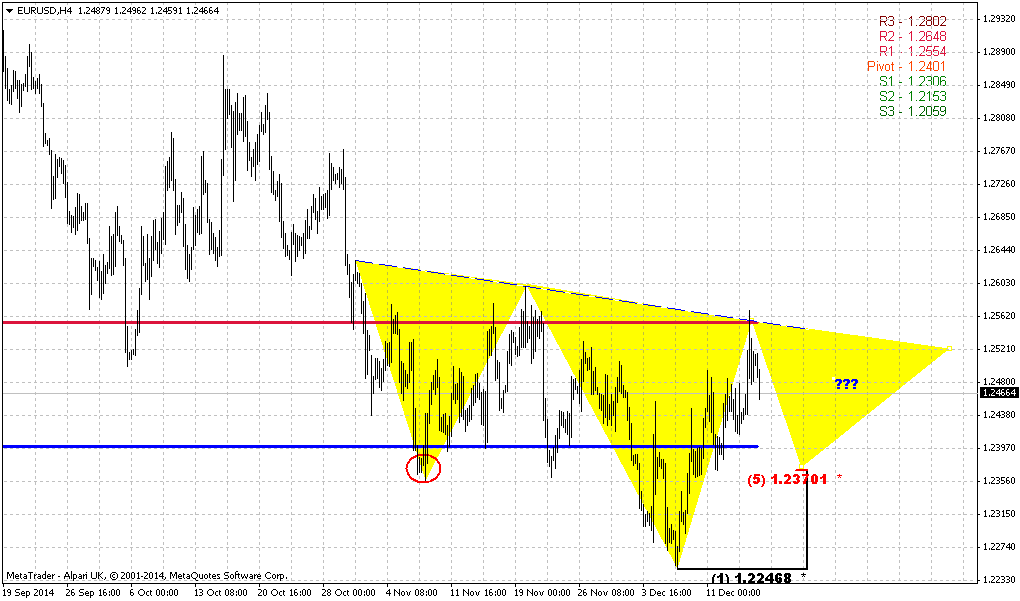
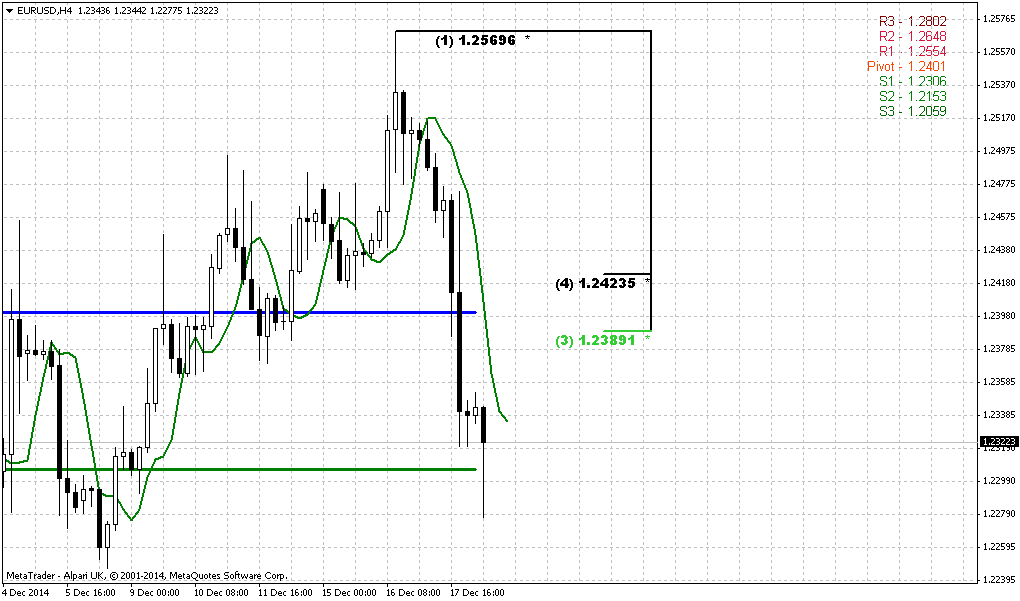
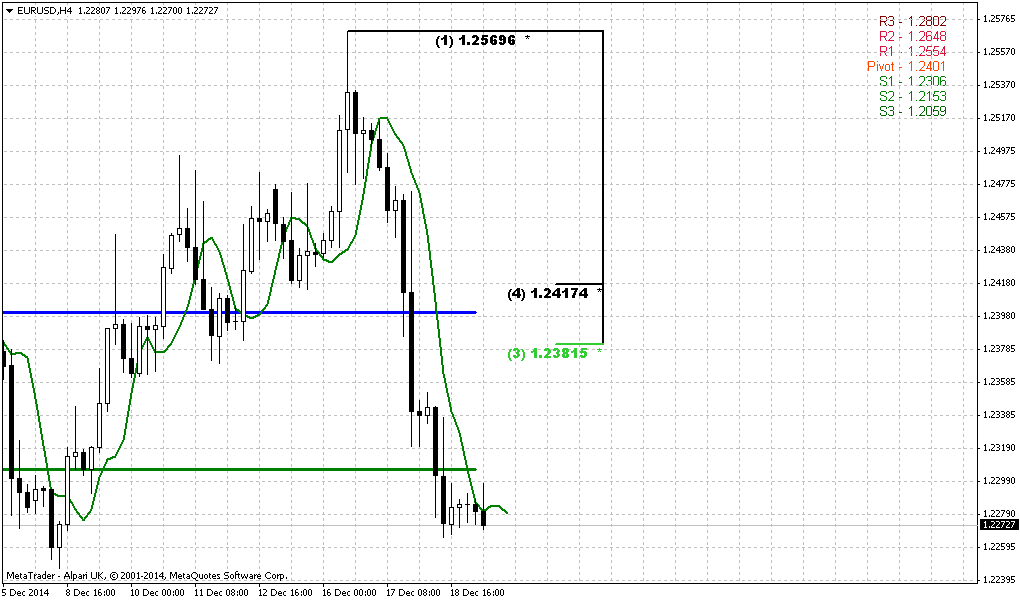
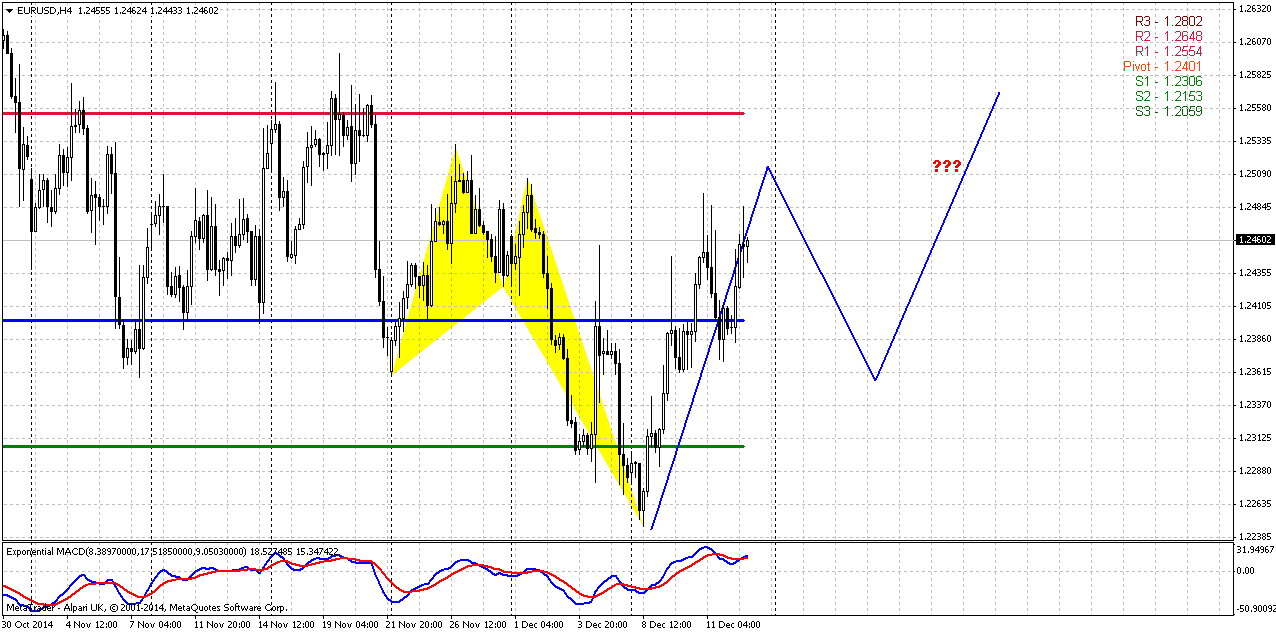
4-hour
As market stands stubborn with upside action and as we’ve said only daily overbought prevents it from further upside action, it makes sense to discuss possible H&S patterns here. Actually we could get as larger H&S, if market will move right to 1.2550-1.26 level with current upside action as smaller H&S, if market will turn down somewhere around MPP. But actually this will impact only on potential upside target and currently we do not interesting much what H&S it will be. Mostly because as big H&S as small one should get bottom of right shoulder in the same area – around 1.2350-1.2360. When EUR will reach it we already will know what H&S it will be… So, we will focus on possibility to take long position here around 1.2350. Right now it is not very suitable area, mostly due daily overbought condition…
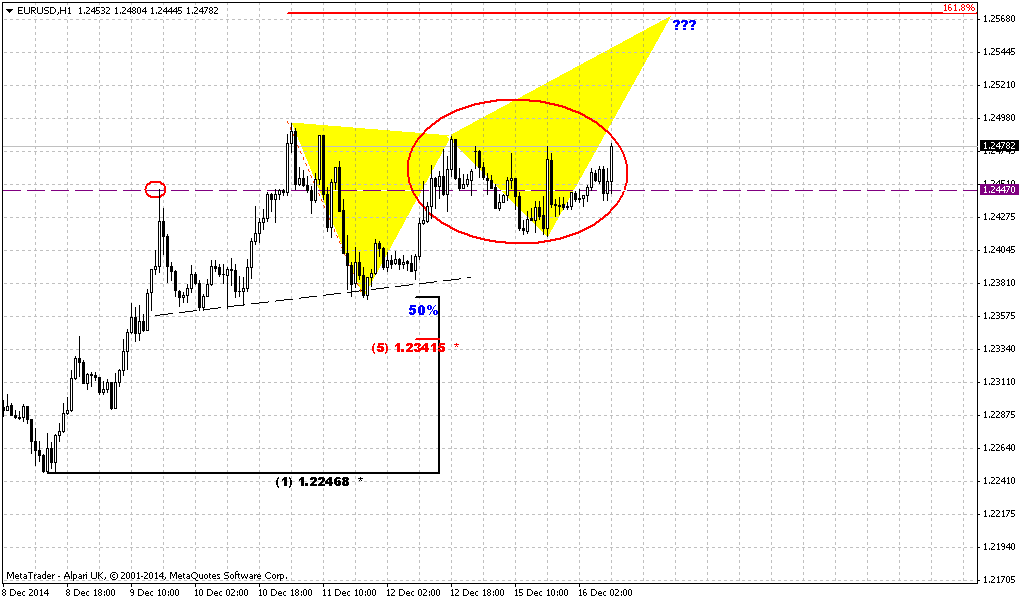
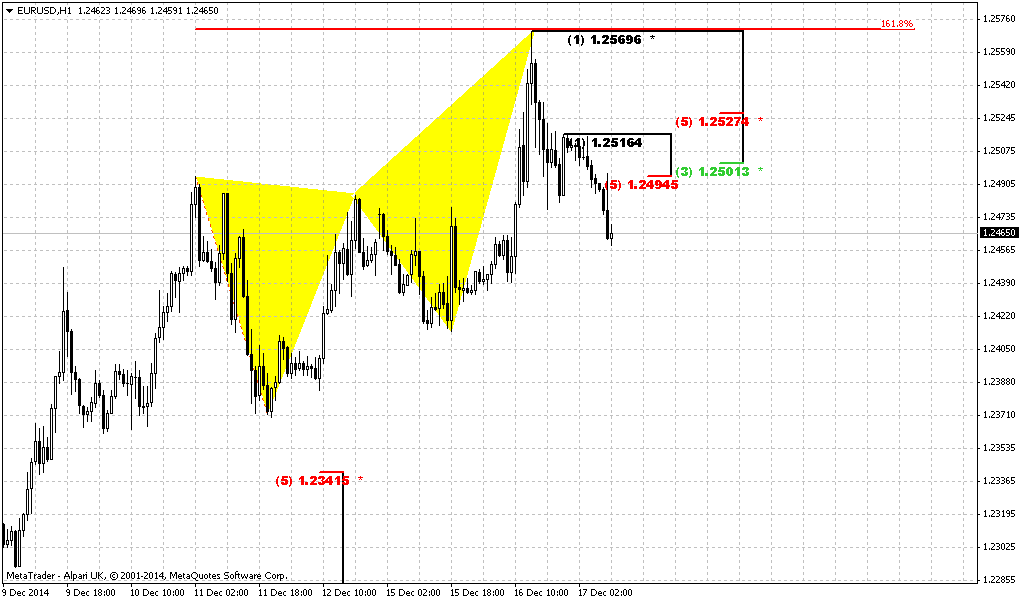
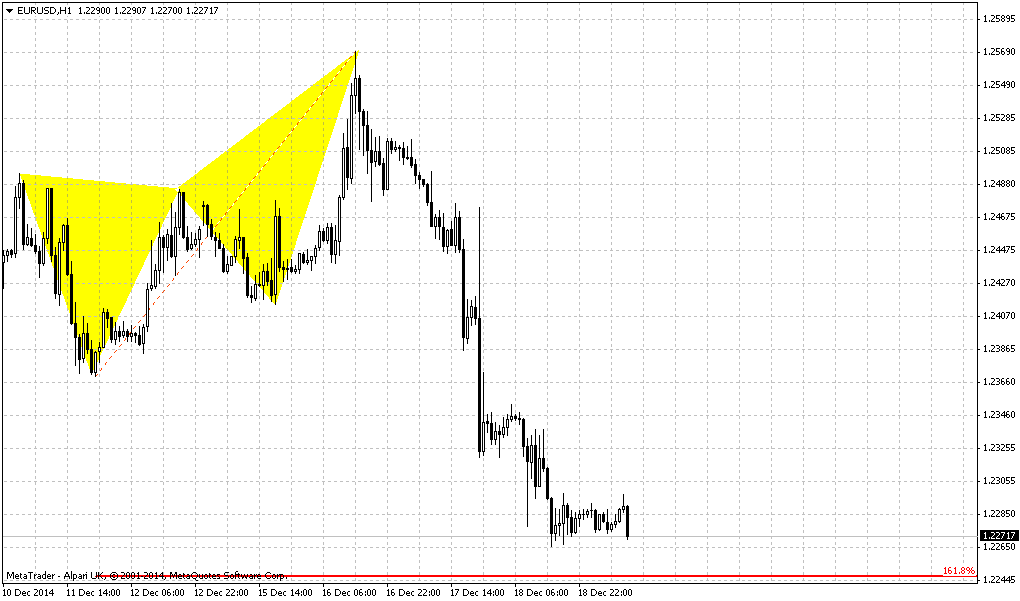
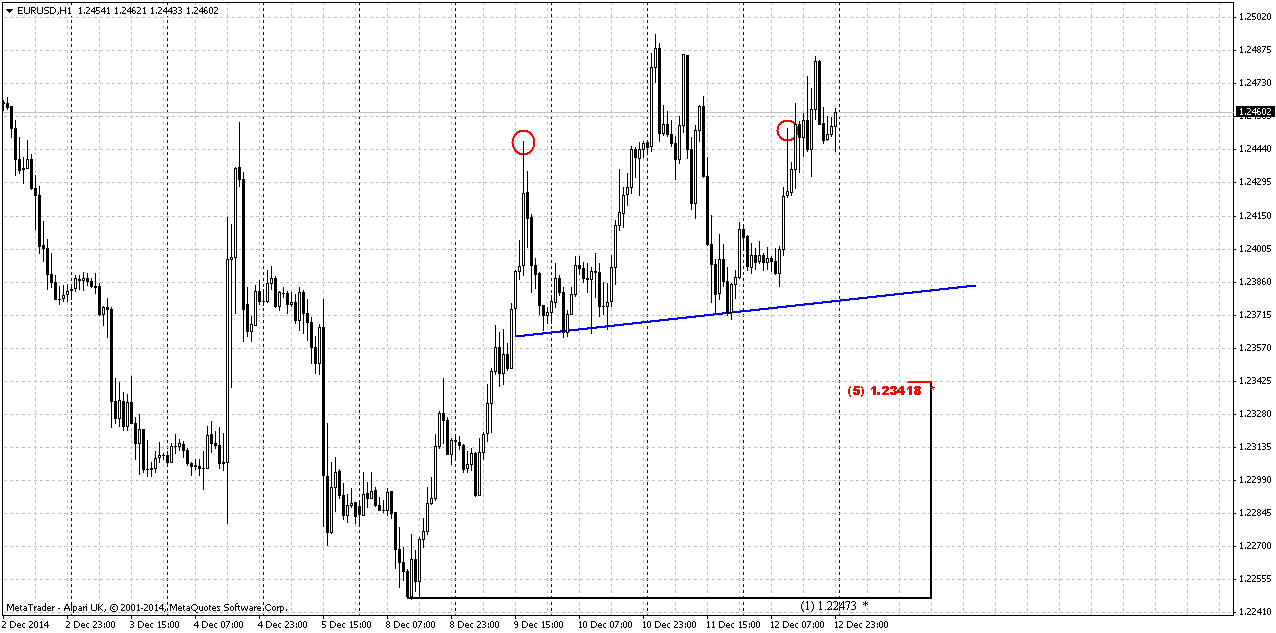
Hourly
Hourly chart provides some details for beginning of next week. Recall that on Friday we’ve decided to watch for possible H&S pattern. Particularly for 1.2450 area where top of right shoulder should appear. As EUR has not stopped there and tries to move higher, it means that this H&S pattern probably has failed, and it means in turn that market really could form big H&S on 4-hour chart… Also we see that 5/8 Fib support stands right at the bottom of potential right shoulder. Thus, it will be also an our area to watch for potential long entry…
Conclusion:
Although we still have untouched major 1.22 target on monthly chart, that theoretically should be reached with normal market behavior when market stands on its own. But recent structural shifts in globe financing, that also is confirmed by recent CFTC data as on gold market as on EUR makes us think that normal market behavior could be distorted. Still we need to get more confidence of this idea and it probably will take some time to get it.
In short-term perspective EUR looks bullish. Nearest target stands at 1.26-1.2650 and upside action could start from reverse H&S pattern on 4-hour chart @ 1.2450 area…
The technical portion of Sive's analysis owes a great deal to Joe DiNapoli's methods, and uses a number of Joe's proprietary indicators. Please note that Sive's analysis is his own view of the market and is not endorsed by Joe DiNapoli or any related companies.
Reuters reports The U.S. dollar cut its losses against the euro, extended gains against the yen and reached an 11-year high against the Norwegian crown on plunging oil prices and stronger-than-expected U.S. economic data on Friday.
Oil prices fell to 5-1/2 year lows on concerns of a global glut, dampening inflation expectations. However, lower energy costs also increase the cash consumers have to spend heading into year-end holidays.
U.S. consumer sentiment rose to an eight-year high in December, above economists' forecasts, according to the Thomson Reuters/University of Michigan survey. The gain was fuelled by improved prospects for jobs and wages, while inflation expectations rose as well, bolstering the case for the U.S. Federal Reserve to raise interest rates next year.
"The implication here is this leads to a stronger dollar," said Steven Englander, global head of G10 foreign exchange strategy at CitiFX.
Englander said interest rate forecasts were low and what the Fed really cares about is not shaky equity markets but job creation, while inflation expectations are not as wobbly as previously thought.
"The fact that the Michigan inflation expectations bounced back is significant because it is the last pillar of the (Fed) doves, and even though we are not at full employment, we are approaching it fast," he said.
The Fed's two-day meeting next week ends with its interest rate decision, due on Wednesday.
"The data, especially the inflation component of the University of Michigan report, supports an incrementally more hawkish Fed and in this backdrop of softening growth in other major regions, an incrementally more hawkish Fed is positive for the dollar," said Brian Daingerfield, currency strategist at the Royal Bank of Scotland in Stamford, Connecticut.
Recent CFTC data shows drastical drop in speculative short positions. Although longs also has decreased but this reducing was in a row with weekly fluctuations. Besides, overall trend in long positions stands upside. Open interest also has dropped but mostly due the same short covering. This is very important transformation on EUR. Why investors have turned to closing shorts here? Do they not believe in USD appreciation any more? Or this is just profit taking at the end of the year? Here we have to return back to discussion of our idea – possible investors’ preparation for EU QE that should start in January. Still here is some lack of confirmation. The point is that to confirm our theory we need to see not just short covering, but long opening. We need to see that investors have started to accumulate EUR to put them later in EU assets, bonds and stocks. Otherwise current upside action will fade very soon. Only real inflow and demand for EU currency could support this trend for long period. This CFTC data stands on 9th of December. Let’s see what we will get on next week…
Open interest:
Recently we’ve made wide comments on complex situation around EUR. As we’ve said previously EUR right now stands in center of geopolitical and economical turmoil and we have mutual 2-side relations EU-US and EU-Russia. And progress of these relations develops not very positive. Shortly speaking US freely gives the law to EU because de facto EU is not totally independent.
Economically US and EU drives on opposite courses. While US is tending to starting rate hiking cycle in mid 2015, ECB gives comments on QE and increasing of balance to the level of March 2012 and this assumes QE on approximately 3 Trln EUR.
This makes us think that EUR now stands under double pressure – EU pulls chestnuts out of the fire for US (in relation with Russia) and particularly due this action makes economical pit deeper. What could bit this sorrow?
As a result of blind or coercive following to US policy, EU meets problems with Russia, it’s 3rd largest trading partner. We suggest that situation will become worse, US will demand more and more sanctions from EU upon Russia. But in turn, economical situation EU-Russia stands in relation with geopolicy where US will not accept any compromises. Any ECB efforts on stabilizing of EU economy could be mitigated by new spiral of geopolitical tensions and painful sanctions. That’s why here is our conclusion – hardly real reversal on EUR is possible any time soon.
But the only one thing exists that could put short-term situation from top to bottom. And this thing is European QE. We already gave some hints on our daily updates on this subject. Here we operate such terms as “short-term” and “long-term”. As we have a habit to treat “short-term” as within a week, here we have to apply absolutely different scale, since right now we touch the sphere of economical policy and there is everything is “long-term”. That’s why I will give you example how correctly understand this.
Recent 2 years we saw QE in US. As result we’ve got huge bubble on stock market and other US assets. This we should treat as “short-term technical impact”. Why it is technical? Because recent huge growth of financial markets were driven not by real growth of economy and wealth of nation, but mostly due re-distribution of money flows. Thus Fed has injected trillions of dollars in financial system and have expected that banks and financial companies will put them in real sector as long-term loans that should support economy, increase job creating and wealth of people. May be some part of money really was applied as it should be, but most part was put in stock market. As a result, while QE functions, we’ve saw “technical short-term” impact as rally on stock market. Now about long-term… In long-term period we should get impact of real economical laws. QE somehow should impact US economy and not necessary that this impact will be positive. In reality nobody knows what will happen. Right now, as QE was closed, we stand just at the eve of new period.
Now, let’s back to EU. Why we think that drastical changes could happen on EUR? Probably you’ve got it already. As financial world already has seen the QE, how it works – investors understand that something of this kind will happen right now in EUR-zone. And this is “easy money”. Just put them in EU assets and wait while ECB will push market higher and higher with its liquidity. Why should QE fail in EU while it has worked in US? And this could change the picture for couple of years on EUR, at least till ECB will keep with QE. That’s why now we keep close eye on CFTC data. We already have first signs that relatively confirm our suspicions. But in the long-term perspective EUR really will remain under pressure. As soon as QE will be over, difference in rate policy between EU and US will start to dominate again and EUR could return back to decreasing. And again, guys, right now hardly somebody could imagine what result will follow from such huge QE programs, as in EU as in US. Short-term effect could be positive, but what will be with inflation? Who knows that it will remain at 2-3%?
Technicals
Monthly
From technical point of view we have large Gartley “222” Sell pattern, it nearest target is 1.22 – 0.618 AB-CD objective point. Last week market has not reached target just for 46 pips. Legs of the pattern very harmonic, speed of CD and AB legs are almost equal. EUR looks really heavy; month by month it opens at the high close at the low. Currently we see some relief and it is difficult to predict when 1.22 target will be hit. This will depend on assets re-structuring procedure due QE but from pure technical approach odds suggest 1.22 target should be hit. It is too long EUR stands in downward action and bearish momentum is still strong. “Three black crows” pattern and breakout through Yearly Pivot Support 1 suggests that 1.22 could become no final target probably, and we should not surprise if we will see decline in next year as well. Only some structural shifts as QE could change situation or postpone downward action.
Weekly
Trend has turned bullish. Market has formed 3-Drive pattern and even nicely looking bullish engulfing pattern. This has happened when CFTC data shows solid change in market sentiment. Both patterns make really possible reaching of 1.26 area till the end of December. It is interesting that normal engulfing target approximately coincides with minimum target of 3-Drive.
On previous week market has erased all bearish reaction on NFP release and stands tight near MPP. It means that in short-term perspective we probably will stick with this engulfing pattern. Bearish sentiment could be re-established only if market will pass through current 1.2250 lows…
Daily
Daily chart provides not many details. Trend has turned bullish here. In fact, we have confirmation of patterns that we’ve discussed above. Still one major point stands here. Take a look how market coiling below MPP. In general this type of behavior is not typical for bearish market, especially for the market that has target 50 pips below current level. But as we’ve said structural asset shifting could distort normal technical behavior. Another bullish sign here is tight standing below MPP. Actually guys, it seems that only overbought holds EUR from moving above MPP and we probably will get confirmation of this on coming week. Take a look how market just creeps with overbought higher without retracement.
4-hour
As market stands stubborn with upside action and as we’ve said only daily overbought prevents it from further upside action, it makes sense to discuss possible H&S patterns here. Actually we could get as larger H&S, if market will move right to 1.2550-1.26 level with current upside action as smaller H&S, if market will turn down somewhere around MPP. But actually this will impact only on potential upside target and currently we do not interesting much what H&S it will be. Mostly because as big H&S as small one should get bottom of right shoulder in the same area – around 1.2350-1.2360. When EUR will reach it we already will know what H&S it will be… So, we will focus on possibility to take long position here around 1.2350. Right now it is not very suitable area, mostly due daily overbought condition…
Hourly
Hourly chart provides some details for beginning of next week. Recall that on Friday we’ve decided to watch for possible H&S pattern. Particularly for 1.2450 area where top of right shoulder should appear. As EUR has not stopped there and tries to move higher, it means that this H&S pattern probably has failed, and it means in turn that market really could form big H&S on 4-hour chart… Also we see that 5/8 Fib support stands right at the bottom of potential right shoulder. Thus, it will be also an our area to watch for potential long entry…
Conclusion:
Although we still have untouched major 1.22 target on monthly chart, that theoretically should be reached with normal market behavior when market stands on its own. But recent structural shifts in globe financing, that also is confirmed by recent CFTC data as on gold market as on EUR makes us think that normal market behavior could be distorted. Still we need to get more confidence of this idea and it probably will take some time to get it.
In short-term perspective EUR looks bullish. Nearest target stands at 1.26-1.2650 and upside action could start from reverse H&S pattern on 4-hour chart @ 1.2450 area…
The technical portion of Sive's analysis owes a great deal to Joe DiNapoli's methods, and uses a number of Joe's proprietary indicators. Please note that Sive's analysis is his own view of the market and is not endorsed by Joe DiNapoli or any related companies.