Sive Morten
Special Consultant to the FPA
- Messages
- 18,695
Monthly
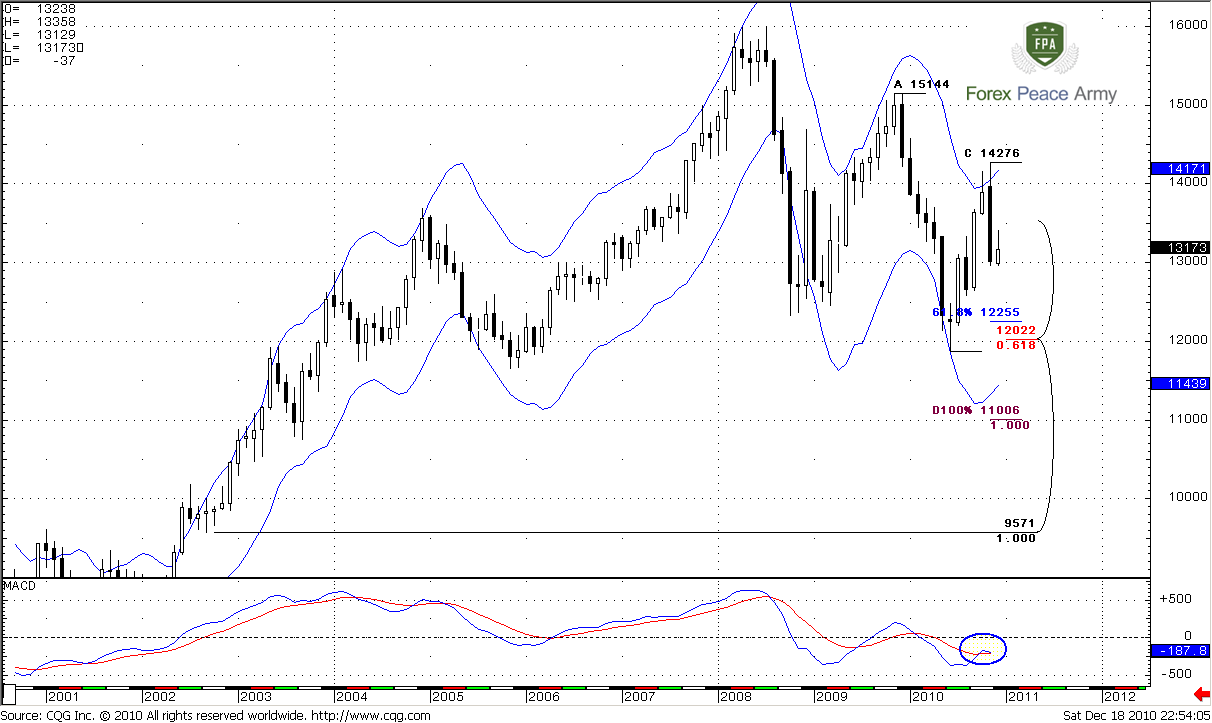
Monthly trend is formally bullish, but price action does not absolutely confirm that. Price action during December was anemic. This just confirms the strong nature of bearish engulfing pattern that we’ve discussed previously. Also, as I’ve said previously, possibly current price action could behave as B&B sell pattern, with target around 1.27, but this is just assumption. Besides, the thrust was not perfect – too few bars in it.
Of cause, I do not offer you to trade monthly pattern - we use this pattern just as a possible context for deeper understanding of situation on lower time frames.
Now couple of words about the same bearish engulfing November bar that is also a reverse bar. I still think that this is an absolutely tradable bar from technical point of view. As you know, bearish engulfing signal remains valid, until market will not take over the highs of this bar. So, currently we can trade that swing down. The nearest target on monthly chart is a 0.618 Fib expansion from more recent ABC-top pattern at 1.2255. Nearest support is 1.2022. It was tested once already, but the level of penetration was small, so I think that this level is still in play.
#1
Weekly
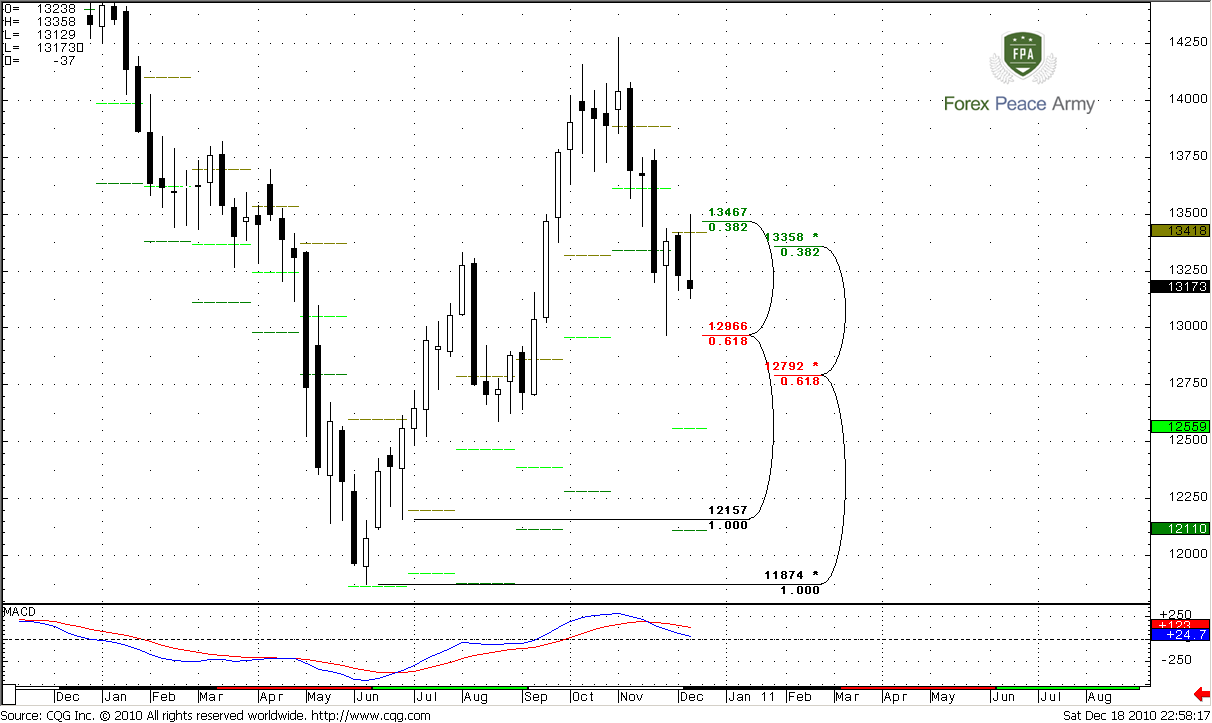
Not much new action on weekly time frame. Weekly trend is clearly bearish. Take a look at last three weeks. This consequence has started from nice hammer candle, that later was engulfed by strong down bar. The latter bar in turn, engulfs the former one. It is not a normal bearish engulfing; in fact, I just say that the trading range during the recent week was greater. Now, let’s take a look at the last bar. See, in the beginning of the week market has tried to move above the monthly pivot (1.3418), failed there, plunged all way down and closed below the lows of previous week. This is a really sign of weakness and it gives me the confident that the recent swing down is absolutely tradable, I think that bears really control the market now.
The next weekly support is 1.2966. Monthly pivot support stands far below current prices at 1.2559.
Daily
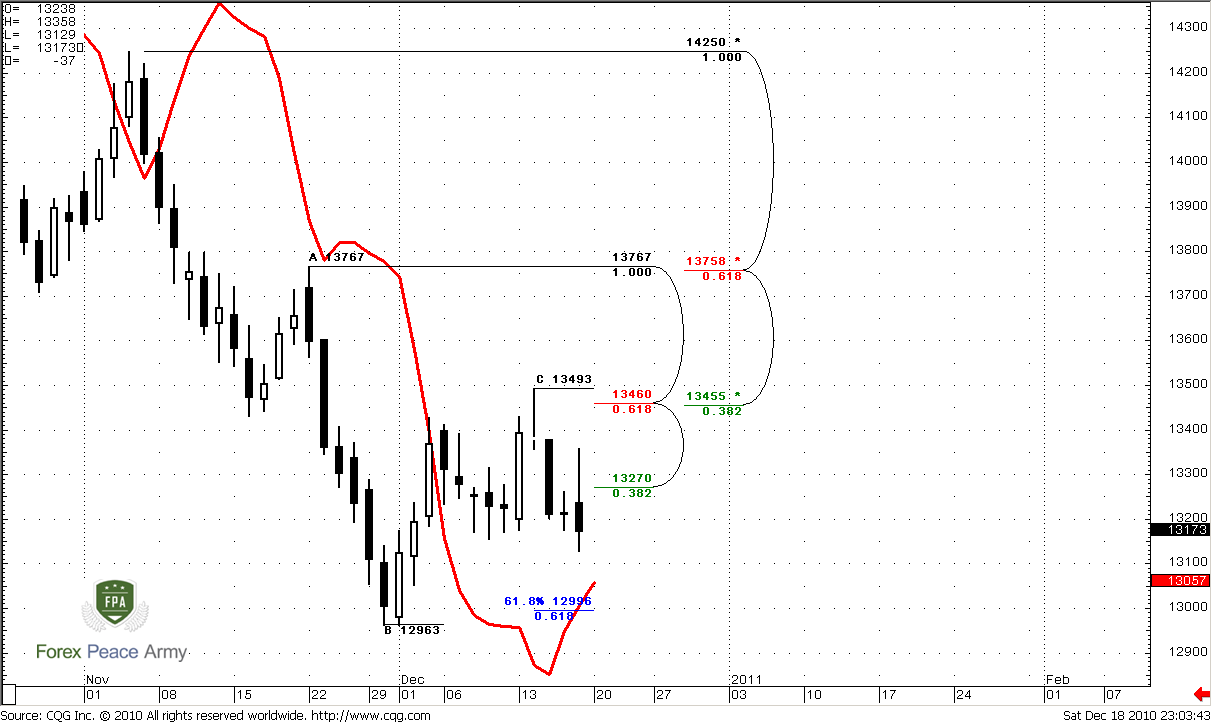
As we’ve expected, the beginning of the week was explosive up move by the market, after anemic price action during the previous week. There are a lot of things here, that you, guys already familiar with – daily Confluence resistance at 1.3455-13460, and next ABC-top target at 1.2996. Other targets, that below the market are not logical currently, because they are beyond the daily oversold area (although I do not have an OscP at my chart). But there are a couple of interesting things that are worthy to be discussed here, especially because they are not so obvious.
First of all, remind ABC-bottom pattern with 1.3443 target – we’ve traded it during the previous week. This was just 0.618 Fib expansion. Usually, if bulls control the market, prices never show deep retracement after just 0.618 target, furthermore, prices never turn back and take out the previous lows. But precisely that has happened. Market shows us how weak it is.
Second, look at red line on the chart. This is MACD Predictor that shows the trend. Currently it’s bullish – price is above the red line. But pay attention to price action – it’s flat. Other words, it does not support the trend. This is a bearish sign. Market is neither overbought nor oversold currently. It means that we should use any retracement to the upside for open bearish positions.
The new important levels for coming week are – weekly pivot, this is a blue dash line on the chart, as usual, stands at 1.3265 – close enough to the market. Weekly pivot support 1 stands at 1.3037 – lime dash line, and weekly pivot resistance 1 is at 1.3401 – red dash line. Now let’s shift to intraday time frame and look how we will use them…
#1
Intraday
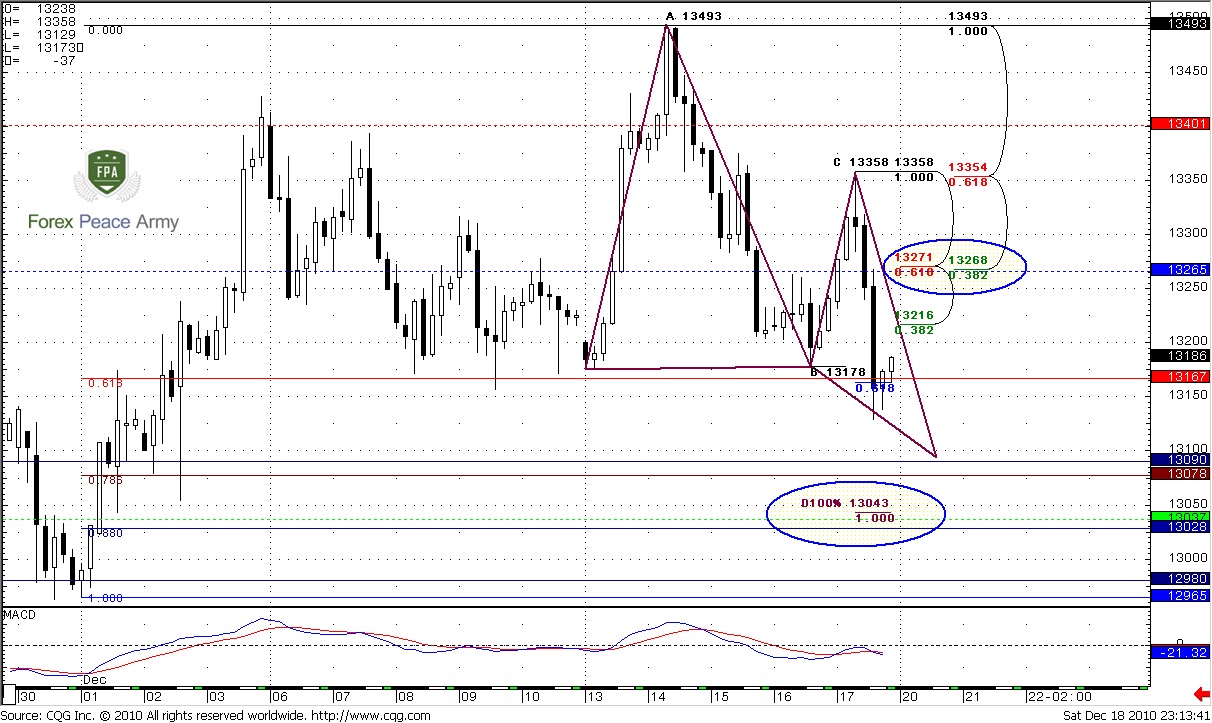
We will start from 4-hour chart, this time frame very important on coming week and have a lot of important moment. Read it carefully, there is a lot of stuff here. On the left side of the chart we can see, how market broke triangle to the upside, hit daily 0.618 Fib target at 1.3443, triggered stops above 1.34 and reached daily Confluence resistance at 1. 3460. The current move down, that is particularly interesting for us, has started from nice W&R pattern – but these things are just a rearview mirror. Just to remind you…
Now, for coming week we will trade the last swing down. As we discussed, the EUR was really weak, so daily confluence at 1.3460-1.35 area should hold. Let’s look at this swing – first, we see intraday ABC-top pattern. Market has hit Agreement at 1.3167 area at started to show something like retracement. The next target is 100% expansion at 1.3043 that coincides with weekly pivot support 1 at 1.3037 and deep 88% Fib support at 1.3028. Probably, before retracement up market will show some piercing of this area – just to accomplish daily 0.618 Fib target at 1.2996. That is our nearest target – 1.30-1.3030 area for coming week.
Second, we have Butterfly “Buy” pattern. As you already know, this pattern could have 1.272 or 1.618 target. 1.272 is at 1.3090, 1.618 – at 1.2980 – very close to daily target and right at previous lows. So these lows should hold for some time. I think that market will not stop at 1.272, because the CD-leg on the chart is much faster than AB. This is the sign of weakness. Ok, we determine the targets, but where we have to enter?
I see couple of areas and possibilities for that. On 4 hour chart the first area to watch for is first Fib resistance at 1.3216 with stops above 1.3280. The second one is 4-hour Confluence resistance at 1.3268-1.3271 that also coincides with weekly pivot. In the case of enter from the second area, stop should be placed above weekly pivot resistance at 1.34 area.
You may ask, Sive, why we are consider with the first Fib resistance? It’s obvious that the second area is much stronger. Let’s shift to hourly chart and you will understand why…
4-hour
Here is nice context for B&B Look-alike “Sell” pattern. I’ve said “Look-alike”, because there is not sufficient amount of bars in the thrust. But bars itself are really strong and nice. I think that this context could work well. The reason, why I talk about the first Fib resistance is as follows. We all see that sell-off is really strong. In such cases, market very often shows shallow AB (and not AB-CD) retracement and continues its move down. That’s why we can enter from the first Fib resistance. When market will reestablish move down – move your stops to breakeven and watch the movie. If market will turn to deeper retracement – you will have another possibility to enter without any loss. If not – you are already in game.
Just one note here... If it will be DRPO LAL, instead of B&B – then wait for deeper retracement, until to Confluence area at 1.3270.
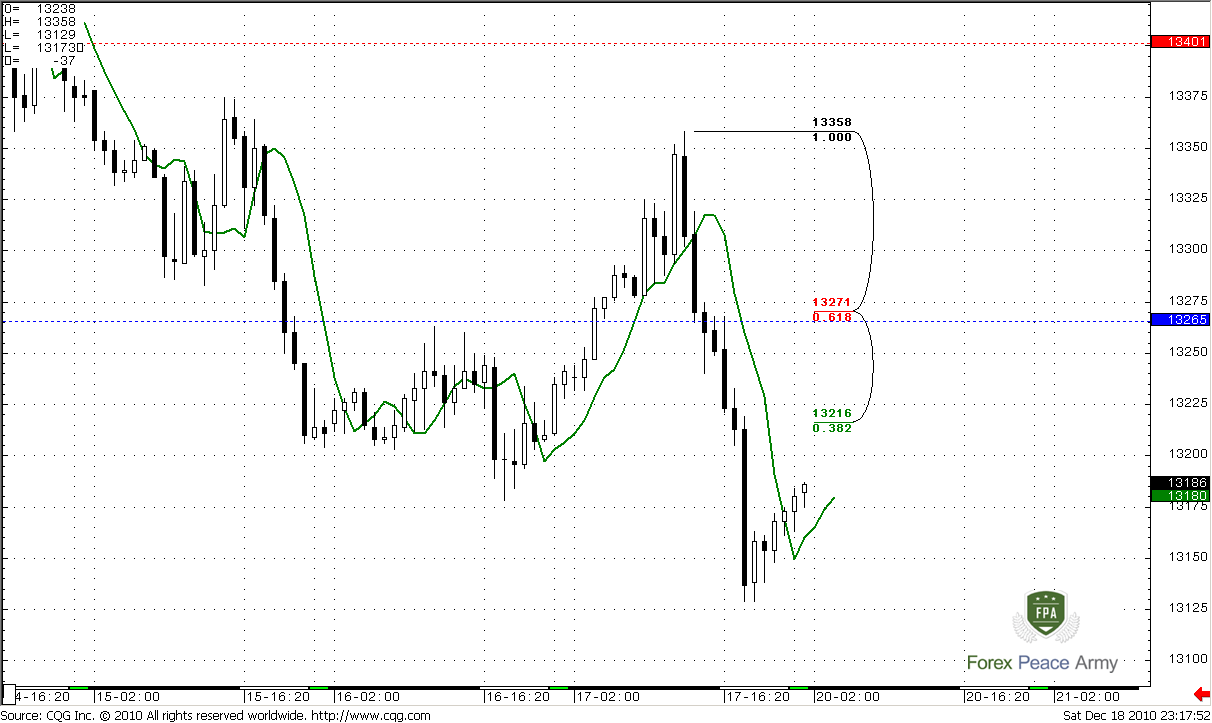
1-Hour
Conclusion: On longer term market does not show something really new. Situation still looks bearish but market stays in tight range.
In shorter term I believe that bears control the market and we can use retracement up for enter on the Short side of the market. The nearest target is 1.2980-1.3030 area.
The technical portion of Sive's analysis owes a great deal to Joe DiNapoli's methods, and uses a number of Joe's proprietary indicators. Please note that Sive's analysis is his own view of the market and is not endorsed by Joe DiNapoli or any related companies
Monthly trend is formally bullish, but price action does not absolutely confirm that. Price action during December was anemic. This just confirms the strong nature of bearish engulfing pattern that we’ve discussed previously. Also, as I’ve said previously, possibly current price action could behave as B&B sell pattern, with target around 1.27, but this is just assumption. Besides, the thrust was not perfect – too few bars in it.
Of cause, I do not offer you to trade monthly pattern - we use this pattern just as a possible context for deeper understanding of situation on lower time frames.
Now couple of words about the same bearish engulfing November bar that is also a reverse bar. I still think that this is an absolutely tradable bar from technical point of view. As you know, bearish engulfing signal remains valid, until market will not take over the highs of this bar. So, currently we can trade that swing down. The nearest target on monthly chart is a 0.618 Fib expansion from more recent ABC-top pattern at 1.2255. Nearest support is 1.2022. It was tested once already, but the level of penetration was small, so I think that this level is still in play.
#1
Weekly
Not much new action on weekly time frame. Weekly trend is clearly bearish. Take a look at last three weeks. This consequence has started from nice hammer candle, that later was engulfed by strong down bar. The latter bar in turn, engulfs the former one. It is not a normal bearish engulfing; in fact, I just say that the trading range during the recent week was greater. Now, let’s take a look at the last bar. See, in the beginning of the week market has tried to move above the monthly pivot (1.3418), failed there, plunged all way down and closed below the lows of previous week. This is a really sign of weakness and it gives me the confident that the recent swing down is absolutely tradable, I think that bears really control the market now.
The next weekly support is 1.2966. Monthly pivot support stands far below current prices at 1.2559.
Daily
As we’ve expected, the beginning of the week was explosive up move by the market, after anemic price action during the previous week. There are a lot of things here, that you, guys already familiar with – daily Confluence resistance at 1.3455-13460, and next ABC-top target at 1.2996. Other targets, that below the market are not logical currently, because they are beyond the daily oversold area (although I do not have an OscP at my chart). But there are a couple of interesting things that are worthy to be discussed here, especially because they are not so obvious.
First of all, remind ABC-bottom pattern with 1.3443 target – we’ve traded it during the previous week. This was just 0.618 Fib expansion. Usually, if bulls control the market, prices never show deep retracement after just 0.618 target, furthermore, prices never turn back and take out the previous lows. But precisely that has happened. Market shows us how weak it is.
Second, look at red line on the chart. This is MACD Predictor that shows the trend. Currently it’s bullish – price is above the red line. But pay attention to price action – it’s flat. Other words, it does not support the trend. This is a bearish sign. Market is neither overbought nor oversold currently. It means that we should use any retracement to the upside for open bearish positions.
The new important levels for coming week are – weekly pivot, this is a blue dash line on the chart, as usual, stands at 1.3265 – close enough to the market. Weekly pivot support 1 stands at 1.3037 – lime dash line, and weekly pivot resistance 1 is at 1.3401 – red dash line. Now let’s shift to intraday time frame and look how we will use them…
#1
Intraday
We will start from 4-hour chart, this time frame very important on coming week and have a lot of important moment. Read it carefully, there is a lot of stuff here. On the left side of the chart we can see, how market broke triangle to the upside, hit daily 0.618 Fib target at 1.3443, triggered stops above 1.34 and reached daily Confluence resistance at 1. 3460. The current move down, that is particularly interesting for us, has started from nice W&R pattern – but these things are just a rearview mirror. Just to remind you…
Now, for coming week we will trade the last swing down. As we discussed, the EUR was really weak, so daily confluence at 1.3460-1.35 area should hold. Let’s look at this swing – first, we see intraday ABC-top pattern. Market has hit Agreement at 1.3167 area at started to show something like retracement. The next target is 100% expansion at 1.3043 that coincides with weekly pivot support 1 at 1.3037 and deep 88% Fib support at 1.3028. Probably, before retracement up market will show some piercing of this area – just to accomplish daily 0.618 Fib target at 1.2996. That is our nearest target – 1.30-1.3030 area for coming week.
Second, we have Butterfly “Buy” pattern. As you already know, this pattern could have 1.272 or 1.618 target. 1.272 is at 1.3090, 1.618 – at 1.2980 – very close to daily target and right at previous lows. So these lows should hold for some time. I think that market will not stop at 1.272, because the CD-leg on the chart is much faster than AB. This is the sign of weakness. Ok, we determine the targets, but where we have to enter?
I see couple of areas and possibilities for that. On 4 hour chart the first area to watch for is first Fib resistance at 1.3216 with stops above 1.3280. The second one is 4-hour Confluence resistance at 1.3268-1.3271 that also coincides with weekly pivot. In the case of enter from the second area, stop should be placed above weekly pivot resistance at 1.34 area.
You may ask, Sive, why we are consider with the first Fib resistance? It’s obvious that the second area is much stronger. Let’s shift to hourly chart and you will understand why…
4-hour
Here is nice context for B&B Look-alike “Sell” pattern. I’ve said “Look-alike”, because there is not sufficient amount of bars in the thrust. But bars itself are really strong and nice. I think that this context could work well. The reason, why I talk about the first Fib resistance is as follows. We all see that sell-off is really strong. In such cases, market very often shows shallow AB (and not AB-CD) retracement and continues its move down. That’s why we can enter from the first Fib resistance. When market will reestablish move down – move your stops to breakeven and watch the movie. If market will turn to deeper retracement – you will have another possibility to enter without any loss. If not – you are already in game.
Just one note here... If it will be DRPO LAL, instead of B&B – then wait for deeper retracement, until to Confluence area at 1.3270.
1-Hour
Conclusion: On longer term market does not show something really new. Situation still looks bearish but market stays in tight range.
In shorter term I believe that bears control the market and we can use retracement up for enter on the Short side of the market. The nearest target is 1.2980-1.3030 area.
The technical portion of Sive's analysis owes a great deal to Joe DiNapoli's methods, and uses a number of Joe's proprietary indicators. Please note that Sive's analysis is his own view of the market and is not endorsed by Joe DiNapoli or any related companies