Sive Morten
Special Consultant to the FPA
- Messages
- 18,699
Fundamentals
Reuters reports U.S. dollar hit its highest against the euro in 4-1/2 years on Friday and reached parity with the Swiss franc after comments from European Central Bank President Mario Draghi underscored the divergence between European and U.S. monetary policy.
The euro fell to $1.2002 , its lowest since June 2010, after Draghi told the German financial newspaper Handelsblatt that the ECB was less likely to preserve price stability than it was six months ago, suggesting it was ready to take bolder steps on monetary stimulus early this year.
"Markets and commentators have been talking about this for ages, but to hear it from the horse's mouth has had a clear effect on the euro," said David Rodriguez, a quantitative strategist at DailyFX.com, a unit of retail FX broker FXCM in New York.
The euro zone single currency was also hurt by disappointing euro zone manufacturing data. The dollar index, which measures the greenback against a basket of six major currencies, hit a fresh nearly nine-year high of 91.131 and notched its third straight weekly gain.
The contrast between the U.S. Federal Reserve's path toward rate increases and looser policies in Europe and Japan boosted the dollar last year, and many analysts anticipate that divergence in policy to fuel a continued dollar rally in 2015.
The dollar hit parity, or equal value, with the Swiss franc for the first time in over four years. Draghi's comments put pressure on Switzerland's central bank to ease further in order to maintain a 1.20-franc-per-euro limit, said Alan Ruskin, global head of currency strategy at Deutsche Bank in New York.
The SNB imposed that limit in 2011, when the currency's strength squeezed exporters and threatened deflation. The SNB eased policy on Dec. 18, when it said it would impose an interest rate of -0.25 percent on some large deposits held by investors in francs.
Sterling hit a 17-month low of $1.5328 after data showed British manufacturing expanded less than expected in December.
Currently CFTC data does not show yet many changes. Data on 16th of December has shown large contraction of positions – as longs as shorts. Right now we see that Open Interest has increased slightly and it corresponds to growth in short positions, while longs stand flat. Still this data stands for 23rd. It is interesting to see what changes will come on current week when investors will start to return back on markets after holidays.
Open interest:
 Shorts:
 Longs:

Recently we’ve made wide comments on complex situation around EUR. As we’ve said previously EUR right now stands in center of geopolitical and economical turmoil and we have mutual 2-side relations EU-US and EU-Russia. And progress of these relations develops not very positive. Shortly speaking US freely gives the law to EU because de facto EU is not totally independent.
Economically US and EU drives on opposite courses. While US is tending to starting rate hiking cycle in mid 2015, ECB gives comments on QE and increasing of balance to the level of March 2012 and this assumes QE on approximately 3 Trln EUR. Recent Draghi comments gives small room for ECB maneuvers.
Here guys, I will not repeat again all things that we’ve discussed in recent 2 months. Shortly speaking EUR enters in tough times. Geopolitical tensions hit EU economy, since US and EU interests are totally opposite. EU wants stability on its Eastern borders and it does not want to maintain Ukraine on balance, while US interests are quite different here.
In economy sphere we mostly watch for two major events – details on ECB QE that should be announced on 22nd of January, second – impact of Fed rate policy on EUR. The major concern here how EUR will behave in this whitewater of financial events. Probably we need to explain a bit. At first glance it seems all simple – US will start rise rate and hence EUR should fall even deeper. But this is not quite so. We suspect that this will be true only till the moment of first rate hiking by Fed. We suspect that starting of QE program by ECB will attract a lot of investors who will want to make easy money. As US experience of QE shows, real Central Bank money mostly was put in equities but not in long-term loans of real industrial sector, population, manufacturing and etc. This has led to huge bubble on US equities. We suspect that something of this sort could appear on EU equities. Initially it will be gradual. But as soon as Fed will start to increase rates capital will start to flow to EU. As amount of money will increase this will lead to additional demand on EUR and here drop of EUR could stop, or at least will loose its pace, despite opposite courses in rate policy…
Currently it is very difficult to predict how definitely this will happen; we just mention common view on this situation. But what we do know that this will not be as simple as “US rising rates while EU not, hence USD will dominate over EUR”.
Technicals
Monthly
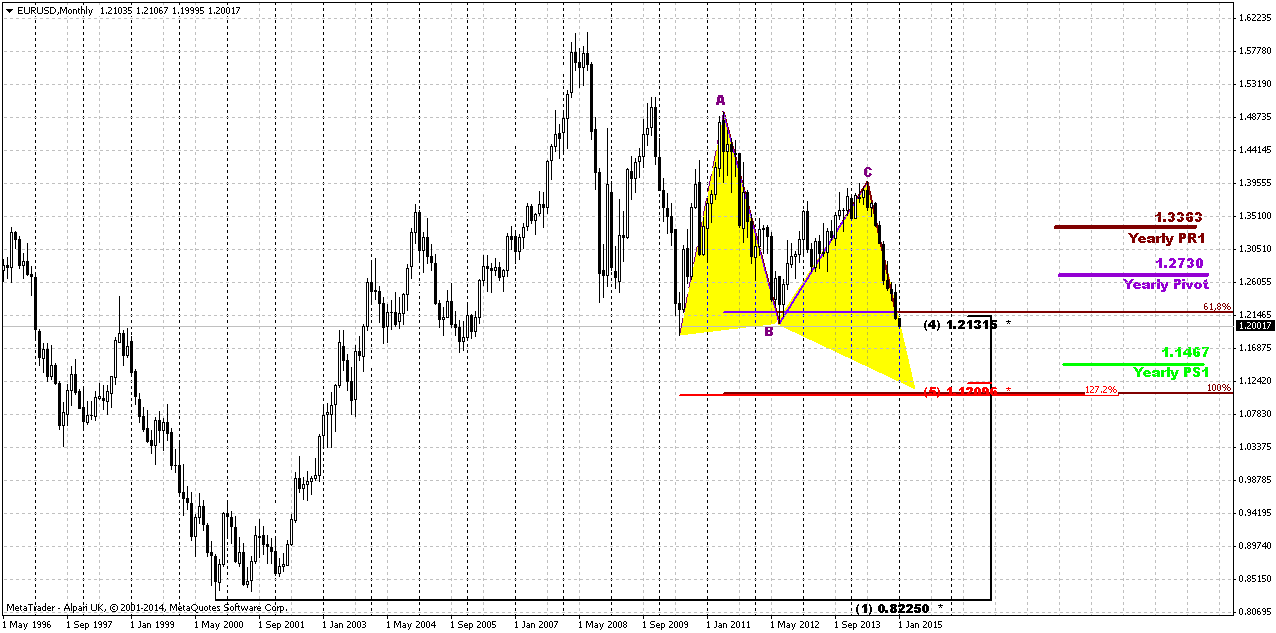
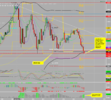
As New Year has started today guys, we will update our Yearly Pivots for EUR and take a look and monthly chart of Dollar Index as well. In 2014 EUR has broken through all yearly pivots, including YPS1. Usually this points on validity of existing bearish trend and assumes further downward continuation in 2015.
Now is the time to take wider view on monthly chart since our tactical targets have been achieved. Currently EUR provides a lot of different patterns and setups that we will keep an eye on in 2015. First of all, we will continue to monitor most recent AB=CD pattern. As market is passing through 0.618 target without any respect, next target is 100% and it stands at all time major 5/8 1.12 area. Also take a look that current 1.21-1.22 area is not just AB-CD target, this is Agreement support with favorite 50% level. Actually it is not the fact yet that market has passed it totally. And here we will be watching for another pattern. Recent thrust down on monthly chart seems suitable for DiNapoli directional pattern. As new YPP stands at 1.2730, that is above current market – B&B “Sell” seems possible.
Finally, we will be watching for butterfly “Buy” pattern that stands in Agreement with AB=CD and Fib support. This will be also an area of monthly oversold. This will be our ultimate target in 2015. It stands just slightly below YPS1=1.1467.
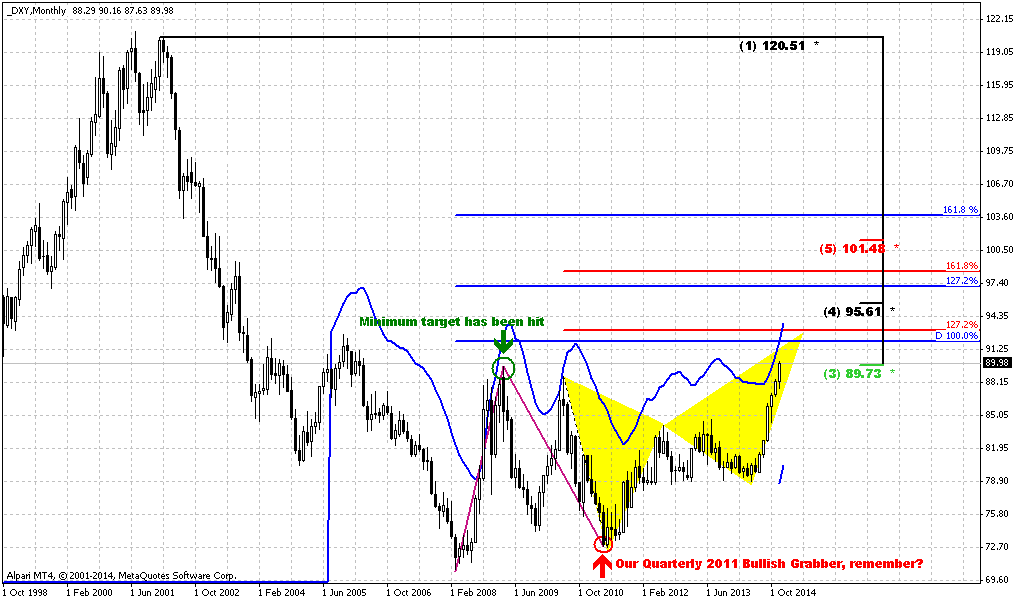
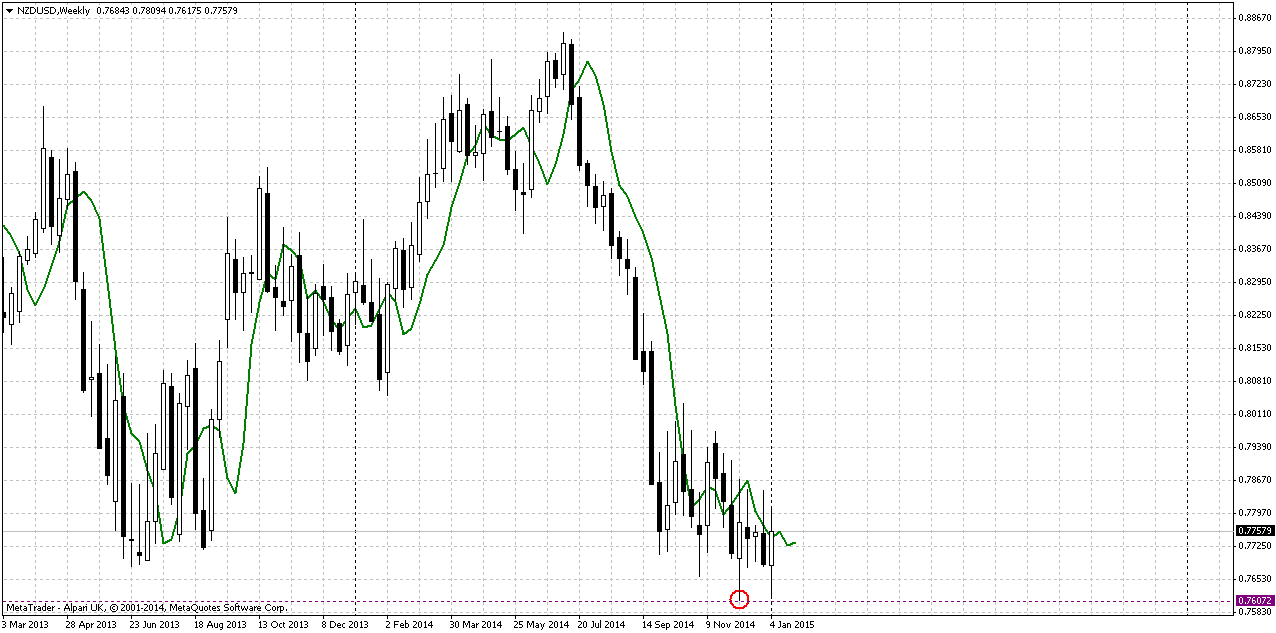
Now take a look also on dollar index. Here was our analysis on 2011 that now has hit target:
https://www.forexpeacearmy.com/forex-forum/sive-morten-analysis/17534-forex-pro-weekly-october-31-november-04-2011-a.html
Now let’s take a look at monthly chart of dollar index. Our upside AB=CD and bullish quarterly grabber have been completed. In general dollar index shows mirror chart to EUR currency – with the same Butterfly and targets…
Still guys, this sounds very good when we speak on big picture. What we’re going to do in short term, particularly on next week?
Well, first we need to get clear notification that EUR has passed through 1.21-1.22 area and now respect will follow… Currently it is not the fact yet. If we will get any reversal patterns on daily chart – this could become B&B “Sell” that we’ve mentioned above…
Weekly
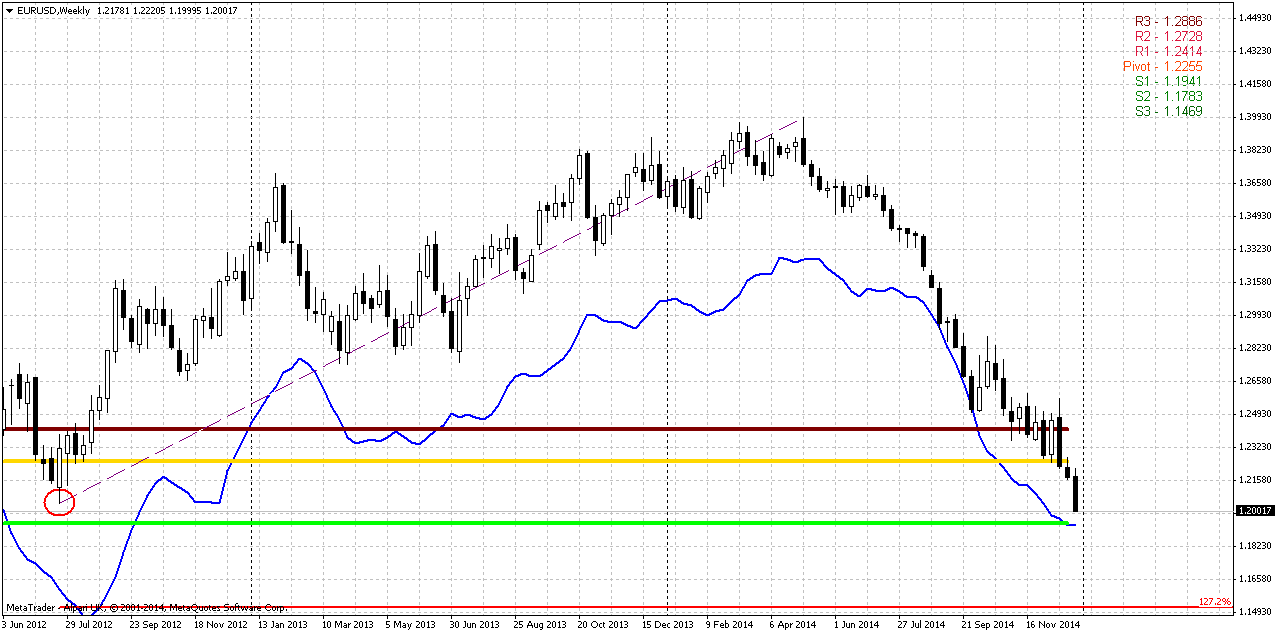
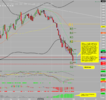
Here EUR has tried to turn to consolidation around our former 1.22 target but Draghi comments has push it lower and market moved below this level. Trend has turned bearish here again.
On weekly chart we’re mostly interested with two levels. 1.1950-1.20 has primary value for us, since it is stands closer and includes MPS1 and oversold. In fact, probably this level will tell us whether market will show any response on 1.20 monthly Agreement or it will continue move lower. This level is also interesting because it stands slightly below than former lows. So, here we also should watch for W&R that also could be a sign of possible retracement.
Second level is ~1.15. As we do not have any AB-CD’s here, we start to use extensions of retracements. This is not butterfly, just retracement… But 1.15 will be interesting in medium term perspective, but not on coming week. We just need to keep in mind that around 1.15 we have support…
That’s being said, all eyes on possible bullish patterns around 1.1940-1.20…
Daily
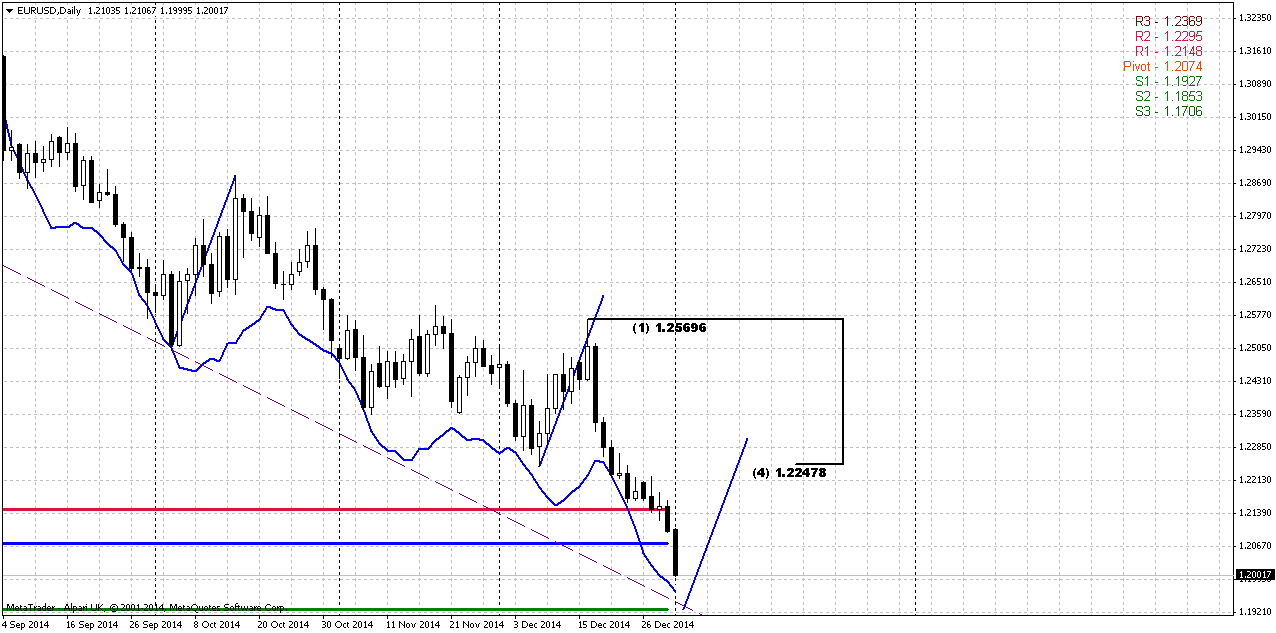
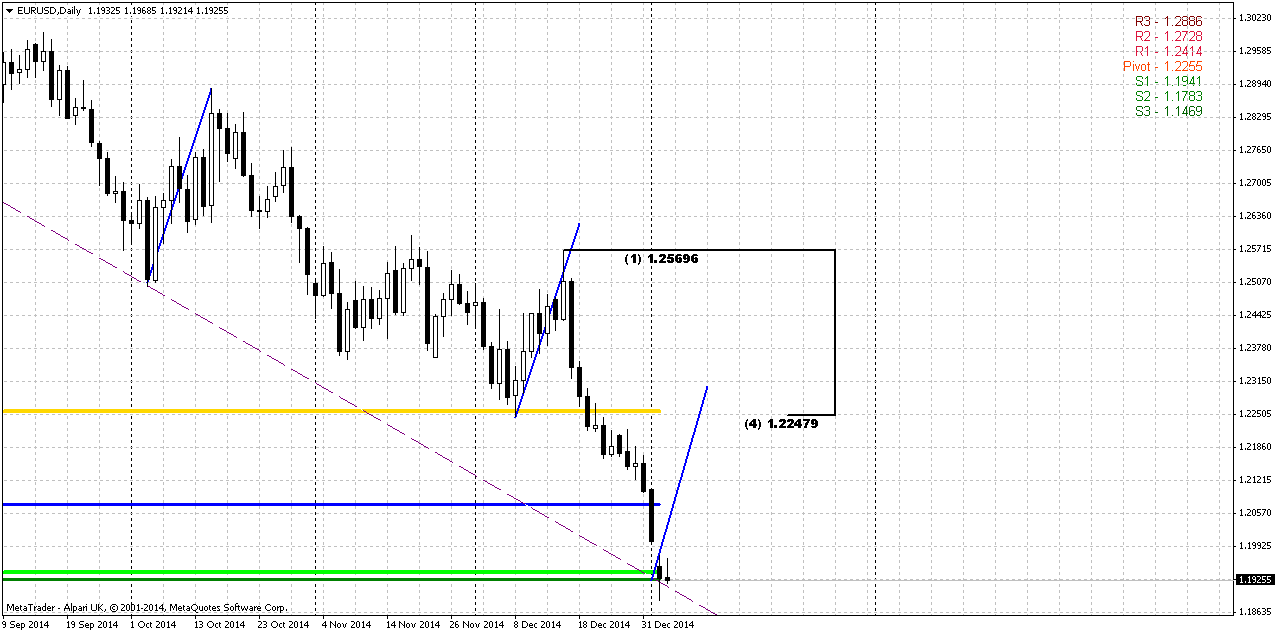
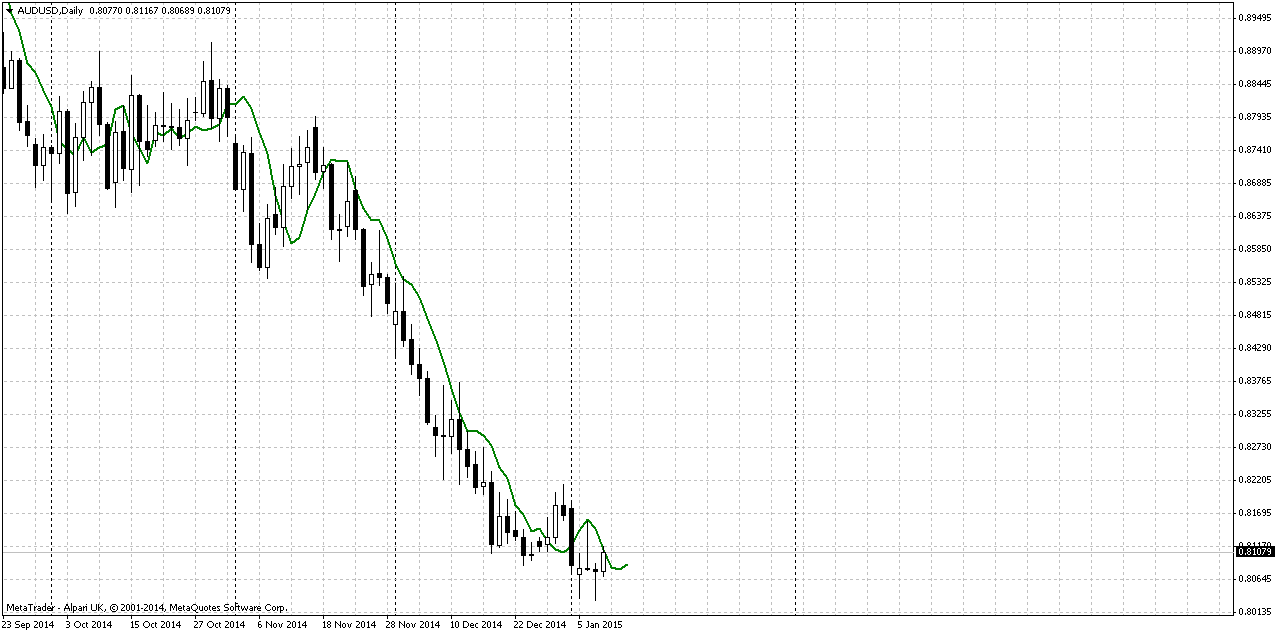
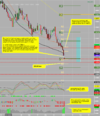
When market stands in long and stable downward action sooner or later it will pass and erase all AB-CD targets and patterns. Thus, month ago we have talked on possible butterflies, 3-Drives etc, but right now all of them are gone. On this type of market we usually apply harmonic swings, pivots and patterns on most recent swings.
Above we’ve estimated that 1.1940 will be support that includes weekly oversold and MPS1. Daily chart also points on this level but a bit differently. Thus, 1.1920 area is daily oversold as well, WPS1 and support of long term trend line, that in fact, keeps downward action since it has started around 1.40 area.
Also take a look that most recent swing could be a background for DiNapoli DRPO or B&B “Sell” pattern. That is what we could watch for in short-term. Harmonic swing points that upside target could stand as far as around 1.2250 – right around 50% resistance of most recent swing. So let’s see what will happen in reality and how market will response on 1.1940 support area…
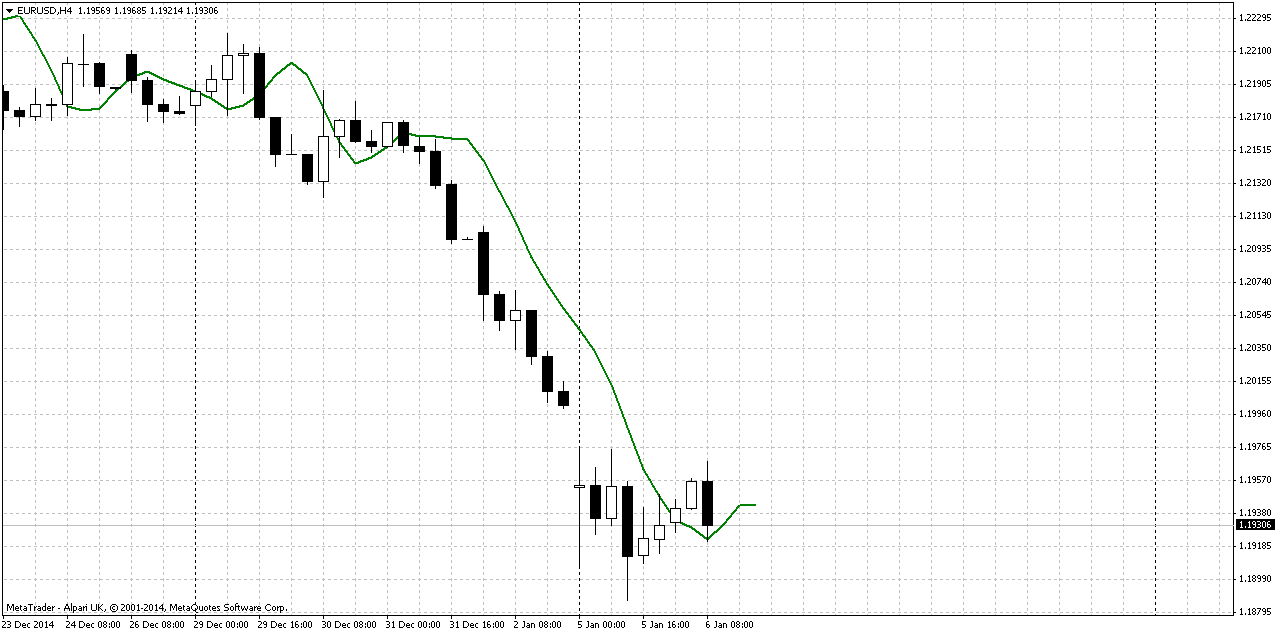
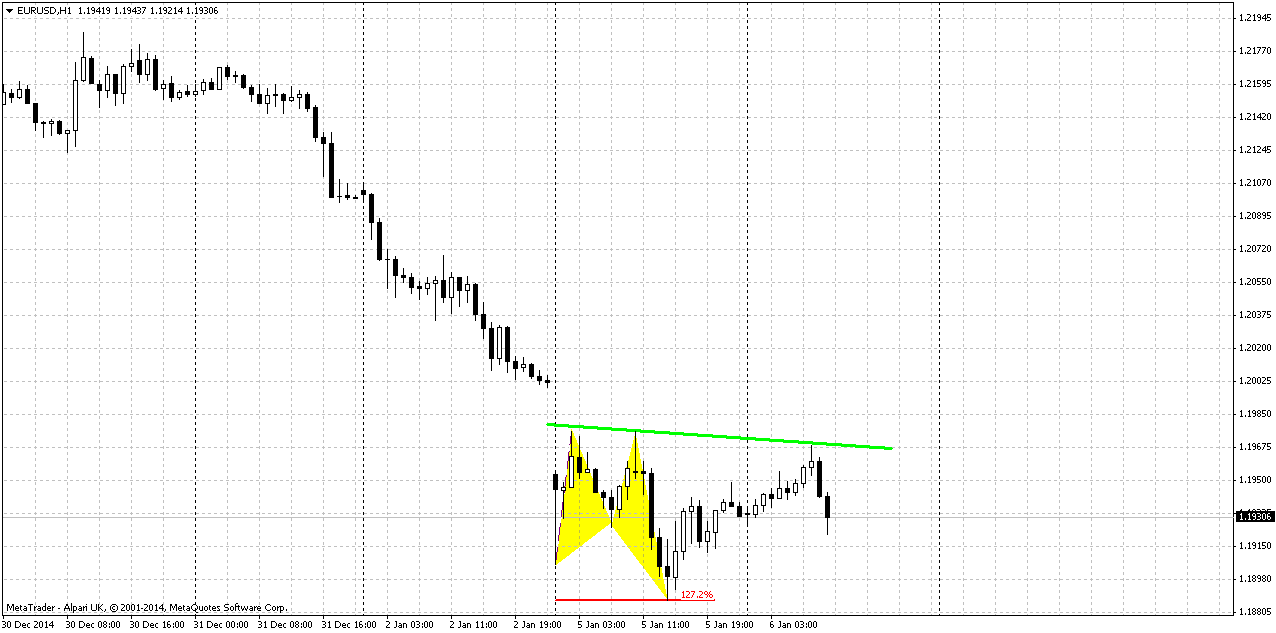
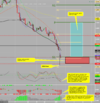
Intraday charts
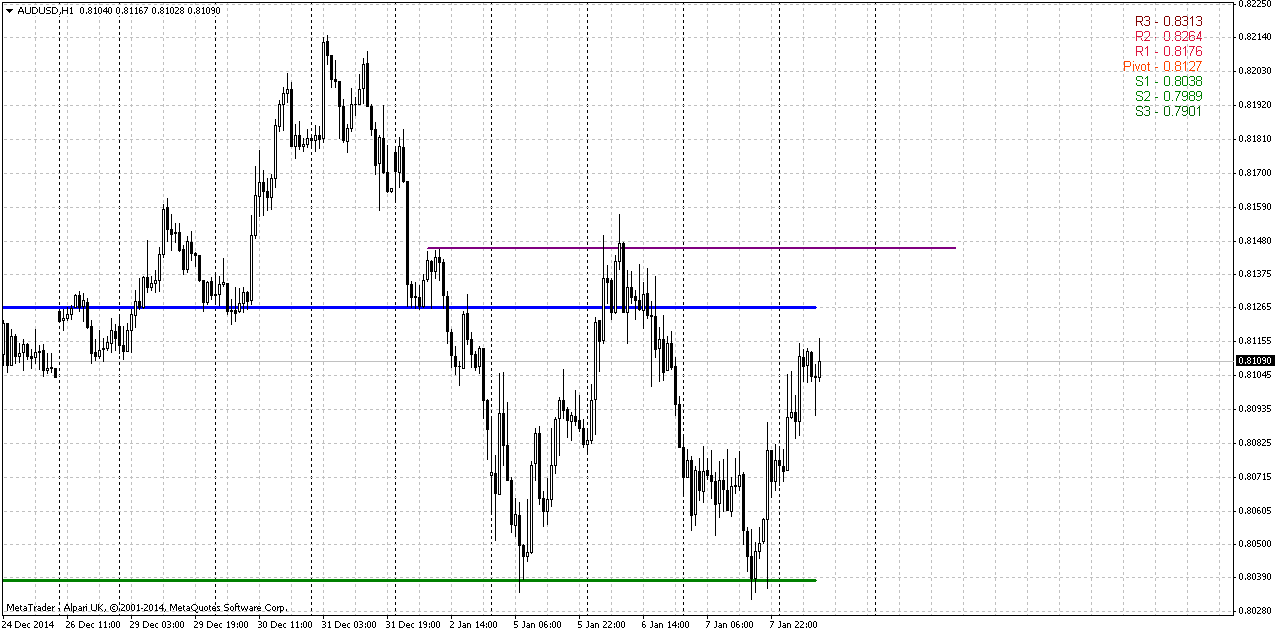
On Intraday charts, guys, we do not see anything interesting yet. Market just completed downward action and has no enough time yet to form something else or some response. Here we do not have any patterns yet…
Conclusion:
In 2015 it will be interesting to watch on EUR, since overall situation around EU as political as economical is very sophisticated and potentially in carries a lot of opportunities.
In long-term perspective we will be watching for patterns and events that we’ve mentioned in “Monthly” part of our analysis.
In short-term we mostly wonder, whether market will response on current support and will we get some retracement before market will start move to next target…
The technical portion of Sive's analysis owes a great deal to Joe DiNapoli's methods, and uses a number of Joe's proprietary indicators. Please note that Sive's analysis is his own view of the market and is not endorsed by Joe DiNapoli or any related companies.
Reuters reports U.S. dollar hit its highest against the euro in 4-1/2 years on Friday and reached parity with the Swiss franc after comments from European Central Bank President Mario Draghi underscored the divergence between European and U.S. monetary policy.
The euro fell to $1.2002 , its lowest since June 2010, after Draghi told the German financial newspaper Handelsblatt that the ECB was less likely to preserve price stability than it was six months ago, suggesting it was ready to take bolder steps on monetary stimulus early this year.
"Markets and commentators have been talking about this for ages, but to hear it from the horse's mouth has had a clear effect on the euro," said David Rodriguez, a quantitative strategist at DailyFX.com, a unit of retail FX broker FXCM in New York.
The euro zone single currency was also hurt by disappointing euro zone manufacturing data. The dollar index, which measures the greenback against a basket of six major currencies, hit a fresh nearly nine-year high of 91.131 and notched its third straight weekly gain.
The contrast between the U.S. Federal Reserve's path toward rate increases and looser policies in Europe and Japan boosted the dollar last year, and many analysts anticipate that divergence in policy to fuel a continued dollar rally in 2015.
The dollar hit parity, or equal value, with the Swiss franc for the first time in over four years. Draghi's comments put pressure on Switzerland's central bank to ease further in order to maintain a 1.20-franc-per-euro limit, said Alan Ruskin, global head of currency strategy at Deutsche Bank in New York.
The SNB imposed that limit in 2011, when the currency's strength squeezed exporters and threatened deflation. The SNB eased policy on Dec. 18, when it said it would impose an interest rate of -0.25 percent on some large deposits held by investors in francs.
Sterling hit a 17-month low of $1.5328 after data showed British manufacturing expanded less than expected in December.
Currently CFTC data does not show yet many changes. Data on 16th of December has shown large contraction of positions – as longs as shorts. Right now we see that Open Interest has increased slightly and it corresponds to growth in short positions, while longs stand flat. Still this data stands for 23rd. It is interesting to see what changes will come on current week when investors will start to return back on markets after holidays.
Open interest:
Recently we’ve made wide comments on complex situation around EUR. As we’ve said previously EUR right now stands in center of geopolitical and economical turmoil and we have mutual 2-side relations EU-US and EU-Russia. And progress of these relations develops not very positive. Shortly speaking US freely gives the law to EU because de facto EU is not totally independent.
Economically US and EU drives on opposite courses. While US is tending to starting rate hiking cycle in mid 2015, ECB gives comments on QE and increasing of balance to the level of March 2012 and this assumes QE on approximately 3 Trln EUR. Recent Draghi comments gives small room for ECB maneuvers.
Here guys, I will not repeat again all things that we’ve discussed in recent 2 months. Shortly speaking EUR enters in tough times. Geopolitical tensions hit EU economy, since US and EU interests are totally opposite. EU wants stability on its Eastern borders and it does not want to maintain Ukraine on balance, while US interests are quite different here.
In economy sphere we mostly watch for two major events – details on ECB QE that should be announced on 22nd of January, second – impact of Fed rate policy on EUR. The major concern here how EUR will behave in this whitewater of financial events. Probably we need to explain a bit. At first glance it seems all simple – US will start rise rate and hence EUR should fall even deeper. But this is not quite so. We suspect that this will be true only till the moment of first rate hiking by Fed. We suspect that starting of QE program by ECB will attract a lot of investors who will want to make easy money. As US experience of QE shows, real Central Bank money mostly was put in equities but not in long-term loans of real industrial sector, population, manufacturing and etc. This has led to huge bubble on US equities. We suspect that something of this sort could appear on EU equities. Initially it will be gradual. But as soon as Fed will start to increase rates capital will start to flow to EU. As amount of money will increase this will lead to additional demand on EUR and here drop of EUR could stop, or at least will loose its pace, despite opposite courses in rate policy…
Currently it is very difficult to predict how definitely this will happen; we just mention common view on this situation. But what we do know that this will not be as simple as “US rising rates while EU not, hence USD will dominate over EUR”.
Technicals
Monthly
As New Year has started today guys, we will update our Yearly Pivots for EUR and take a look and monthly chart of Dollar Index as well. In 2014 EUR has broken through all yearly pivots, including YPS1. Usually this points on validity of existing bearish trend and assumes further downward continuation in 2015.
Now is the time to take wider view on monthly chart since our tactical targets have been achieved. Currently EUR provides a lot of different patterns and setups that we will keep an eye on in 2015. First of all, we will continue to monitor most recent AB=CD pattern. As market is passing through 0.618 target without any respect, next target is 100% and it stands at all time major 5/8 1.12 area. Also take a look that current 1.21-1.22 area is not just AB-CD target, this is Agreement support with favorite 50% level. Actually it is not the fact yet that market has passed it totally. And here we will be watching for another pattern. Recent thrust down on monthly chart seems suitable for DiNapoli directional pattern. As new YPP stands at 1.2730, that is above current market – B&B “Sell” seems possible.
Finally, we will be watching for butterfly “Buy” pattern that stands in Agreement with AB=CD and Fib support. This will be also an area of monthly oversold. This will be our ultimate target in 2015. It stands just slightly below YPS1=1.1467.
Now take a look also on dollar index. Here was our analysis on 2011 that now has hit target:
https://www.forexpeacearmy.com/forex-forum/sive-morten-analysis/17534-forex-pro-weekly-october-31-november-04-2011-a.html
Now let’s take a look at monthly chart of dollar index. Our upside AB=CD and bullish quarterly grabber have been completed. In general dollar index shows mirror chart to EUR currency – with the same Butterfly and targets…
Still guys, this sounds very good when we speak on big picture. What we’re going to do in short term, particularly on next week?
Well, first we need to get clear notification that EUR has passed through 1.21-1.22 area and now respect will follow… Currently it is not the fact yet. If we will get any reversal patterns on daily chart – this could become B&B “Sell” that we’ve mentioned above…
Weekly
Here EUR has tried to turn to consolidation around our former 1.22 target but Draghi comments has push it lower and market moved below this level. Trend has turned bearish here again.
On weekly chart we’re mostly interested with two levels. 1.1950-1.20 has primary value for us, since it is stands closer and includes MPS1 and oversold. In fact, probably this level will tell us whether market will show any response on 1.20 monthly Agreement or it will continue move lower. This level is also interesting because it stands slightly below than former lows. So, here we also should watch for W&R that also could be a sign of possible retracement.
Second level is ~1.15. As we do not have any AB-CD’s here, we start to use extensions of retracements. This is not butterfly, just retracement… But 1.15 will be interesting in medium term perspective, but not on coming week. We just need to keep in mind that around 1.15 we have support…
That’s being said, all eyes on possible bullish patterns around 1.1940-1.20…
Daily
When market stands in long and stable downward action sooner or later it will pass and erase all AB-CD targets and patterns. Thus, month ago we have talked on possible butterflies, 3-Drives etc, but right now all of them are gone. On this type of market we usually apply harmonic swings, pivots and patterns on most recent swings.
Above we’ve estimated that 1.1940 will be support that includes weekly oversold and MPS1. Daily chart also points on this level but a bit differently. Thus, 1.1920 area is daily oversold as well, WPS1 and support of long term trend line, that in fact, keeps downward action since it has started around 1.40 area.
Also take a look that most recent swing could be a background for DiNapoli DRPO or B&B “Sell” pattern. That is what we could watch for in short-term. Harmonic swing points that upside target could stand as far as around 1.2250 – right around 50% resistance of most recent swing. So let’s see what will happen in reality and how market will response on 1.1940 support area…
Intraday charts
On Intraday charts, guys, we do not see anything interesting yet. Market just completed downward action and has no enough time yet to form something else or some response. Here we do not have any patterns yet…
Conclusion:
In 2015 it will be interesting to watch on EUR, since overall situation around EU as political as economical is very sophisticated and potentially in carries a lot of opportunities.
In long-term perspective we will be watching for patterns and events that we’ve mentioned in “Monthly” part of our analysis.
In short-term we mostly wonder, whether market will response on current support and will we get some retracement before market will start move to next target…
The technical portion of Sive's analysis owes a great deal to Joe DiNapoli's methods, and uses a number of Joe's proprietary indicators. Please note that Sive's analysis is his own view of the market and is not endorsed by Joe DiNapoli or any related companies.
")
