Yearly Chart EURUSD
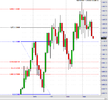
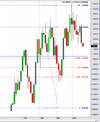
I have a yearly chart of the EURUSD which I found helpful to study. Three things mostly stand out to me. First is the support line from 0.5633 to this year's target at around 1.0836. The second thing I notice is a 3-drive sell pattern. If I understand 3-drive sell targets correctly, the ultimate target of this pattern would be the low of the second drive, or around 0.8209. Third is the ABCD with a target of around 1.0787. I ask Sive for any comments on these points.
I have a yearly chart of the EURUSD which I found helpful to study. Three things mostly stand out to me. First is the support line from 0.5633 to this year's target at around 1.0836. The second thing I notice is a 3-drive sell pattern. If I understand 3-drive sell targets correctly, the ultimate target of this pattern would be the low of the second drive, or around 0.8209. Third is the ABCD with a target of around 1.0787. I ask Sive for any comments on these points.
Attachments
Last edited: