FOREX PRO WEEKLY January 16-20, 2012

Hi Aldo!
I have something interesting on AUD. I think it will be a fake out of the weekly triangle to the Agreement: 78.6 retracement with 61.8 expansion. On H4 this will be the completion of the Butterfly sell.
Interesting indeed, I'm not used to trading butterflies, is it ok in harmony?
 
before i hit the sack (am totally beat--4.30 AM here) i would like to summarize what we have right now:

1- market did not take out the high of 2884
2- market did not manage to close above WR1 (well, here in asia, maybe by the time NY closes it will?)
3- but did cross weekly pivot (2715) and is holding above it (for now)
4- we have at least 2 AB=CD patterns pointing in 2 different directions (M15 and H1)
5- on H1, we have a possible completion of left wing of a BUY butterfly or gartley, which could turn into a deep crab/butterfly (however you want to call it) if right wing extends all the way down to the 161.8 fib retrace from move [2649-2805]
6- on M15, there's a minor AB=CD pattern going from A=2712/B=2753/C=2728
7- on H4, ichimoku cloud has provided solid RSST and we are still in bear territory (under the kumo and tenkan has not crossed kijun to the upside, senkou span is still bearish)
8- but on H4 market is still finding SPPT at mid-BB, MACD hasn't turned bearish although momentum is waning, and williams R% < -50
9- down trend line on daily has provided RSST and held mr market back


that's all the major stuff i can see at the moment. so where does that leave us?
 
Last edited:
Too many indicators, Triantus, book a rest. I was re-reading monday's Sive's analysis, if we don´t get to the top of broadening pattern, probably we go south. Stocks and AUD are taking a beating right now, EUR still holding somehow.
 
Sive,

Let's say market moves ABOVE the 25x5 on the H4. From your experience, does the 25x5 serve as a good support once price has gone above it? And the same thing when market moves BELOW the 25x5? Would it serve as a solid resistance?

Thanks!
 
Sorry for the double post. I was just wondering if the formation on the hourly chart would be considered a "Double Bottom" or am I totally wrong?

Thanks!

fpa.jpg
 
Just curious what you all think and Sive if your listening :)

Does this look like a good context for a bread & butter buy on the 1 hour EUR/USD chart (as of 10:45 am EST)

Thanks and Happy PipN! (o:
~Markus

View attachment 4646

Hi Markus, thrust has sufficient number of bars, nice separation from 3x3, but the nature of thrust is not perfect - strong bar, pause, another strong bar. So, probably it will be better to treat it as B&B LAL. Still it has not bad chances to success.

Sive,

Let's say market moves ABOVE the 25x5 on the H4. From your experience, does the 25x5 serve as a good support once price has gone above it? And the same thing when market moves BELOW the 25x5? Would it serve as a solid resistance?

Thanks!
BeeKay,
Usually, 25x5 works as resistance/support at first, may be second touch, since it's breakout can be a sign of reversal in rather long range of time. Personally I do not use 25x5 on intraday charts. For me it useful on monthly charts, when market shows explosive moves up or down to catch the moment of possible solid retracement or even reversal.

Sorry for the double post. I was just wondering if the formation on the hourly chart would be considered a "Double Bottom" or am I totally wrong?

Thanks!

View attachment 4653

Yes, it looks so, but on 15 min chart I suppose, Besides, it already has reached its target
 
EUR/USD Daily Update, Wed 18, January 2012

Good morning,
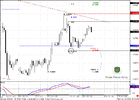
on daily time frame there is not much new. One thing that seems important is that yesterday market has failed to shift trend to bullish. If today we will see the same, and market will close below MACDP (red line) around 1.2650 - this shift probability to downward breakout.

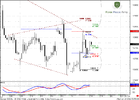
4-hour time frame is bullish. We see fast AB=CD pattern with target at Agreement 1.2860-1.2880 - that is above pivot resistance and, what is more important, above upper border of long-term downward parallel channel on daily time frame. Currently there are unsufficient signs of market's strength, there is not enough confidence in bullish ambitions of the market and it has to prove us that they are really exist by some upward acceleration.

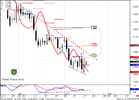
hourly time frame trend is also bullish, here is a potential for butterfly "sell' pattern. You, probably also see it.

In general, market gives us very important advantage - low at 1.2713. Why this is advantage? If market will move below it - it will erase all bullish hopes by single move. It will erase current AB-CD, Butterfly, shift intraday trend to bearish and move below pivot. AS I've said, if it will even proceed to 1.2650 and confirm daily trend as bearish - that will be solid impact on bulls.
So, today our focus on 1.2713, or from the other side - breakout of pivot resistance and upper border of channel
 

Attachments

  • EUR_1H_18_01_12.PNG
    EUR_1H_18_01_12.PNG
    40.9 KB · Views: 87
  • EUR_4H_18_01_12.PNG
    EUR_4H_18_01_12.PNG
    43.1 KB · Views: 81
  • EUR_D_18_01_12.PNG
    EUR_D_18_01_12.PNG
    44.3 KB · Views: 79
Back
Top