Sive Morten
Special Consultant to the FPA
- Messages
- 18,760
Monthly
As Reuters reports, the dollar rose on Friday, pushing the euro to a seven-week low, after fresh U.S. data supported the view the world's largest economy is improving enough to keep the Federal Reserve's stimulus-reducing measures on track. U.S. industrial output rose at its fastest clip in 3-1/2 years in the fourth quarter, data showed Friday. Housing starts dropped 9.8 percent in December, the largest percentage decline since April, but housing starts were coming off a multi-year high in November. The dollar index, a gauge of the dollar's value versus six major currencies, rose 0.4 percent to 81.232. In afternoon trading, the yen was keeping pace with the dollar, as the greenback traded down 0.03 percent to 104.31 yen.
"Overall, the U.S. economy is making steady, if uneven, progress and that should keep intact expectations for sustained Fed tapering this year," said Joe Manimbo, senior market analyst at Western Union Business Solutions in Washington. "U.S. Treasury yields haven't budged much, so as long as they hold near their elevated levels, that should continue to underpin the dollar."
Traders said part of the drop could be technical in nature, as the euro fell below its 100-day moving average of $1.3563. But they also pointed to the pickup in the U.S. economy. "Fundamentally we're more negative on the euro than the U.S. We think the euro should weaken," said Shaun Osborne, chief foreign exchange strategist at TD Securities in Toronto. "There's been some tightness in the funding markets (in the euro zone) over the turn of the year and that's resulted in some upward movement in short-term interest rates. And that's probably being reflected in the exchange rate to a degree," he said.
"In our G-10 valuation table it is the New Zealand dollar that now tops the list as the most over-valued currency," Bank of Tokyo-Mitsubishi UFJ analyst Derek Halpenny said. "Given how well priced an RBNZ rate hike is this year, we would not expect strong buying from current levels if the RBNZ does hike this year."
Technical
Monthly chart finally starts to take some shape. Most recent decrease could give us engulfing pattern that will provide us with two advantages. First is – pattern could trigger downward move and second – invalidation point will become clearer and definite. But still, there is two weeks till the end of January.
Rest of analysis still stands the same. Appearing of YPP=1.3475 in current situation could play significant part on our analysis. As we know that price always gravitates to pivot, this moment significantly increases the probability of more extended move down in short-term perspective.
Although we see solid downward action right now, but since monthly time frame is really big picture – this move has no drastical value yet. Most important here is recent 3-4 candles. Previously we’ve said that until market stands around current highs and above 1.33 chances on upward continuation still exists.
If we will follow to market mechanics, we’ll see that currently market should not show any solid retracement down. Any move of this kind should be treated as market weakness and it will increase probability of reversal. Take a look that as market has hit minor 0.618 AB-CD extension target right at rock hard resistance – Fib level and Agreement and former yearly PR1, it has shown reasonable bounce down and now it has tested it again. As retracement after 0.618 target already has happened, it is unlogical and unreasonable to see another deep bounce and it will look suspicious. Right now market still stands on the edge here. From one point of view price has failed to break up, but from another one – it still stands very close to previous highs. Thus, by looking at monthly chart we can’t say yet that price has reversed down already. This time frame can’t point us long-term direction yet, although MACD trend holds bullish. At the same time appearing of bearish engulfing pattern could shed more bearish light on monthly situation, we’ll see...

Weekly
Here we have inside week as well. Trend is bearish. In general, our long-term analysis here still the same, since nothing has changed yet.
As EUR still holds around previous highs it’s very difficult to say “this is definitely reversal” or “this is definitely continuation”. Here we have to estimate clear conditions when we can treat price action as reversal and when it will be continuation. Signs and patterns that EUR shows us now have more bearish sentiment, rather than bullish. Here what we have – Butterfly “Sell” is forming right around major monthly resistance, price still can’t pass through it. Current AB-CD pattern has reached minor 0.618 target, but CD leg is much flatter than AB and this is the sign of weakness. On previous week trend has turned bearish and we’ve got bearish divergence here right at monthly resistance. As previous move down was solid and in fact, engulfs the action of previous 4-5 weeks, chances on reaching butterfly target become blur.
Our ideal criteria of reversal was to see butterfly completion and then – move below 1.33 lows. By looking at current action I’m not as sure with butterfly’s completion. Thus, we need at least move below 1.33 lows. In this case we will get reversal swing on weekly chart that could become at least something that could confirm downward ambitions.
Conversely, to speak about upward continuation, we need to get fulfilling of two conditions as well – market should coil around previous tops without significant retracement, and second – move above 1.3980 – butterfly 1.27 target. In this case next target will be right around 1.43-1.44 – weekly AB-CD, Yearly PR1 and butterfly 1.618. While market will stand inside of specified ranges – we can trade it based on lower time frame (daily and hourly) patterns and setups.
In shorter term, we can make two major conculsions here. First one is - engulfing pattern has been triggered by price, since it has moved under it’s low. Now we can start to speak about extension and possible targets. Second – market now stands below MPS1. If it will hold there and price will finish January below it – this moment will suggest further downward continuation. So, watch for this moment closely.

Daily
Daily picture looks clear enough. Our stop grabber has worked well and we were right on entry point around 1.3650 as it was really solid resistance area. Market has stopped its move down due 5/8 major support level. Still, as market stands slightly above minor 0.618 Fib extension, price should reach it in nearest future.
At the same time it is not much sense to discuss next target, since it stands beyond daily oversold. Thus, our major object is 1.3475 area – Yearly Pivot point, WPS1, AB-CD target and look – daily oversold. This sounds impressive. So, may be we will lucky and market will give us another possibility for short entry or add to existed position.

4-hour
Here trend is bearish as well. We have another pattern that makes support around 1.3450-1.3475 area even stronger – this is potentially reversal Butterfly “buy” pattern, that has 1.618 extension in the same area. And yes, smaller AB=CD stands in the same area.

1-hour
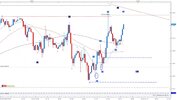
So as we expect shy bounce up, current situation on hourly chart looks very promising. First of all, we have thurst down that is suitable for DiNapoli either DRPO or B&B. Now we need just watch what it will be. If we will get DRPO, then most probable level that market could reach is WPP, 1.3580 Fib resistance. IF we will get B&B “Sell”, then I would mostly watch for 1.3555-1.3565 Fib levels.

Conclusion:
Despite all positive recent USD data action on EUR does not suggest yet total and final reversal. Price still coiling around edge point and currently chances exist as for upward breakout as for downward reversal, although in recent time downward direction has become dominate. To rely on direction whatever it will be, we need to get clear patterns that could confirm it and point extended targets for us. But we do not have them yet.
Until this will not happen, we probably will have to deal with scalp fast trades on daily chart and lower ones. Thus, approximately we can assume that move above current highs will suggest upward continuation, while breakout below 1.33 will be first sign of possible downward reversal on long-term charts.
In shorter-term perspective market shows solid move down that probably will continue. Appearing of Yearly PP around 1.3475 makes it’s reaching very probable. Thus, in the beginning of the week we expect shy upward bounce where, as we’ve suggested downward action to Yearly Pivot (1.3475) could be re-established. That is our short-term view.
The technical portion of Sive's analysis owes a great deal to Joe DiNapoli's methods, and uses a number of Joe's proprietary indicators. Please note that Sive's analysis is his own view of the market and is not endorsed by Joe DiNapoli or any related companies.
As Reuters reports, the dollar rose on Friday, pushing the euro to a seven-week low, after fresh U.S. data supported the view the world's largest economy is improving enough to keep the Federal Reserve's stimulus-reducing measures on track. U.S. industrial output rose at its fastest clip in 3-1/2 years in the fourth quarter, data showed Friday. Housing starts dropped 9.8 percent in December, the largest percentage decline since April, but housing starts were coming off a multi-year high in November. The dollar index, a gauge of the dollar's value versus six major currencies, rose 0.4 percent to 81.232. In afternoon trading, the yen was keeping pace with the dollar, as the greenback traded down 0.03 percent to 104.31 yen.
"Overall, the U.S. economy is making steady, if uneven, progress and that should keep intact expectations for sustained Fed tapering this year," said Joe Manimbo, senior market analyst at Western Union Business Solutions in Washington. "U.S. Treasury yields haven't budged much, so as long as they hold near their elevated levels, that should continue to underpin the dollar."
Traders said part of the drop could be technical in nature, as the euro fell below its 100-day moving average of $1.3563. But they also pointed to the pickup in the U.S. economy. "Fundamentally we're more negative on the euro than the U.S. We think the euro should weaken," said Shaun Osborne, chief foreign exchange strategist at TD Securities in Toronto. "There's been some tightness in the funding markets (in the euro zone) over the turn of the year and that's resulted in some upward movement in short-term interest rates. And that's probably being reflected in the exchange rate to a degree," he said.
"In our G-10 valuation table it is the New Zealand dollar that now tops the list as the most over-valued currency," Bank of Tokyo-Mitsubishi UFJ analyst Derek Halpenny said. "Given how well priced an RBNZ rate hike is this year, we would not expect strong buying from current levels if the RBNZ does hike this year."
Technical
Monthly chart finally starts to take some shape. Most recent decrease could give us engulfing pattern that will provide us with two advantages. First is – pattern could trigger downward move and second – invalidation point will become clearer and definite. But still, there is two weeks till the end of January.
Rest of analysis still stands the same. Appearing of YPP=1.3475 in current situation could play significant part on our analysis. As we know that price always gravitates to pivot, this moment significantly increases the probability of more extended move down in short-term perspective.
Although we see solid downward action right now, but since monthly time frame is really big picture – this move has no drastical value yet. Most important here is recent 3-4 candles. Previously we’ve said that until market stands around current highs and above 1.33 chances on upward continuation still exists.
If we will follow to market mechanics, we’ll see that currently market should not show any solid retracement down. Any move of this kind should be treated as market weakness and it will increase probability of reversal. Take a look that as market has hit minor 0.618 AB-CD extension target right at rock hard resistance – Fib level and Agreement and former yearly PR1, it has shown reasonable bounce down and now it has tested it again. As retracement after 0.618 target already has happened, it is unlogical and unreasonable to see another deep bounce and it will look suspicious. Right now market still stands on the edge here. From one point of view price has failed to break up, but from another one – it still stands very close to previous highs. Thus, by looking at monthly chart we can’t say yet that price has reversed down already. This time frame can’t point us long-term direction yet, although MACD trend holds bullish. At the same time appearing of bearish engulfing pattern could shed more bearish light on monthly situation, we’ll see...
Weekly
Here we have inside week as well. Trend is bearish. In general, our long-term analysis here still the same, since nothing has changed yet.
As EUR still holds around previous highs it’s very difficult to say “this is definitely reversal” or “this is definitely continuation”. Here we have to estimate clear conditions when we can treat price action as reversal and when it will be continuation. Signs and patterns that EUR shows us now have more bearish sentiment, rather than bullish. Here what we have – Butterfly “Sell” is forming right around major monthly resistance, price still can’t pass through it. Current AB-CD pattern has reached minor 0.618 target, but CD leg is much flatter than AB and this is the sign of weakness. On previous week trend has turned bearish and we’ve got bearish divergence here right at monthly resistance. As previous move down was solid and in fact, engulfs the action of previous 4-5 weeks, chances on reaching butterfly target become blur.
Our ideal criteria of reversal was to see butterfly completion and then – move below 1.33 lows. By looking at current action I’m not as sure with butterfly’s completion. Thus, we need at least move below 1.33 lows. In this case we will get reversal swing on weekly chart that could become at least something that could confirm downward ambitions.
Conversely, to speak about upward continuation, we need to get fulfilling of two conditions as well – market should coil around previous tops without significant retracement, and second – move above 1.3980 – butterfly 1.27 target. In this case next target will be right around 1.43-1.44 – weekly AB-CD, Yearly PR1 and butterfly 1.618. While market will stand inside of specified ranges – we can trade it based on lower time frame (daily and hourly) patterns and setups.
In shorter term, we can make two major conculsions here. First one is - engulfing pattern has been triggered by price, since it has moved under it’s low. Now we can start to speak about extension and possible targets. Second – market now stands below MPS1. If it will hold there and price will finish January below it – this moment will suggest further downward continuation. So, watch for this moment closely.
Daily
Daily picture looks clear enough. Our stop grabber has worked well and we were right on entry point around 1.3650 as it was really solid resistance area. Market has stopped its move down due 5/8 major support level. Still, as market stands slightly above minor 0.618 Fib extension, price should reach it in nearest future.
At the same time it is not much sense to discuss next target, since it stands beyond daily oversold. Thus, our major object is 1.3475 area – Yearly Pivot point, WPS1, AB-CD target and look – daily oversold. This sounds impressive. So, may be we will lucky and market will give us another possibility for short entry or add to existed position.
4-hour
Here trend is bearish as well. We have another pattern that makes support around 1.3450-1.3475 area even stronger – this is potentially reversal Butterfly “buy” pattern, that has 1.618 extension in the same area. And yes, smaller AB=CD stands in the same area.
1-hour
So as we expect shy bounce up, current situation on hourly chart looks very promising. First of all, we have thurst down that is suitable for DiNapoli either DRPO or B&B. Now we need just watch what it will be. If we will get DRPO, then most probable level that market could reach is WPP, 1.3580 Fib resistance. IF we will get B&B “Sell”, then I would mostly watch for 1.3555-1.3565 Fib levels.
Conclusion:
Despite all positive recent USD data action on EUR does not suggest yet total and final reversal. Price still coiling around edge point and currently chances exist as for upward breakout as for downward reversal, although in recent time downward direction has become dominate. To rely on direction whatever it will be, we need to get clear patterns that could confirm it and point extended targets for us. But we do not have them yet.
Until this will not happen, we probably will have to deal with scalp fast trades on daily chart and lower ones. Thus, approximately we can assume that move above current highs will suggest upward continuation, while breakout below 1.33 will be first sign of possible downward reversal on long-term charts.
In shorter-term perspective market shows solid move down that probably will continue. Appearing of Yearly PP around 1.3475 makes it’s reaching very probable. Thus, in the beginning of the week we expect shy upward bounce where, as we’ve suggested downward action to Yearly Pivot (1.3475) could be re-established. That is our short-term view.
The technical portion of Sive's analysis owes a great deal to Joe DiNapoli's methods, and uses a number of Joe's proprietary indicators. Please note that Sive's analysis is his own view of the market and is not endorsed by Joe DiNapoli or any related companies.


") . Anyway, current action up is sufficient and enough as respect of 1.27 butterfly target. Simple setup here is the same - market should not move above 1.3605-1.3610, WPP, since this will stand against normal bearish development.
. Anyway, current action up is sufficient and enough as respect of 1.27 butterfly target. Simple setup here is the same - market should not move above 1.3605-1.3610, WPP, since this will stand against normal bearish development.