FOREX PRO Weekly, January 24-28, 2011

repeat praise

Sive
To be frank.
You are simply a professional trader.
Patient in taking decision.
Honestly words are not sufficient to express my appreciation to U and FPA.
I say thanks. You are wonderful.
WELL
Just had to repeat this and add my Thanks for all your valuable :Defforts
Ray
 
EUR and Swissie daily update, Tue 25, January 2011

Hi,
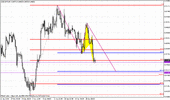
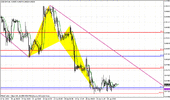
Let's start from CHF. Market currently shows deep retracement and has reached 0.618 support area. From the perspective of RRT pattern deeper retracement unwelcomed. From the perspective weekly bullish engulfing rather - it' ok, because pattern will be canceled only if market will take out the low of this pattern.
Currently on CHF there are two level that we should watch for potential Buy signals:
1. Current level - this is combination of 1.27 target of Butterfly (although its not perfect) and 0.618 support
2. 0.94-0.9430 area - target of AB-CD, 0.786 Fib support and 1.618 target of the same butterfly.
If market will not hold at 0.94 - I think that weekly engulfing pattern will be destroyed.

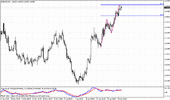
On EUR - be ready for possible Sell signals, because market has accomplished 4-hour AB-CD that we've discussed already. I just want to remind you that above this area at 1.3730 are weekly pivot resistance 1, daily Fib resistance and 1.27 target from the same ABC pattern.
if market will not fail here and continue upmove - this will tell us something different. In this case we should wait for some clear signals, that could confirm further upmove.
 

Attachments

  • chf_4h_25_01_11.gif
    chf_4h_25_01_11.gif
    26.3 KB · Views: 329
  • eur_4h_25_01_11.gif
    eur_4h_25_01_11.gif
    23.6 KB · Views: 328
USDCHF Monthly

Hi Sive,

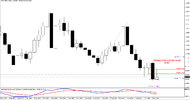
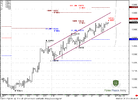
Monthly USDCHF, shows a double top, lower close. Price this month reached .618 ret, almost to the pip and now is coming back forming a bearish pattern again.
Price is flirting with the .94 level you mention on your analysis.
Do you think that could hold?
Seems to me that price action is heavily bearish and it could go to 100% target of .9016 after breaching previous lows.
Nevertheless, like you said, .94 is the level to monitor.
Thank you for everything!

Greetings Sive, see ya round...!!! :D
 

Attachments

  • UC-Monthy.jpg
    UC-Monthy.jpg
    238.5 KB · Views: 292
EUR/USD Daily Update, Wed 26, January 2011

Good morning,
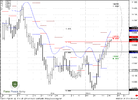
Although EUR has reached 1.3690 AB-CD target I do not see any reversal pattern and Sell signals yet. We can't exclude the possibility that up move will continue.

Currently, all that we can do is just point resistance levels.
First, 1.3720-1.3730 resistance - includes 0.618 daily Fib resistance and weekly pivot resistance 1.

If market will break it to the upside -the next level 1.3820 and 1.3870 - these are different targets from daily Butterfly and intraday ABC's.
 

Attachments

  • EUR_D_26_01_11.PNG
    EUR_D_26_01_11.PNG
    48.4 KB · Views: 255
  • EUR_4H_26_01_11.PNG
    EUR_4H_26_01_11.PNG
    40.4 KB · Views: 262
re u/chf

Sive when do you think/see the u/chf will go back up again -
am embarressed to tell you that iI am in a 98.90 trade for quite some time and it seems to want to go to 93 ouch,
Have decided to wait until it goes back up and trade out- but would like to hear your view or may be you have a ballpark figure in mind you are willing to share. Thank you for all the fabulous information you give us so generously, although I am not a good trader- you are much apreciated.:)
 
USD/CHF Daily Update, Thu 27, January 2011

Hi,
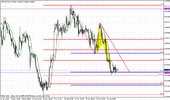
Swiss franc has reached our second previously predetermined area of support, that includes 0.786 Fib support, AB-CD target and 1.618 target of Butterfly.
And market currently is forming DRPO Buy, although there is no second upper penetration of 3x3 DMA and confirmation bar yet.
If market will not show second close above 3x3 - then there will not be any DRPO.

On the hourly chart you can clearly see this butterfly...

Now, if&when market will show second close above the green line (i.e. 3x3 DMA) we can enter on the long side. DRPO pattern allows us to place relatively tight stop - it should be below 0.618 (i prefer 0.786) from the lowest point of the thrust, to the high of confirmation bar.

If market after that will close below this level and stops will be triggered - this DRPO could turn to DRPO Failure pattern. This is an opposite dircetional signal. In this case you may act twofold - first - close Longs and stay aside, second - close Longs and open Shorts. Anyway -do not stay against this - follow to DRPO failure if it will happen, or stay flat, don't be Long.
 

Attachments

  • chf_4h_27_01_11.gif
    chf_4h_27_01_11.gif
    31.2 KB · Views: 211
  • chf_1h_27_01_11.gif
    chf_1h_27_01_11.gif
    31.7 KB · Views: 206
Good work Sive as usual.

Sive.
Thanks as usual.
FPA as Thought me money is important but the life of men you touch is far more more important than money itself.
I dont in anyway write to praise or flatter Sive Or FPA but I strongly write to express my appreciation for thier priceless work.
I say Thanks and Thanks.
Good Work.
 
USD/CHF Daily Update, Fri 28, January 2011

Greetings,
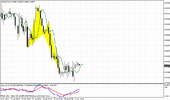
Franc has shown 4-hour DRPO confirmation. So, if you have a bullish view - you can take this signal with stops around 0.9405-0.9410 (below 0.618 support of confirmation bar). You can enter at market or wait for some retracement from the recent swing up on 4-hour chart - market already stands at 0.382 support btw.

Concerning the targets - now we have only 0.9750 possible target - this is 1.27 one from hourly butterfly. But, possibly we will see shallow targets, when market will show some ABC's...

If market will break 0.9405-0.9410 level at close (i.e. close below it) at 4 hour chart - close Longs, and stay flat/enter short. This will be DRPO failure pattern.

DRPO failure happens very often, especially on intraday charts, but still ordinary DRPO has nice risk/reward ratio and it worthy to be traded.
 

Attachments

  • chf_4h_28_01_11.gif
    chf_4h_28_01_11.gif
    24.8 KB · Views: 134
  • chf_1h1_28_01_11.gif
    chf_1h1_28_01_11.gif
    26.1 KB · Views: 134
Last edited:
Hello Sive,
The 3x3 moving average that you refer to a lot. Is that a simple or exponential moving average?
Thanks
 
Back
Top