Sive Morten
Special Consultant to the FPA
- Messages
- 18,719
Fundamentals
(Reuters) The U.S. dollar tumbled against the safe-haven yen on Friday as a plunge in benchmark U.S. Treasury yields reduced the attractiveness of U.S. debt and traders expected dovish Federal Reserve policy through this year, while sterling dipped.
The dollar was last down 0.8 percent at 102.47 yen, near a session low of 102.44 hit in early trading. The dollar index, which measures the greenback against a basket of six major rivals, was last down 0.5 percent at 95.700.
U.S. 30-year Treasury yields hit their lowest since the 1950s, at 2.189 percent, in a worldwide scramble for bonds on expectations of weak global growth and more policy stimulus from major central banks. Benchmark U.S. 10-year Treasury yields nearly matched their record low of 1.381 percent.
"Dollar/yen is a highly sensitive yield play, so the plunge in U.S. Treasury yields is boosting the yen," said Joe Manimbo, senior market analyst at Western Union Business Solutions in Washington.
Analysts also said significantly reduced expectations that the Fed would raise rates this year in the wake of Britain's surprise vote last week to exit the European Union hurt the dollar. The euro was last up 0.3 percent against the dollar at $1.1132 after hitting a one-week high of $1.1168 in morning U.S. trading.
"The Brexit situation has completely removed the prospect of further monetary tightening by the Fed for this year at least," said Boris Schlossberg, managing director of FX strategy at BK Asset Management in New York.
Thin liquidity ahead of the Fourth of July holiday weekend in the United Status exaggerated currency moves, analysts said.
Sterling was last down 0.3 percent at $1.3280 after hitting a session low of $1.3244. While sterling hovered above Monday's 31-year low of $1.3122 right after the Brexit vote, analysts said the currency was still hobbling on comments that Bank of England Governor Mark Carney made on Thursday.
Carney said the central bank would probably need to enact more stimulus over the summer, a signal of further action to offset the Brexit shock. His remarks pushed sterling down as much as 1.6 percent on Thursday.
For the week, sterling was set to fall about 3.1 percent against the dollar after posting its worst week against the greenback since January 2009 last week. Despite Friday's losses, the dollar was on track to gain modestly against the yen for the first week in three.
Brexit and the Fed: are all bets really off?
by Fathom Consulting
Here, guys, very interesting research of Labour market in US that shed some light on perspective of inflation (as wage growth) and rate hike. This analysis shows that in reality overall situation is not as pessimistic as it seems by many investors right now and rate still could be increased in December.
In response to last week’s UK referendum result, investors have slashed the already low probabilities previously assigned to the prospect of US interest rate increases. Currently, the chances of a hike even by the end of next year are seen as just 26%. In our view, investors would be wise to consider the possibility that the US labour market is close to full employment.

After last week’s UK referendum, a tightening of US interest rates next month is all but impossible, even if the next nonfarm payrolls report confirms our belief that US job creation rebounded in June. Nevertheless, we think that markets are significantly underestimating the possibility of US rate increases both this year and next.
Last week’s result poses a number of uncertainties, which are unlikely to be resolved any time soon. Financial markets are likely to remain volatile over the summer and global economic growth will probably slow as long as these uncertainties remain. November’s US presidential election will add a further element of unpredictability into the mix.
But federal funds futures prices seem to be implying that the US economy is heading into a recession. We disagree. In fact, we still believe that the domestic economy is relatively strong and that the labour market is close to full employment. Indeed, although US labour market participation has fallen, we estimate that around two thirds of the decline since 2008 is due to demographics and the ageing of the US workforce.
Two thirds of the fall in the US participation rate since 2008 is explained by the ageing of the US population; cyclical and other structural factors explain the rest. Consequently, we think that the US labour market is tight, even though the equilibrium unemployment rate has fallen since 2008. On the basis of this analysis we expect the little remaining labour market slack to be absorbed before long and for wage growth to accelerate this year.

To critics, the persistent fall in the labour market participation rate highlights the fragility of the economy. We take a different view and believe that most of the decline in the participation rate since 2008 is due to structural, not cyclical, factors.
The share of the adult population aged 55 years and over has almost doubled over the last twenty years and the Bureau of Labor Statistics (BLS) expects the ratio to rise further. Since the participation rate of this age group is a lot lower than that of younger groups, it is unsurprising that the participation rate of the overall population continues to fall.

To quantify the effect of the ageing population on the labour market participation rate, we have projected a ‘trend’ participation rate using actual demographic changes and holding within age-band participation rates constant at 2000 levels. This projection is reflected by the yellow line in the first chart, while the blue line is the actual participation rate.
By comparing the two lines, we estimate that around two thirds of the decline in the actual participation rate since September 2008 can be explained by demographics. For the actual participation rate to return to trend, another 1.4 million people would need to enter the labour force. But our trend participation rate may overestimate the degree of slack within the labour market if the participation rates within age groups has fallen for other structural, as opposed to cyclical, reasons since 2000.
The participation rates of the 55 years+ and 16 to 24 year age groups have been moving in opposite directions since the turn of the century. The net result of these movements on the participation rate of the adult population is probably neutral. Moreover, we think that these movements are explained by structural, not cyclical, factors. For example, higher rates of university enrolment probably explain the decline in the participation rate of 16 to 24 year olds.


he participation rate of prime-age workers has fallen too, but we do not think that this is evidence of spare capacity and a fragile economic recovery. Indeed, many of the explanations that are cited for the decline in the participation rate of prime-age men, such as technology, inequality, globalisation, high incarceration rates and a lack of adequate childcare support for working parents, are largely structural, not cyclical, factors. The participation rate of prime-age workers started to decline well before the 2008 financial crisis.

Another means of analysing the degree of slack within the labour market is to consider the number of people that are ‘not in the labour force, but want a job’. A stronger economy would probably cause some of these workers to re-enter the labour force, although many of them will be unable to, for reasons such as family commitments.
The proportion of those ‘not in the labour force, but want a job’ as a share of the population is not especially high by historical standards. For the ratio to fall to 2.0%, its pre-crisis low, less than one million workers would need to enter the labour force. If 200,000 new payrolls continue to be added every month, we estimate that this would take less than eight months to be achieved (after factoring in population growth).

An alternative, and possibly more appropriate, measure of slack might be the number of discouraged workers, which is a subset of the ‘not in the labour force, but want a job’ group. Discouraged workers are people that are not in the labour force and have not looked for work in the last four weeks. The current level of discouraged workers (at 538,000, or 0.21% of the adult population) is not very high by past standards. Assuming this proportion fell to its pre-crisis low of 0.15%, that would be equivalent to 158,000 additional workers entering the work force, which would take only a few months to be absorbed by the labour market.

There are several reasons to believe that the NAIRU may have fallen in the post crisis period. For example, the emergence of online job matching websites such as LinkedIn and the rise of the ‘gig’ economy may enable quicker matches between employers and employees. All else equal, this would imply lower frictional unemployment (one of the two main components of the natural rate of unemployment described by Milton Friedman when he came up with the concept in the 1960s). In addition, rising university enrolment should result in a more educated workforce, which theoretically lowers the natural rate of unemployment too.
Another explanation for the fall in the NAIRU is the ageing of the population. As the following chart shows, the unemployment rate of older workers is a lot lower than that of younger workers. It is therefore plausible that as the US labour force ages, the average unemployment rate should fall. Given the compositional changes to the population since 2008, we estimate that this factor has pushed the NAIRU down by 0.1 percentage points since 2008.

Given the combination of factors discussed, we are comfortable with an estimate of 4.7%, which happens to be the same as the current unemployment rate. Federal Open Market Committee members have cut their estimate of the longer-term unemployment rate (considered by many as their estimate of the NAIRU) from a central range of 5.2% to 6.0% in 2013, to 4.7% to 5.0% today.
To conclude, our analysis suggests that much of this decline can be explained by structural, not cyclical, factors. If true, there is likely to be very little slack left in the labour market, even though the equilibrium unemployment rate has fallen since 2008. Put simply, we think that the labour market is already at, or very near, full employment.
With this in mind, we estimate that average hourly earnings growth will accelerate from 2.5% in the twelve months to May, to over 3.0% by the end of 2016. This will push both core and headline inflation higher this year and next. On this basis, we still believe that there is a realistic prospect of a US rate rise this year, probably in December, with several more to come next year.
The participation rate of prime age workers (those aged 25 to 54 years) has also declined. We suspect that this is also due to structural factors — such as globalisation, technology and inequality — and not cyclical factors, as widely believed. Looking ahead, we anticipate a pick-up in wage growth, pushing both core and headline inflation higher this year and next. On that basis, we still believe that there is a realistic prospect of one US rate rise this year, probably in December, with several more to come next year.
COT Report
Today guys, we will take a look at GBP. Our EUR analysis doesn't need any update by far, as it just has completed 50% upside bounce that we've discussed. Our view on GBP also will not bring any sensation, but mostly will be for short-term perspective.
COT Report shows that market has got some relief after voting has been completed. Speculative short position as well as open interest has decreased slightly. This is logical, because short-term speculators have taken profit, while others still keep short positions. It means that after some minor retracement GBP has solid chances to continue move down.

Currently some analysts already start discussion of possible drop of cable in long term and many of them, including our lovely Fanthom consulting think that pound sterling could even reach 1.1 area within few years and parity with EUR.
Right now we see the crack of global politic system and starting of creation new center of power with Germany-France-Italy-Russia core. First careful statements already have taken place as UK is leaving EU.
With this center of power - EU will get unprecedented economical push since it will get access to huge Russian and Asian market, because Russia is doing the same work with China. So, in perspective of 3-5 years this will be tremendous territory with outstanding economical potential and recourses. This is our long-term view.
Technicals
Monthly
So guys, our long-term forecast, that we've created in 2011 in our Military Forex Course, based on Elliot Waves has been completed:
Long Term Forecast on GBP rate
Right now monthly trend is bearish, but market is not at oversold on monthly chart. We've said that lows will not survive because market has all-time 0.618 AB=CD target below them, so that has happened. Market has dropped and right now stands there, no W&R.
Overall picture looks bearish by some signs. First is - acceleration down to AB-CD target. Usually fast drop on this point tells that market has chances to continue to AB=CD target, which stands at 1.06 area, and we think that it will be reached within some years. The point is if you will take a look at all-time GBP chart, you'll see that market already has broken major 5/8 Fib support and on a way down, drop is really fast since first leg was on 2008 crisis:
That's why technically there is nothing impossible with 1.06 area. - that will be AB=CD on a way down.
Second stands for shorter-term perspective. GBP has dropped below YPS1 and this indicates starting of new bearish trend, not just a retracement down, but trend.
Swings right now are so large, that monthly chart let's us talk on very long-term perspective and does not bring any clarity on shorter-term perspective.
Still we can say one thing - take a look that our 1.3080 target has not been reached for 100 pips though. This is what we will watch for in nearest week.

Weekly
Weekly chart shows very interesting information, and explains why our monthly AB-CD works. Actually guys, here we have rare pattern that calls Volatility Breakout (VOB). Those of you who follows our gold analysis knows that we've traded VOB on gold within 2 years and it has reached it's target around 1000$. Now GBP stands near its target as well:

Weekly chart is strongly oversold right now and major question is - do we have another VOB on Brexit? Usually VOB is absolute breakout as it was in 2008. Current breakout is smaller. But I think that we could treat it as VOB because more than 250 bars (weeks) has passed since first breakout. Although current VOB could be a bit weaker, but stil it could have a downward continuation. It means that market could drop even lower than our monthly 1.3080 target. To understand how much lower - we need to get upside retracement first after VOB, to get AB-CD and calculate 0.618 extension target. So, we will know it within few weeks probably. In fact, upside action from 2008 till 2016 precisely was this "retracement" after VOB... As soon as we've got it - we've estimated 1.3080 target that currently mostly is completed...
That's being said, right now on GBP we have two tasks. First one - finish with our 1.3080 destination. Second - watch for upside bounce and estimate next target on AB-CD that we should get.
Daily
Here we do not have any patterns and could watch only for levels that could become a potential target of upside bounce. Most probable looks 1.3850 area - MPP, former lows and overbought area. Trend is bearish here:

Hourly
At the same time hourly chart shows that upside retracement will not start immediately. Recall that we have uncompleted monthly target. Now hourly chart shows pattern that should lead to its completion. This is butterfly "buy" that makes possible reaching of 1.3080 area:

Conclusion:
That's being said, we confirm our bearish view on GBP that even has become worse as procedure of EU leaving has started. Based on patterns that we have right now we could make a conclusion that this is really possible that cable will reach 1-1.05 area within 3-5 years. Our first 1.3080 target that we've estimated in 2011 has been completed.
In short-term perspective we wait for two major moments. First - hourly butterfly completing and reaching of our 1.3080 target. Second - upside bounce that should give us AB-CD and next downside target.
The technical portion of Sive's analysis owes a great deal to Joe DiNapoli's methods, and uses a number of Joe's proprietary indicators. Please note that Sive's analysis is his own view of the market and is not endorsed by Joe DiNapoli or any related companies.
(Reuters) The U.S. dollar tumbled against the safe-haven yen on Friday as a plunge in benchmark U.S. Treasury yields reduced the attractiveness of U.S. debt and traders expected dovish Federal Reserve policy through this year, while sterling dipped.
The dollar was last down 0.8 percent at 102.47 yen, near a session low of 102.44 hit in early trading. The dollar index, which measures the greenback against a basket of six major rivals, was last down 0.5 percent at 95.700.
U.S. 30-year Treasury yields hit their lowest since the 1950s, at 2.189 percent, in a worldwide scramble for bonds on expectations of weak global growth and more policy stimulus from major central banks. Benchmark U.S. 10-year Treasury yields nearly matched their record low of 1.381 percent.
"Dollar/yen is a highly sensitive yield play, so the plunge in U.S. Treasury yields is boosting the yen," said Joe Manimbo, senior market analyst at Western Union Business Solutions in Washington.
Analysts also said significantly reduced expectations that the Fed would raise rates this year in the wake of Britain's surprise vote last week to exit the European Union hurt the dollar. The euro was last up 0.3 percent against the dollar at $1.1132 after hitting a one-week high of $1.1168 in morning U.S. trading.
"The Brexit situation has completely removed the prospect of further monetary tightening by the Fed for this year at least," said Boris Schlossberg, managing director of FX strategy at BK Asset Management in New York.
Thin liquidity ahead of the Fourth of July holiday weekend in the United Status exaggerated currency moves, analysts said.
Sterling was last down 0.3 percent at $1.3280 after hitting a session low of $1.3244. While sterling hovered above Monday's 31-year low of $1.3122 right after the Brexit vote, analysts said the currency was still hobbling on comments that Bank of England Governor Mark Carney made on Thursday.
Carney said the central bank would probably need to enact more stimulus over the summer, a signal of further action to offset the Brexit shock. His remarks pushed sterling down as much as 1.6 percent on Thursday.
For the week, sterling was set to fall about 3.1 percent against the dollar after posting its worst week against the greenback since January 2009 last week. Despite Friday's losses, the dollar was on track to gain modestly against the yen for the first week in three.
Brexit and the Fed: are all bets really off?
by Fathom Consulting
Here, guys, very interesting research of Labour market in US that shed some light on perspective of inflation (as wage growth) and rate hike. This analysis shows that in reality overall situation is not as pessimistic as it seems by many investors right now and rate still could be increased in December.
In response to last week’s UK referendum result, investors have slashed the already low probabilities previously assigned to the prospect of US interest rate increases. Currently, the chances of a hike even by the end of next year are seen as just 26%. In our view, investors would be wise to consider the possibility that the US labour market is close to full employment.
After last week’s UK referendum, a tightening of US interest rates next month is all but impossible, even if the next nonfarm payrolls report confirms our belief that US job creation rebounded in June. Nevertheless, we think that markets are significantly underestimating the possibility of US rate increases both this year and next.
Last week’s result poses a number of uncertainties, which are unlikely to be resolved any time soon. Financial markets are likely to remain volatile over the summer and global economic growth will probably slow as long as these uncertainties remain. November’s US presidential election will add a further element of unpredictability into the mix.
But federal funds futures prices seem to be implying that the US economy is heading into a recession. We disagree. In fact, we still believe that the domestic economy is relatively strong and that the labour market is close to full employment. Indeed, although US labour market participation has fallen, we estimate that around two thirds of the decline since 2008 is due to demographics and the ageing of the US workforce.
Two thirds of the fall in the US participation rate since 2008 is explained by the ageing of the US population; cyclical and other structural factors explain the rest. Consequently, we think that the US labour market is tight, even though the equilibrium unemployment rate has fallen since 2008. On the basis of this analysis we expect the little remaining labour market slack to be absorbed before long and for wage growth to accelerate this year.
To critics, the persistent fall in the labour market participation rate highlights the fragility of the economy. We take a different view and believe that most of the decline in the participation rate since 2008 is due to structural, not cyclical, factors.
The share of the adult population aged 55 years and over has almost doubled over the last twenty years and the Bureau of Labor Statistics (BLS) expects the ratio to rise further. Since the participation rate of this age group is a lot lower than that of younger groups, it is unsurprising that the participation rate of the overall population continues to fall.
To quantify the effect of the ageing population on the labour market participation rate, we have projected a ‘trend’ participation rate using actual demographic changes and holding within age-band participation rates constant at 2000 levels. This projection is reflected by the yellow line in the first chart, while the blue line is the actual participation rate.
By comparing the two lines, we estimate that around two thirds of the decline in the actual participation rate since September 2008 can be explained by demographics. For the actual participation rate to return to trend, another 1.4 million people would need to enter the labour force. But our trend participation rate may overestimate the degree of slack within the labour market if the participation rates within age groups has fallen for other structural, as opposed to cyclical, reasons since 2000.
The participation rates of the 55 years+ and 16 to 24 year age groups have been moving in opposite directions since the turn of the century. The net result of these movements on the participation rate of the adult population is probably neutral. Moreover, we think that these movements are explained by structural, not cyclical, factors. For example, higher rates of university enrolment probably explain the decline in the participation rate of 16 to 24 year olds.
he participation rate of prime-age workers has fallen too, but we do not think that this is evidence of spare capacity and a fragile economic recovery. Indeed, many of the explanations that are cited for the decline in the participation rate of prime-age men, such as technology, inequality, globalisation, high incarceration rates and a lack of adequate childcare support for working parents, are largely structural, not cyclical, factors. The participation rate of prime-age workers started to decline well before the 2008 financial crisis.
Another means of analysing the degree of slack within the labour market is to consider the number of people that are ‘not in the labour force, but want a job’. A stronger economy would probably cause some of these workers to re-enter the labour force, although many of them will be unable to, for reasons such as family commitments.
The proportion of those ‘not in the labour force, but want a job’ as a share of the population is not especially high by historical standards. For the ratio to fall to 2.0%, its pre-crisis low, less than one million workers would need to enter the labour force. If 200,000 new payrolls continue to be added every month, we estimate that this would take less than eight months to be achieved (after factoring in population growth).
An alternative, and possibly more appropriate, measure of slack might be the number of discouraged workers, which is a subset of the ‘not in the labour force, but want a job’ group. Discouraged workers are people that are not in the labour force and have not looked for work in the last four weeks. The current level of discouraged workers (at 538,000, or 0.21% of the adult population) is not very high by past standards. Assuming this proportion fell to its pre-crisis low of 0.15%, that would be equivalent to 158,000 additional workers entering the work force, which would take only a few months to be absorbed by the labour market.
There are several reasons to believe that the NAIRU may have fallen in the post crisis period. For example, the emergence of online job matching websites such as LinkedIn and the rise of the ‘gig’ economy may enable quicker matches between employers and employees. All else equal, this would imply lower frictional unemployment (one of the two main components of the natural rate of unemployment described by Milton Friedman when he came up with the concept in the 1960s). In addition, rising university enrolment should result in a more educated workforce, which theoretically lowers the natural rate of unemployment too.
Another explanation for the fall in the NAIRU is the ageing of the population. As the following chart shows, the unemployment rate of older workers is a lot lower than that of younger workers. It is therefore plausible that as the US labour force ages, the average unemployment rate should fall. Given the compositional changes to the population since 2008, we estimate that this factor has pushed the NAIRU down by 0.1 percentage points since 2008.
Given the combination of factors discussed, we are comfortable with an estimate of 4.7%, which happens to be the same as the current unemployment rate. Federal Open Market Committee members have cut their estimate of the longer-term unemployment rate (considered by many as their estimate of the NAIRU) from a central range of 5.2% to 6.0% in 2013, to 4.7% to 5.0% today.
To conclude, our analysis suggests that much of this decline can be explained by structural, not cyclical, factors. If true, there is likely to be very little slack left in the labour market, even though the equilibrium unemployment rate has fallen since 2008. Put simply, we think that the labour market is already at, or very near, full employment.
With this in mind, we estimate that average hourly earnings growth will accelerate from 2.5% in the twelve months to May, to over 3.0% by the end of 2016. This will push both core and headline inflation higher this year and next. On this basis, we still believe that there is a realistic prospect of a US rate rise this year, probably in December, with several more to come next year.
The participation rate of prime age workers (those aged 25 to 54 years) has also declined. We suspect that this is also due to structural factors — such as globalisation, technology and inequality — and not cyclical factors, as widely believed. Looking ahead, we anticipate a pick-up in wage growth, pushing both core and headline inflation higher this year and next. On that basis, we still believe that there is a realistic prospect of one US rate rise this year, probably in December, with several more to come next year.
COT Report
Today guys, we will take a look at GBP. Our EUR analysis doesn't need any update by far, as it just has completed 50% upside bounce that we've discussed. Our view on GBP also will not bring any sensation, but mostly will be for short-term perspective.
COT Report shows that market has got some relief after voting has been completed. Speculative short position as well as open interest has decreased slightly. This is logical, because short-term speculators have taken profit, while others still keep short positions. It means that after some minor retracement GBP has solid chances to continue move down.
Currently some analysts already start discussion of possible drop of cable in long term and many of them, including our lovely Fanthom consulting think that pound sterling could even reach 1.1 area within few years and parity with EUR.
Right now we see the crack of global politic system and starting of creation new center of power with Germany-France-Italy-Russia core. First careful statements already have taken place as UK is leaving EU.
With this center of power - EU will get unprecedented economical push since it will get access to huge Russian and Asian market, because Russia is doing the same work with China. So, in perspective of 3-5 years this will be tremendous territory with outstanding economical potential and recourses. This is our long-term view.
Technicals
Monthly
So guys, our long-term forecast, that we've created in 2011 in our Military Forex Course, based on Elliot Waves has been completed:
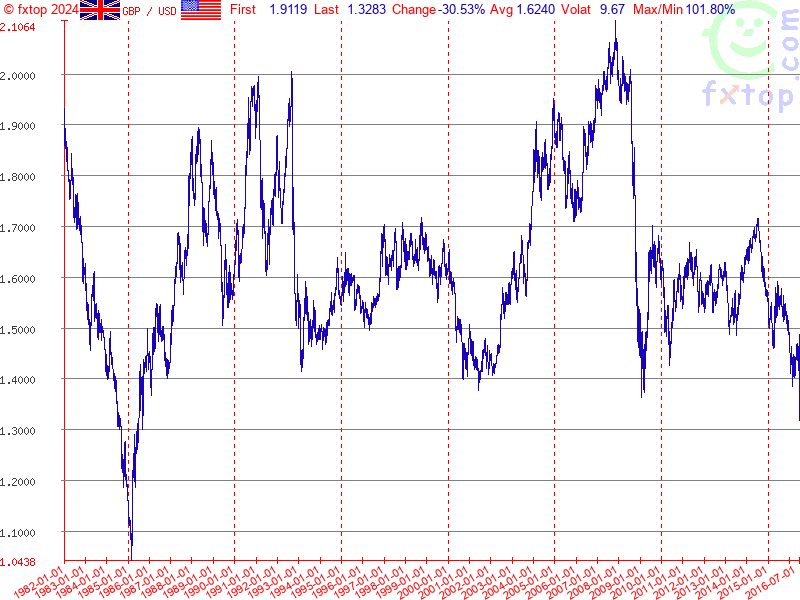
Long Term Forecast on GBP rate
Right now monthly trend is bearish, but market is not at oversold on monthly chart. We've said that lows will not survive because market has all-time 0.618 AB=CD target below them, so that has happened. Market has dropped and right now stands there, no W&R.
Overall picture looks bearish by some signs. First is - acceleration down to AB-CD target. Usually fast drop on this point tells that market has chances to continue to AB=CD target, which stands at 1.06 area, and we think that it will be reached within some years. The point is if you will take a look at all-time GBP chart, you'll see that market already has broken major 5/8 Fib support and on a way down, drop is really fast since first leg was on 2008 crisis:
That's why technically there is nothing impossible with 1.06 area. - that will be AB=CD on a way down.
Second stands for shorter-term perspective. GBP has dropped below YPS1 and this indicates starting of new bearish trend, not just a retracement down, but trend.
Swings right now are so large, that monthly chart let's us talk on very long-term perspective and does not bring any clarity on shorter-term perspective.
Still we can say one thing - take a look that our 1.3080 target has not been reached for 100 pips though. This is what we will watch for in nearest week.
Weekly
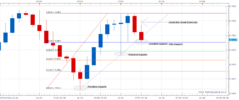
Weekly chart shows very interesting information, and explains why our monthly AB-CD works. Actually guys, here we have rare pattern that calls Volatility Breakout (VOB). Those of you who follows our gold analysis knows that we've traded VOB on gold within 2 years and it has reached it's target around 1000$. Now GBP stands near its target as well:
Weekly chart is strongly oversold right now and major question is - do we have another VOB on Brexit? Usually VOB is absolute breakout as it was in 2008. Current breakout is smaller. But I think that we could treat it as VOB because more than 250 bars (weeks) has passed since first breakout. Although current VOB could be a bit weaker, but stil it could have a downward continuation. It means that market could drop even lower than our monthly 1.3080 target. To understand how much lower - we need to get upside retracement first after VOB, to get AB-CD and calculate 0.618 extension target. So, we will know it within few weeks probably. In fact, upside action from 2008 till 2016 precisely was this "retracement" after VOB... As soon as we've got it - we've estimated 1.3080 target that currently mostly is completed...
That's being said, right now on GBP we have two tasks. First one - finish with our 1.3080 destination. Second - watch for upside bounce and estimate next target on AB-CD that we should get.
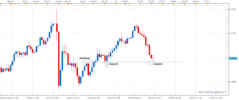
Daily
Here we do not have any patterns and could watch only for levels that could become a potential target of upside bounce. Most probable looks 1.3850 area - MPP, former lows and overbought area. Trend is bearish here:
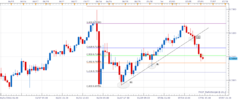
Hourly
At the same time hourly chart shows that upside retracement will not start immediately. Recall that we have uncompleted monthly target. Now hourly chart shows pattern that should lead to its completion. This is butterfly "buy" that makes possible reaching of 1.3080 area:
Conclusion:
That's being said, we confirm our bearish view on GBP that even has become worse as procedure of EU leaving has started. Based on patterns that we have right now we could make a conclusion that this is really possible that cable will reach 1-1.05 area within 3-5 years. Our first 1.3080 target that we've estimated in 2011 has been completed.
In short-term perspective we wait for two major moments. First - hourly butterfly completing and reaching of our 1.3080 target. Second - upside bounce that should give us AB-CD and next downside target.
The technical portion of Sive's analysis owes a great deal to Joe DiNapoli's methods, and uses a number of Joe's proprietary indicators. Please note that Sive's analysis is his own view of the market and is not endorsed by Joe DiNapoli or any related companies.
")