Sive Morten
Special Consultant to the FPA
- Messages
- 18,699
As Reuters reports, the dollar failed to make much headway on Friday after a jump in U.S. job creation left stock markets in an optimistic mood but did not convince traders it would be a trigger for the U.S. Federal Reserve to move toward tighter monetary policy. Sterling, not for the first time in recent months the main weekly winner on major currency markets, was back near six-year highs versus the dollar and against a basket of currencies.
The dollar's failure to launch has been the big disappointment on currency markets this year. Solid U.S. jobs numbers for the fifth month running backed analysts who have begun again to predict it may take off in the coming months. Against that, the euro continues to be backed by inflows of cash into European bond and stock markets and also by talk in the market of buying by Asian central banks, recycling the dollar reserves they are accumulating into other currencies.
After a half-cent swing after the jobs numbers on Thursday, the dollar was just over 0.1 percent higher against the euro at $1.3585 on Friday. "You're getting this sort of muted reaction maybe because no one is that convinced these numbers will really change the Fed's outlook," said Daragh Maher, a strategist with HSBC in London. "It played reasonably well yesterday as a dollar positive, but the scale of the move has not been so big. It has gained, just not that much."
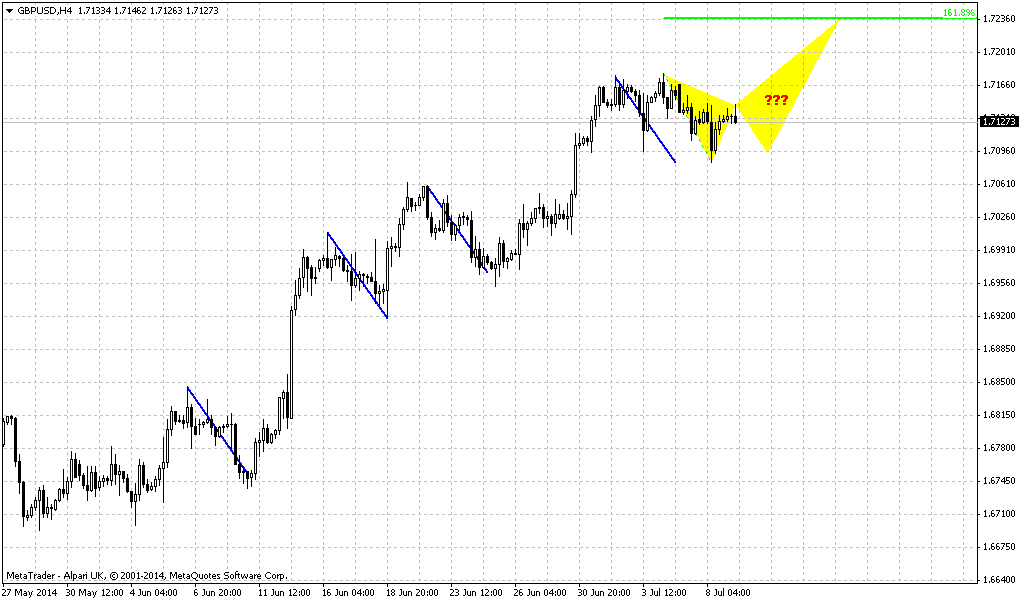
Maher drew parallels with the recent play on sterling, driven higher by investors' conviction that strong UK economic numbers would eventually prompt the Bank of England to shift to a more hawkish tone on interest rates. That seems to have happened in the past month, with Governor Mark Carney and colleagues hinting that the bank could even raise rates for the first time before the end of the year. Fed chief Janet Yellen, however, for now has offered little sign of heading in the same direction. "It seems as though people are slightly more reluctant to take on the Fed in the way we saw with the Bank of England," Maher said. "But maybe there comes a tipping point with data like this where the message has to change."
Considering the strength of U.S. jobs data over the past months, some traders said the failure of the dollar to stage the recovery was a sign that investors felt the U.S. Federal Reserve had no appetite for hiking rates in the near future. It would rather wait for wage inflation to pick up before tightening policy, analysts said. And unless two-year Treasury yields rose sharply, the dollar, which has a good correlation to U.S. yields, was unlikely to push much higher.
Recent concern and muted reaction on really nice NFP data tells that investors will watch closely for two points. First is coming inflation data – retail sale, consumer prices and expenditures. Second is coming July Fed meeting. That probably will be the major event, since there Fed will have to give an assessment and some reaction on recent data.
Technical
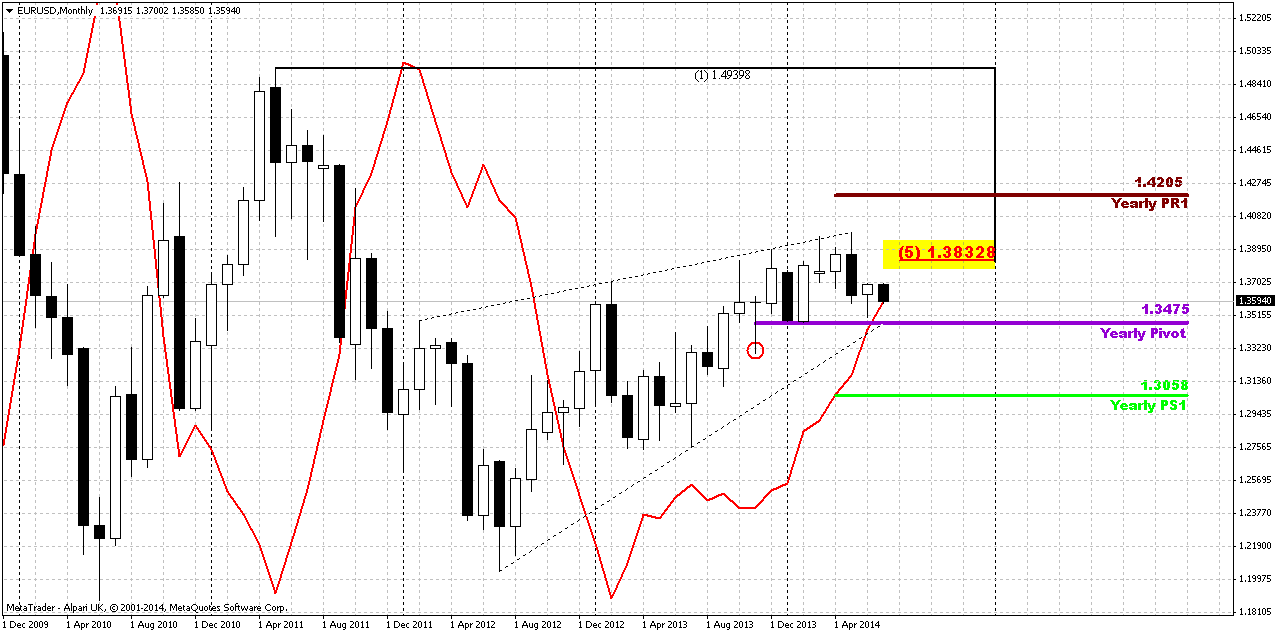
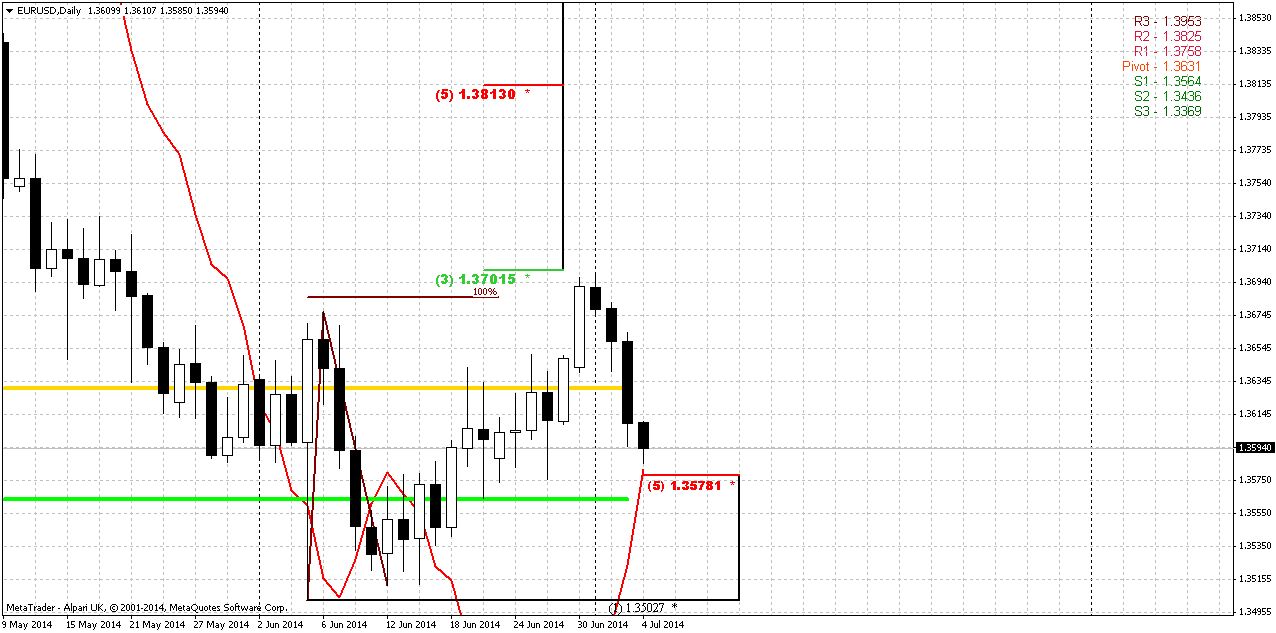
Although in May EUR has formed monthly reversal candle, but in recent time downward action has slowed significantly. As you can see within recent 2-3 weeks monthly picture hardly changes at all. Recently market has returned right back down to YPP area and flirts around it since then. EUR now stands at very significant moment. It has closely approached to Yearly Pivot point and monthly MACDP. If we will get lucky, we could get clarification in July for extended period. Thus, appearing of bullish grabber right at YPP level definitely will tell us that market should exceed 1.40 level and probably even could reach YPR1~1.42 area. Conversely, failure at YPP will be great challenge on further downward action. We didn’t get grabber on June, but right now market already has touched MACDP and not it is a question of 2-3 weeks, whether we will get it or not.
We’re speaking about both scenarios, because right now fundamental comments do not show any agreement in investors’ opinion concerning EUR. Some analysts even think that until US applies dovish policy EUR depreciation will be limited despite how dovish ECB is. Analysts suggest that Fed will keep rates low for longer period then they hint on. And as we’ve mentioned in fundamental part, investors expect that this riddle will be clarified in July.
By looking at bigger picture, market stands in tight range since 2014. Thus, 1.33-1.3850 is an area of “indecision”. While market stands inside of it we can talk about neither upward breakout nor downward reversal. At least, reversal identification could be done with yearly pivot – if market will move below it, this could be early sign of changing sentiment. But, as you can see, nothing among this issues have happened yet.
That’s being said, market stands around crucial area and July could clarify what will happen next.
Weekly
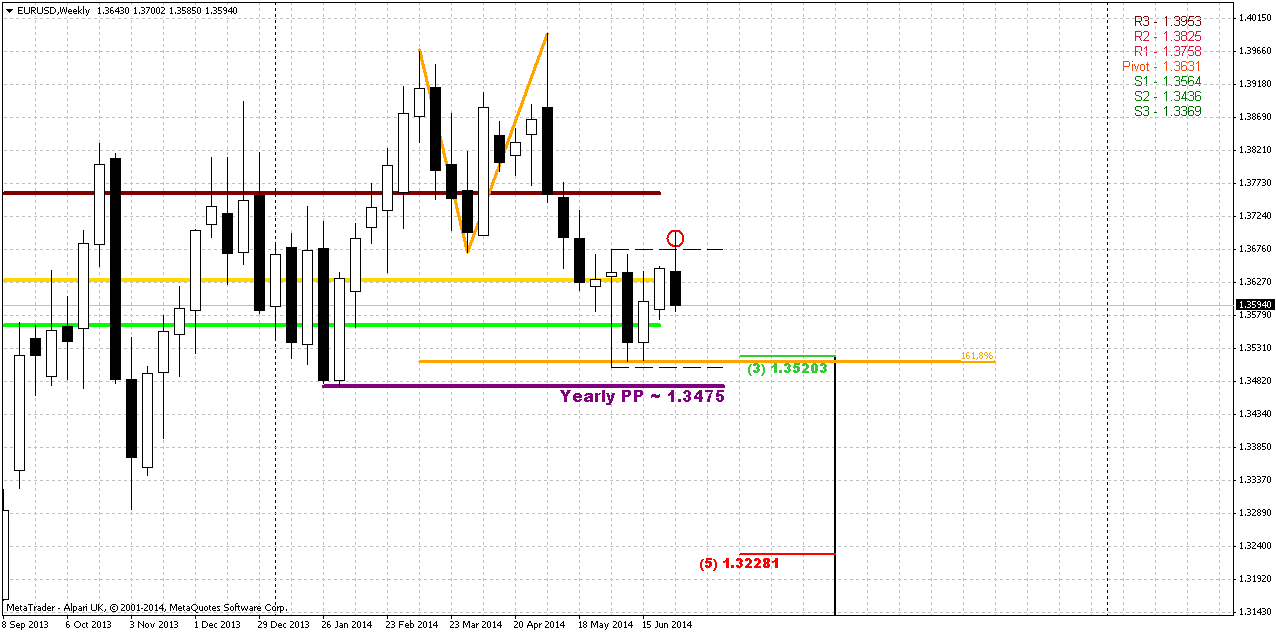
At first glance nothing exceptional has happened, but as you will see a bit later – situation is more sophisticated in reality. Previously we said that when market forms long candle it usually holds following price action for some time, because market needs to accustom to new range. At the same time this will increase potential energy of breakout. After flat placing market breaks with additional power. Also we said that we will point on bearish trend only if market will move below YPP and take out lows of hammer pattern. This also will mean that monthly trend shifts bearish.
Right we have two weekly bearish short-term issues. First one is a failure upward breakout of hammer’s range. Usually when market tries to take out top of some long candle and fails – this leads to action in oposite direction. At least, market will reach the low of this candle, but also it could pass twice length of this bar to the downside.
Second – price stands below MPP. This tells about bearish sentiment. If we wouldn’t have small nuance on CHF, I probably would call you for short entry, but right now, as we said, situation is tricky.
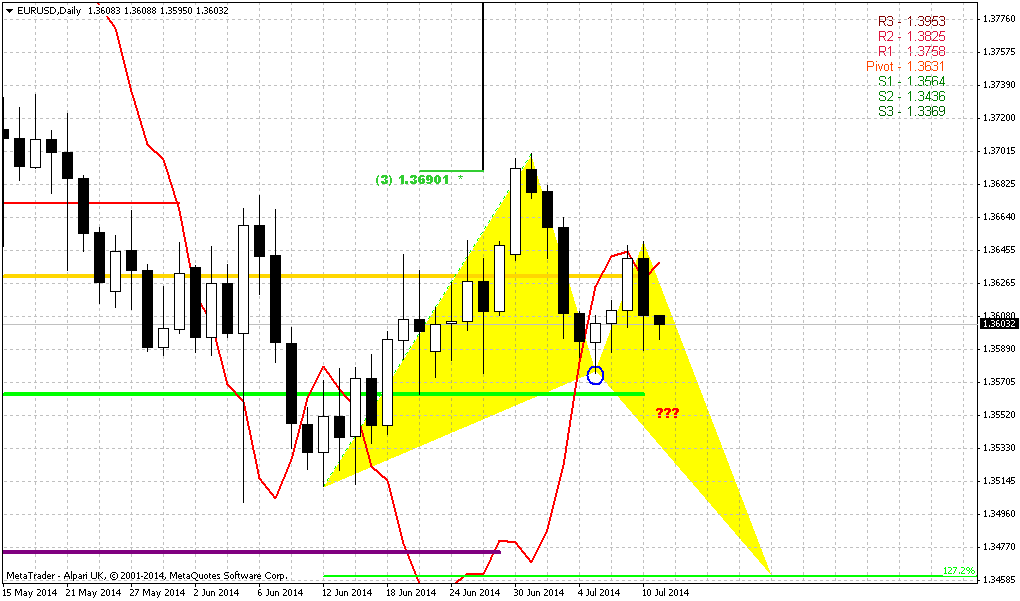
Daily
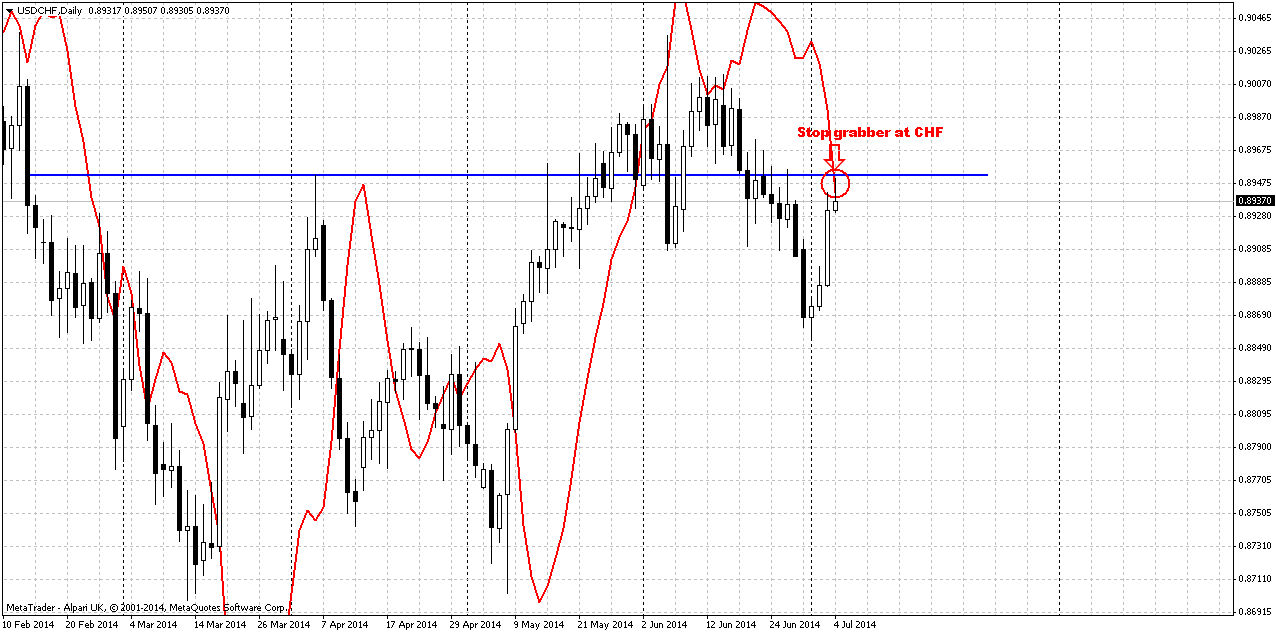
Here guys the trick that makes overall situation complex. Bearish stop grabber at CHF that suggests taking out of 0.8850 lows. Also pay attention where it has appeared – right at neckline of Double Bottom pattern. Price has passed through it and re-tested it from downside. Taking into consideration relation between CHF and EUR – it means that EUR should turn to the upside. Not necessary with the same pace, but direction should be the same, right? But now we have a riddle – how to combine bearish EUR setup on weekly chart and CHF? If we exclude possible failure of CHF grabber (that’s simple), to be honest guys, I see only one possible solution for this – such geopolitical turmoil that will trigger solid demand on safe haven assets. In this case CHF and USD will grow simultaneously and theoretically both pairs could start to move south. Or, as I said – keep an eye on CHF grabber failure. This also will resolve the problem.
Speaking about EUR technical picture per se, our attention will be on very important support level. This level includes MPS1, Fib support and MACDP line – 1.3564-1.3578. Our problem is that we do not know who will win – either CHF grabber and market will turn up, or grabber will fail and market will continue move down (I mean EUR).
This level could clarify this or at least it could give some valuable hints. First of all take a look at AB-CD pattern. In fact market has hit 1.37 Agreement – Fib level and AB=CD target and turned to retracement. CD leg is much slower and this is bearish sign. As a rule, when market forms such flat AB=CD price wouldn’t move to next target and turns opposite right at “D” point. From this point of view 5/8 Fib support will be testing level. Market should hold above it to keep chances on further upward action. Second is MPS1. Again - if price will break it down, it will mean that this is not just retracement on new bull trend, this is bear trend continuation. And finally MACDP – we will watch for grabbers or trend shifting. As you can see we have a lot of points around, including CHF grabber and probably we should get clarification relatively fast.
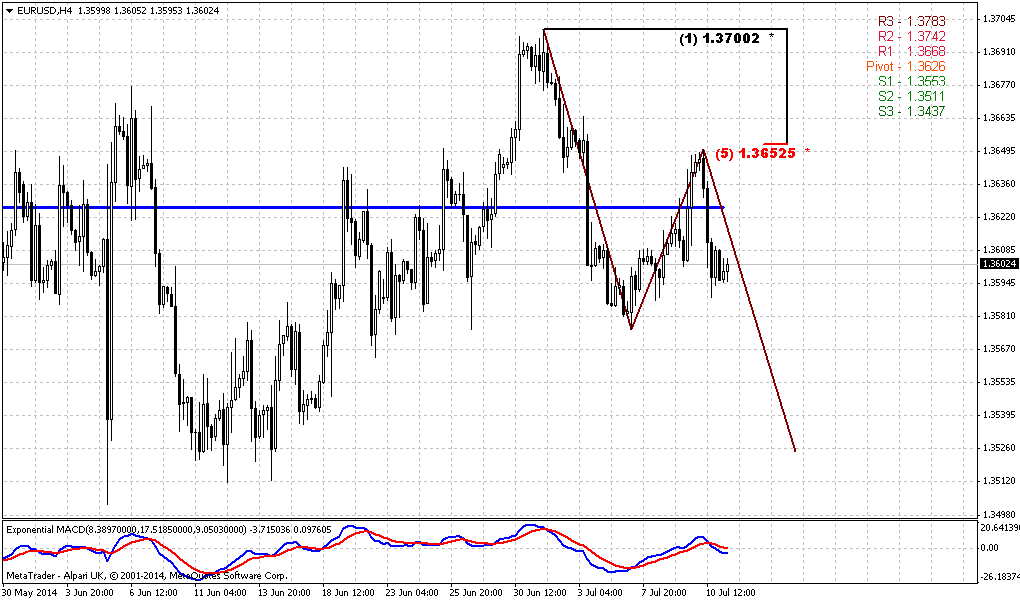
1-hour
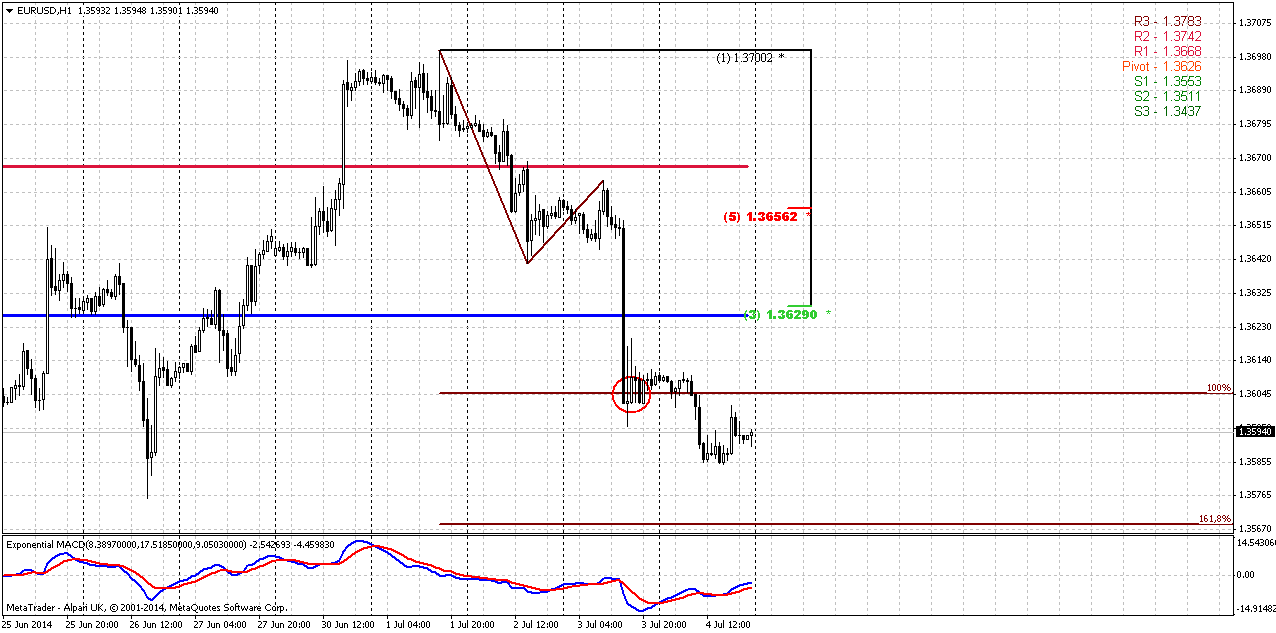
Hourly chart tells that market could move slightly lower, to 1.618 AB=CD target that stands right around MPS1. Because with this AB=CD price has accelerated right to 100% target at NFP data release. On the way to 1.3567 area EUR could form some reversal pattern that could trigger minor retracement. If this really will happen – we should closely watch for WPP area. If market will hold below it – this will confirm bearish sentiment and will add points to bearish view.
Conclusion:
While price stands in 1.33-1.38 area we can’t speak either on upward or downward breakout. To change really big picture market has to show breakout out of it. Still, market right now stands around crucial area – combination of YPP and monthly MACDP. Appearing of bullish grabber in July could resolve the riddle on further action. Conversely moving below YPP will shift monthly trend bearish as well and could lead to further EUR depreciation. Currently impact of fundamental data is limited, since right now it is not data per se impacts market but how Fed treats it. Thus, investors mostly will be focused on inflation data on July and Fed reaction on it during July meeting.
In short-term perspective you should get clarification of direction on coming week. Since we have opposite patterns on CHF and EUR – one of them should fail probably. Fortunately EUR stands at the level that could provide important information depending on whether price will hold above it or break it down.
The technical portion of Sive's analysis owes a great deal to Joe DiNapoli's methods, and uses a number of Joe's proprietary indicators. Please note that Sive's analysis is his own view of the market and is not endorsed by Joe DiNapoli or any related companies.
The dollar's failure to launch has been the big disappointment on currency markets this year. Solid U.S. jobs numbers for the fifth month running backed analysts who have begun again to predict it may take off in the coming months. Against that, the euro continues to be backed by inflows of cash into European bond and stock markets and also by talk in the market of buying by Asian central banks, recycling the dollar reserves they are accumulating into other currencies.
After a half-cent swing after the jobs numbers on Thursday, the dollar was just over 0.1 percent higher against the euro at $1.3585 on Friday. "You're getting this sort of muted reaction maybe because no one is that convinced these numbers will really change the Fed's outlook," said Daragh Maher, a strategist with HSBC in London. "It played reasonably well yesterday as a dollar positive, but the scale of the move has not been so big. It has gained, just not that much."
Maher drew parallels with the recent play on sterling, driven higher by investors' conviction that strong UK economic numbers would eventually prompt the Bank of England to shift to a more hawkish tone on interest rates. That seems to have happened in the past month, with Governor Mark Carney and colleagues hinting that the bank could even raise rates for the first time before the end of the year. Fed chief Janet Yellen, however, for now has offered little sign of heading in the same direction. "It seems as though people are slightly more reluctant to take on the Fed in the way we saw with the Bank of England," Maher said. "But maybe there comes a tipping point with data like this where the message has to change."
Considering the strength of U.S. jobs data over the past months, some traders said the failure of the dollar to stage the recovery was a sign that investors felt the U.S. Federal Reserve had no appetite for hiking rates in the near future. It would rather wait for wage inflation to pick up before tightening policy, analysts said. And unless two-year Treasury yields rose sharply, the dollar, which has a good correlation to U.S. yields, was unlikely to push much higher.
Recent concern and muted reaction on really nice NFP data tells that investors will watch closely for two points. First is coming inflation data – retail sale, consumer prices and expenditures. Second is coming July Fed meeting. That probably will be the major event, since there Fed will have to give an assessment and some reaction on recent data.
Technical
Although in May EUR has formed monthly reversal candle, but in recent time downward action has slowed significantly. As you can see within recent 2-3 weeks monthly picture hardly changes at all. Recently market has returned right back down to YPP area and flirts around it since then. EUR now stands at very significant moment. It has closely approached to Yearly Pivot point and monthly MACDP. If we will get lucky, we could get clarification in July for extended period. Thus, appearing of bullish grabber right at YPP level definitely will tell us that market should exceed 1.40 level and probably even could reach YPR1~1.42 area. Conversely, failure at YPP will be great challenge on further downward action. We didn’t get grabber on June, but right now market already has touched MACDP and not it is a question of 2-3 weeks, whether we will get it or not.
We’re speaking about both scenarios, because right now fundamental comments do not show any agreement in investors’ opinion concerning EUR. Some analysts even think that until US applies dovish policy EUR depreciation will be limited despite how dovish ECB is. Analysts suggest that Fed will keep rates low for longer period then they hint on. And as we’ve mentioned in fundamental part, investors expect that this riddle will be clarified in July.
By looking at bigger picture, market stands in tight range since 2014. Thus, 1.33-1.3850 is an area of “indecision”. While market stands inside of it we can talk about neither upward breakout nor downward reversal. At least, reversal identification could be done with yearly pivot – if market will move below it, this could be early sign of changing sentiment. But, as you can see, nothing among this issues have happened yet.
That’s being said, market stands around crucial area and July could clarify what will happen next.
Weekly
At first glance nothing exceptional has happened, but as you will see a bit later – situation is more sophisticated in reality. Previously we said that when market forms long candle it usually holds following price action for some time, because market needs to accustom to new range. At the same time this will increase potential energy of breakout. After flat placing market breaks with additional power. Also we said that we will point on bearish trend only if market will move below YPP and take out lows of hammer pattern. This also will mean that monthly trend shifts bearish.
Right we have two weekly bearish short-term issues. First one is a failure upward breakout of hammer’s range. Usually when market tries to take out top of some long candle and fails – this leads to action in oposite direction. At least, market will reach the low of this candle, but also it could pass twice length of this bar to the downside.
Second – price stands below MPP. This tells about bearish sentiment. If we wouldn’t have small nuance on CHF, I probably would call you for short entry, but right now, as we said, situation is tricky.
Daily
Here guys the trick that makes overall situation complex. Bearish stop grabber at CHF that suggests taking out of 0.8850 lows. Also pay attention where it has appeared – right at neckline of Double Bottom pattern. Price has passed through it and re-tested it from downside. Taking into consideration relation between CHF and EUR – it means that EUR should turn to the upside. Not necessary with the same pace, but direction should be the same, right? But now we have a riddle – how to combine bearish EUR setup on weekly chart and CHF? If we exclude possible failure of CHF grabber (that’s simple), to be honest guys, I see only one possible solution for this – such geopolitical turmoil that will trigger solid demand on safe haven assets. In this case CHF and USD will grow simultaneously and theoretically both pairs could start to move south. Or, as I said – keep an eye on CHF grabber failure. This also will resolve the problem.
Speaking about EUR technical picture per se, our attention will be on very important support level. This level includes MPS1, Fib support and MACDP line – 1.3564-1.3578. Our problem is that we do not know who will win – either CHF grabber and market will turn up, or grabber will fail and market will continue move down (I mean EUR).
This level could clarify this or at least it could give some valuable hints. First of all take a look at AB-CD pattern. In fact market has hit 1.37 Agreement – Fib level and AB=CD target and turned to retracement. CD leg is much slower and this is bearish sign. As a rule, when market forms such flat AB=CD price wouldn’t move to next target and turns opposite right at “D” point. From this point of view 5/8 Fib support will be testing level. Market should hold above it to keep chances on further upward action. Second is MPS1. Again - if price will break it down, it will mean that this is not just retracement on new bull trend, this is bear trend continuation. And finally MACDP – we will watch for grabbers or trend shifting. As you can see we have a lot of points around, including CHF grabber and probably we should get clarification relatively fast.
1-hour
Hourly chart tells that market could move slightly lower, to 1.618 AB=CD target that stands right around MPS1. Because with this AB=CD price has accelerated right to 100% target at NFP data release. On the way to 1.3567 area EUR could form some reversal pattern that could trigger minor retracement. If this really will happen – we should closely watch for WPP area. If market will hold below it – this will confirm bearish sentiment and will add points to bearish view.
Conclusion:
While price stands in 1.33-1.38 area we can’t speak either on upward or downward breakout. To change really big picture market has to show breakout out of it. Still, market right now stands around crucial area – combination of YPP and monthly MACDP. Appearing of bullish grabber in July could resolve the riddle on further action. Conversely moving below YPP will shift monthly trend bearish as well and could lead to further EUR depreciation. Currently impact of fundamental data is limited, since right now it is not data per se impacts market but how Fed treats it. Thus, investors mostly will be focused on inflation data on July and Fed reaction on it during July meeting.
In short-term perspective you should get clarification of direction on coming week. Since we have opposite patterns on CHF and EUR – one of them should fail probably. Fortunately EUR stands at the level that could provide important information depending on whether price will hold above it or break it down.
The technical portion of Sive's analysis owes a great deal to Joe DiNapoli's methods, and uses a number of Joe's proprietary indicators. Please note that Sive's analysis is his own view of the market and is not endorsed by Joe DiNapoli or any related companies.