Sive Morten
Special Consultant to the FPA
- Messages
- 18,699
Fundamentals
Reuters reports dollar rose on Friday, ending its best week of gains since May, on strong inflation and housing data that encouraged bets on a U.S. interest rates hike by the end of the year.
U.S. consumer prices rose for a fifth straight month in June, while housing starts jumped last month and building permits surged to an eight-year high, according to separate government reports.
The Federal Reserve has kept its short-term interest rate near zero for more than six years, and most economists believe the Fed will initiate rate hikes in September. Fed Chair Janet Yellen this week said an interest rate increase was likely this year.
The euro was off 0.25 percent on Friday to $1.0850, a level last seen on May 27 and down more than 2 percent on the week as currency investors shifted attention from the Greek crisis to economic fundamentals that favor the United States.
Most traders and strategists reckon the diverging policy outlook between the euro zone and the United States should see the euro continue to weaken, with many betting that it will fall below $1 in the next year.
"The focus is turning to the U.S. rate cycle, and (the market reckons) a September rate hike is still, if not probable, at least possible," RBC Capital Markets global head of FX strategy, Adam Cole, said. "From now the euro goes down primarily because the dollar is going up."
Sterling hit a 7-1/2-year high against the euro of 0.6992 pounds after Bank of England Governor Mark Carney gave his strongest hint yet on the timing of a UK rate rise, saying a decision would come into focus around the end of 2015.
Looking forward, Joe Manimbo, senior market analyst at Western Union Business Solutions in Washington, said, "The dollar’s outperformance, coupled with a slow start to America’s economic calendar next week, could leave it prey to profit-taking."
The Canadian dollar extended its losses against the U.S. dollar on Friday following a slew of economic data that signaled higher U.S. interest rates, while Canada's benchmark rate just dropped.
The currency retreated 2.5 percent this week to its weakest level since March 2009. Its biggest dive came on Wednesday after the Bank of Canada announced a 25 basis point rate cut for the second time this year after data showed the economy likely contracted during the first half of the year.
"In terms of small moves, the move on Friday is a very impressive one... Any other time, this would be a perfect opportunity to square your positions ahead of weekend," said Adam Button, currency analyst at ForexLive in Montreal.
"Yet, there is very little of that taking place in Canadian dollar trading ... Right now you have a perfect storm for the Canadian dollar. The Bank of Canada isn't a one day, or even a two-day event."
The loonie finished at C$1.2987 to the U.S. dollar, or 77 U.S. cents, weaker than the Bank of Canada's official close on Thursday of C$1.2970, or 77.10 U.S. cents.
On the data front, Canada's annual inflation rate edged up to 1 percent in June, led by higher food prices, but the rate was tempered by cheap energy prices.
Recent CFTC data shows impressive growth in open interest on CAD. As short as long positions have shown growth last month, but last week small growth was only in shorts. So, sentiment mostly supports bearish view on CAD. At the same time, short positions are exceeding long ones too much. Take a look, we have 80K contracts on short side and only 35 K on long side. If we will calculate the ratio we will see that shorts stands near 80% of total amount of speculative positions. It means that market could move slightly higher in near-term perspective, but probably it will take some pause prior it will reach major 1.3470 target. Also it will be interesting to see numbers on next week, after rate cut that has happened last week, because right now we have data that was before rate cut happened.
Open Interest:
 Speculative Longs:

Speculative shorts:
 Technicals
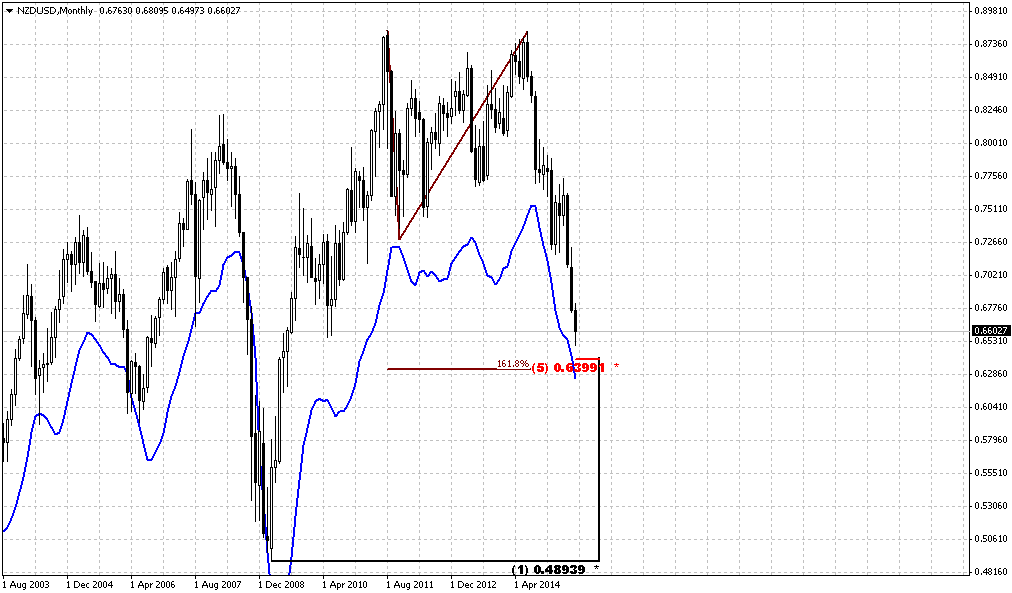
Monthly
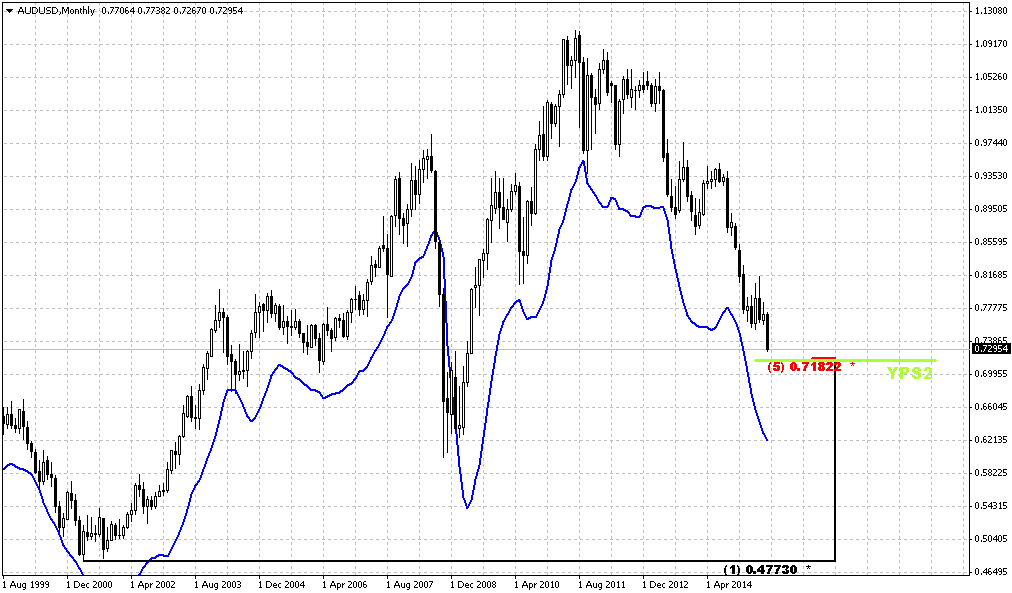
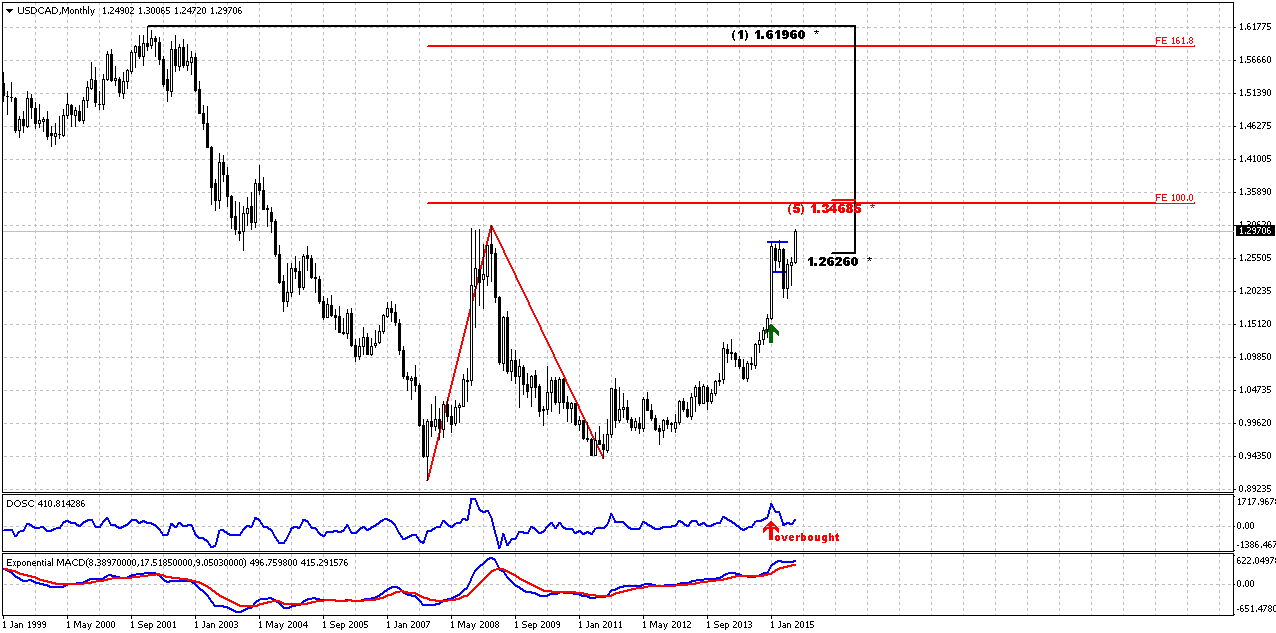
Last week was really meaningful for CAD. Market has shown solid upside progress and long term monthly setup has entered in final stage, I suppose. At least it is not long distance rest till the target, in terms of monthly scale, of cause
CAD trend is bullish. We do not have any yearly pivots here because CAD has passed through all of them, even YPR2 at 1.23 area. Last time we’ve discussed big AB-CD pattern in progress that already has passed above 0.618 target and has major destination point at 1.3420 that creates Agreement with major 1.3470 Fib resistance. This pattern is still valid and stands as cornerstone of our analysis. Our former suggestions and reasons why we think that USD/CAD should continue move up looks like were correct and have been confirmed by price action. Of cause we couldn’t foresee rate cut, but technical picture suggested upside continuation.
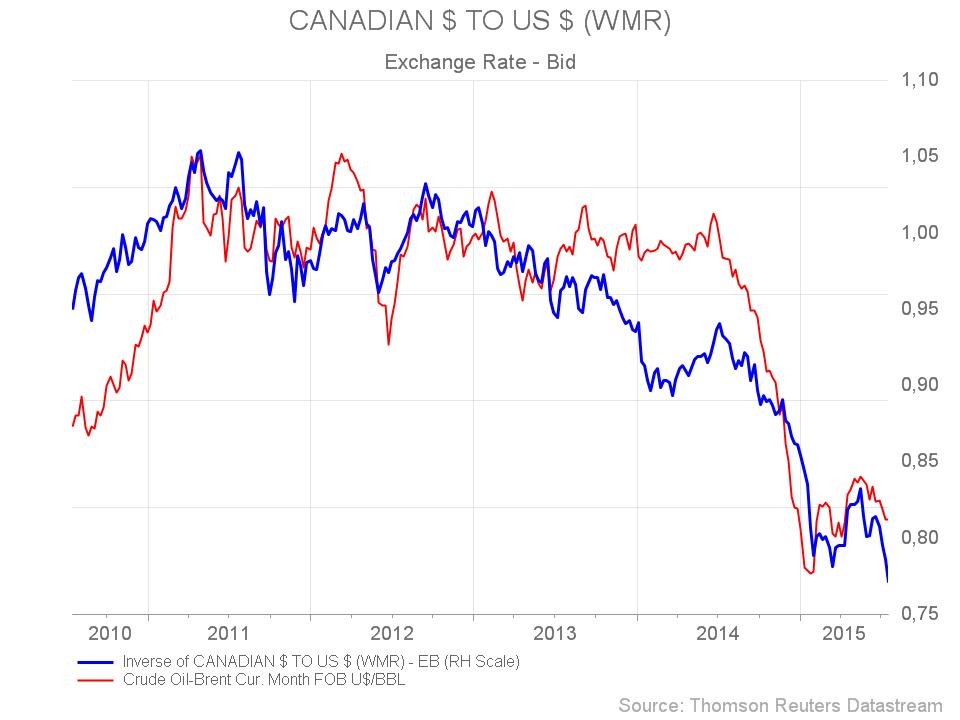
Market is not at overbought any more, and price has broken up as through upper border of the flag as through 50% Fib resistance. On monthly chart CAD has no barriers till our major target and now it seems that it should be hit with high probability. As CAD fundamental data as crude oil prices are supportive for further CAD weakness.
So, monthly picture mostly stands in favor of upside continuation in long-term perspective to our major long-term target 1.3470 – Agreement with major Fib resistance level.
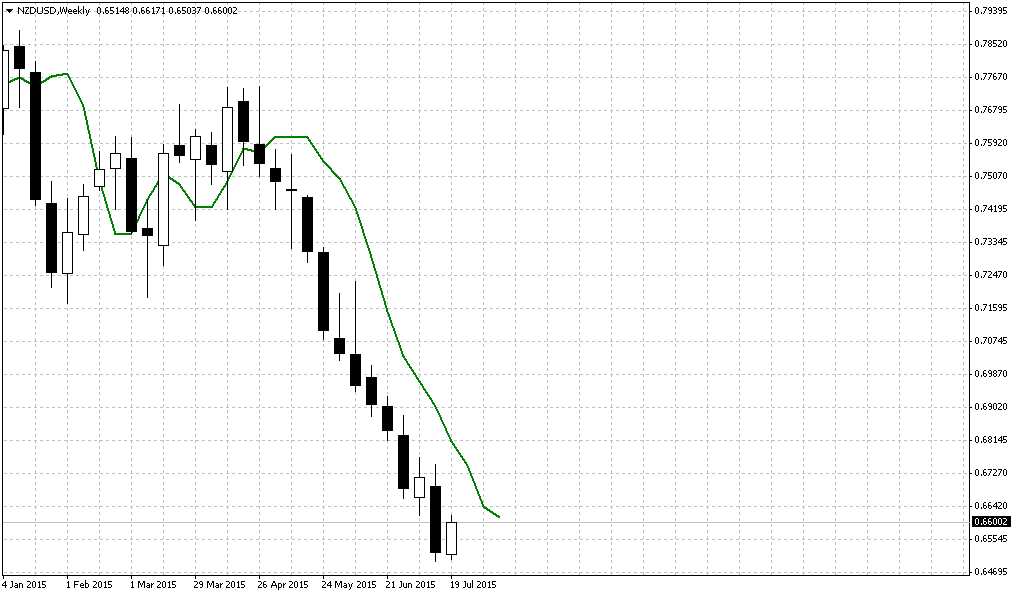
Weekly
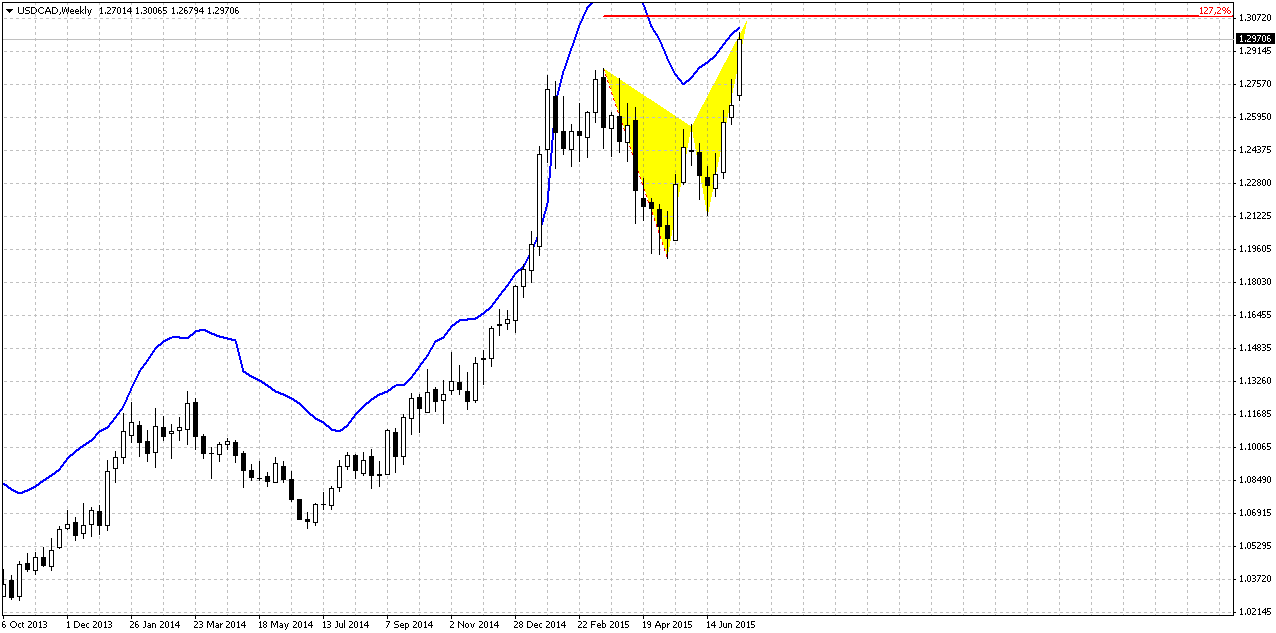
On weekly chart currently situation is relatively simple. Trend is bullish, but market stands very close to overbought and even we could say at overbought. At the same time there is 100 pips more to first 1.27 extension of butterfly. Recall that CFTC shows a bit overextended short positions and agrees with possible retracement here.
So, our conclusion on weekly chart – market probably will reach 1.3050 area before any meaningful retracement will happen. But after that we expect some bounce down to provide relief to the market. At the same time we do not expect too deep retracement since our major target has not been hit yet. It would be perfect if market will just re-test broken top around 1.28 area. In general this corresponds with minimal 3/8 retracement that butterfly should provide.
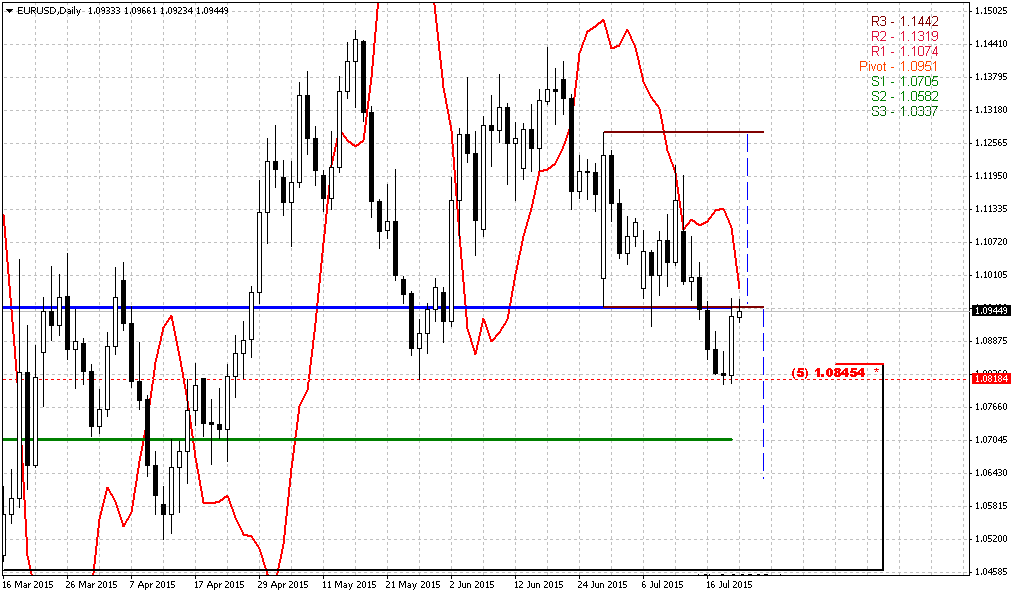
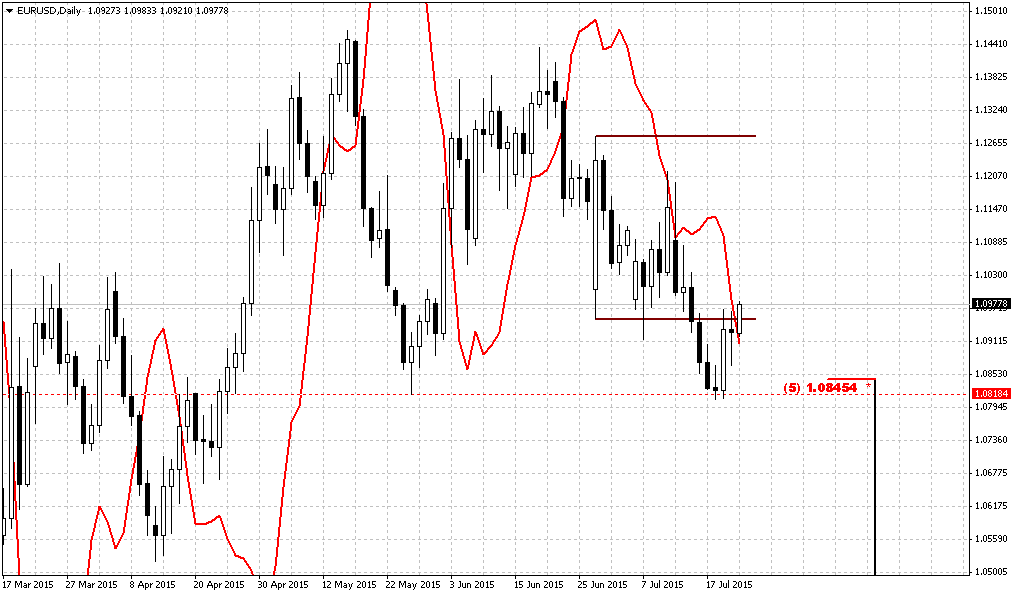
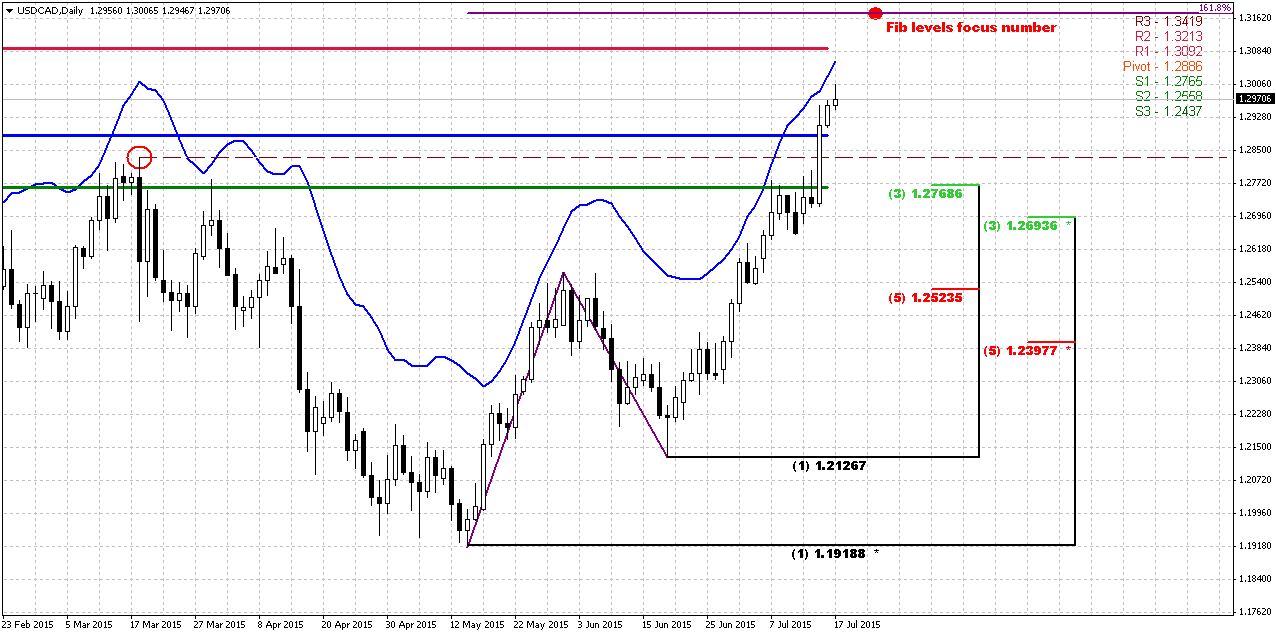
Daily
On daily chart we have similar picture. AB=CD pattern has 1.618 extension target around 1.3150 – slightly higher than weekly butterfly. Market stands close to overbought but not at overbought yet. New WPR1 coincides with weekly butterfly extension around 1.3084 area. Currently it is difficult to say how market will hit these targets since they have solid gap between them around 100 pips. This is not small distance for daily time scale. Either it will hit them simultaneously and start retracement after that, or, may be, it will hit first target, show retracement and 1.618 AB=CD target will be hit on final way up. Anyway, we’re mostly interested in depth of retracement, since this is the chance for scale-in or for first entry for those who doesn’t have yet long position.
Let’s work on some perspective here, guys. I’ve drawn fib levels that are not based on current high but on potential AB-CD target. Just to show levels that will be at that moment. I’ve marked this top by red circle. So all Fib levels that I’ve drawn here are based on top around 1.3162. If retracement really will start from there, we like support area around former top. Take a look this is combination of WPS1, top and 3/8 Fib support. All these levels have logic. First is, retracement should be a bit deeper since market will be at weekly and daily overbought and applying of WPS1 seems correct, instead of just WPP. Reaching of WPS1 will not break the trend, since we know the rule – until WPS1 holds retracement bullish trend is valid. Using former top as support is classical tool and finally, 3/8 Fib support corresponds to minimum retracement that butterfly should trigger. Deeper retracement is possible but not welcome, since they will be totally agreed with existence of untouched major 1.3470 target.
That’s being said, let’s keep watching for 1.28 area as potential target of downward retracement on coming week.
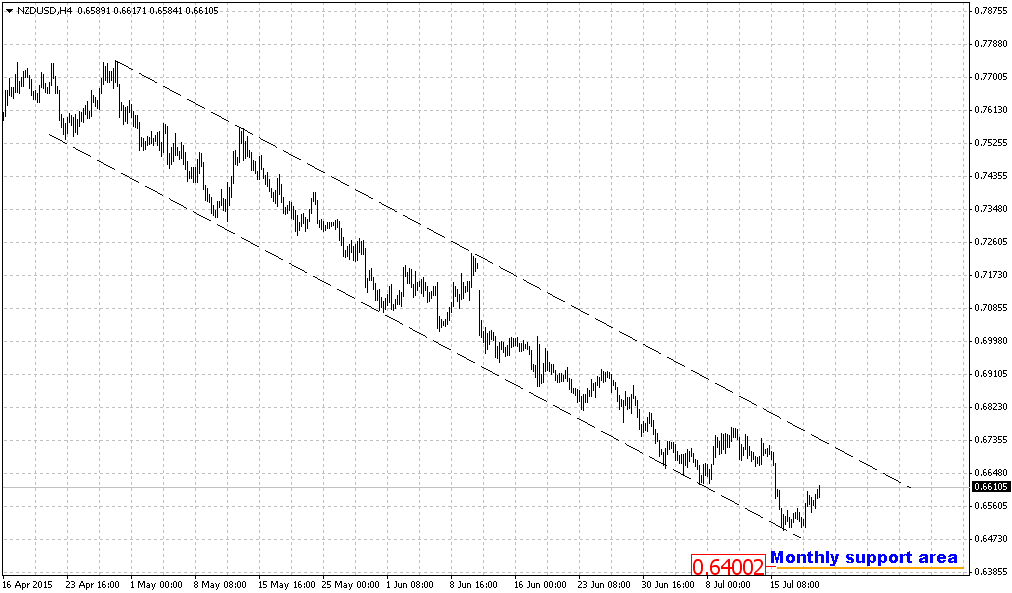
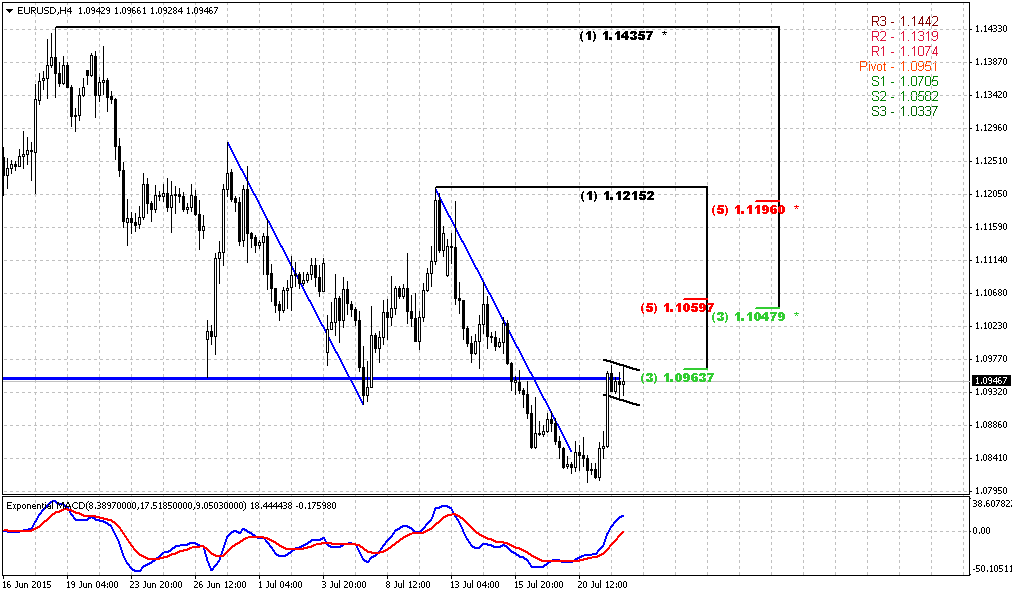
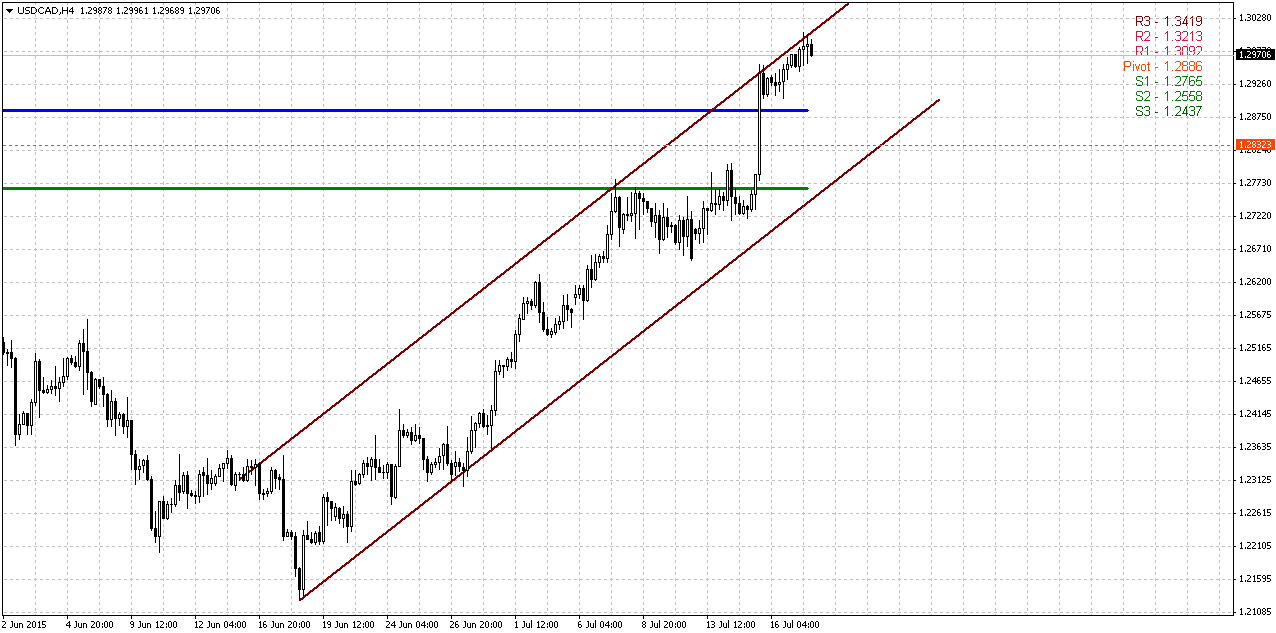
4-Hour
4-hour chart does not give us a lot of additional information. CAD mostly stands in upside channel. Right now price stands at upper border and probably some move down is possible on Monday morning. At the same time above we’ve said that no solid retracement should happen prior reaching of weekly butterfly target and WPR1. It means that market, for example, could test WPP and then continue move up right to target and only after that turn to our 1.28 area.
Conclusion:
Long term analysis and fundamental background confirms our long-term view on CAD and its long term target around 1.3470 area. CFTC data, Crude oil prices and dollar appreciation now support upside action on USD/CAD currency pair.
In short-term perspective we expect completion of weekly butterfly and then retracement to 1.28 area that could become not bad area for taking long position.
The technical portion of Sive's analysis owes a great deal to Joe DiNapoli's methods, and uses a number of Joe's proprietary indicators. Please note that Sive's analysis is his own view of the market and is not endorsed by Joe DiNapoli or any related companies.
Reuters reports dollar rose on Friday, ending its best week of gains since May, on strong inflation and housing data that encouraged bets on a U.S. interest rates hike by the end of the year.
U.S. consumer prices rose for a fifth straight month in June, while housing starts jumped last month and building permits surged to an eight-year high, according to separate government reports.
The Federal Reserve has kept its short-term interest rate near zero for more than six years, and most economists believe the Fed will initiate rate hikes in September. Fed Chair Janet Yellen this week said an interest rate increase was likely this year.
The euro was off 0.25 percent on Friday to $1.0850, a level last seen on May 27 and down more than 2 percent on the week as currency investors shifted attention from the Greek crisis to economic fundamentals that favor the United States.
Most traders and strategists reckon the diverging policy outlook between the euro zone and the United States should see the euro continue to weaken, with many betting that it will fall below $1 in the next year.
"The focus is turning to the U.S. rate cycle, and (the market reckons) a September rate hike is still, if not probable, at least possible," RBC Capital Markets global head of FX strategy, Adam Cole, said. "From now the euro goes down primarily because the dollar is going up."
Sterling hit a 7-1/2-year high against the euro of 0.6992 pounds after Bank of England Governor Mark Carney gave his strongest hint yet on the timing of a UK rate rise, saying a decision would come into focus around the end of 2015.
Looking forward, Joe Manimbo, senior market analyst at Western Union Business Solutions in Washington, said, "The dollar’s outperformance, coupled with a slow start to America’s economic calendar next week, could leave it prey to profit-taking."
The Canadian dollar extended its losses against the U.S. dollar on Friday following a slew of economic data that signaled higher U.S. interest rates, while Canada's benchmark rate just dropped.
The currency retreated 2.5 percent this week to its weakest level since March 2009. Its biggest dive came on Wednesday after the Bank of Canada announced a 25 basis point rate cut for the second time this year after data showed the economy likely contracted during the first half of the year.
"In terms of small moves, the move on Friday is a very impressive one... Any other time, this would be a perfect opportunity to square your positions ahead of weekend," said Adam Button, currency analyst at ForexLive in Montreal.
"Yet, there is very little of that taking place in Canadian dollar trading ... Right now you have a perfect storm for the Canadian dollar. The Bank of Canada isn't a one day, or even a two-day event."
The loonie finished at C$1.2987 to the U.S. dollar, or 77 U.S. cents, weaker than the Bank of Canada's official close on Thursday of C$1.2970, or 77.10 U.S. cents.
On the data front, Canada's annual inflation rate edged up to 1 percent in June, led by higher food prices, but the rate was tempered by cheap energy prices.
Recent CFTC data shows impressive growth in open interest on CAD. As short as long positions have shown growth last month, but last week small growth was only in shorts. So, sentiment mostly supports bearish view on CAD. At the same time, short positions are exceeding long ones too much. Take a look, we have 80K contracts on short side and only 35 K on long side. If we will calculate the ratio we will see that shorts stands near 80% of total amount of speculative positions. It means that market could move slightly higher in near-term perspective, but probably it will take some pause prior it will reach major 1.3470 target. Also it will be interesting to see numbers on next week, after rate cut that has happened last week, because right now we have data that was before rate cut happened.
Open Interest:
Speculative shorts:
Monthly
Last week was really meaningful for CAD. Market has shown solid upside progress and long term monthly setup has entered in final stage, I suppose. At least it is not long distance rest till the target, in terms of monthly scale, of cause
CAD trend is bullish. We do not have any yearly pivots here because CAD has passed through all of them, even YPR2 at 1.23 area. Last time we’ve discussed big AB-CD pattern in progress that already has passed above 0.618 target and has major destination point at 1.3420 that creates Agreement with major 1.3470 Fib resistance. This pattern is still valid and stands as cornerstone of our analysis. Our former suggestions and reasons why we think that USD/CAD should continue move up looks like were correct and have been confirmed by price action. Of cause we couldn’t foresee rate cut, but technical picture suggested upside continuation.
Market is not at overbought any more, and price has broken up as through upper border of the flag as through 50% Fib resistance. On monthly chart CAD has no barriers till our major target and now it seems that it should be hit with high probability. As CAD fundamental data as crude oil prices are supportive for further CAD weakness.
So, monthly picture mostly stands in favor of upside continuation in long-term perspective to our major long-term target 1.3470 – Agreement with major Fib resistance level.
Weekly
On weekly chart currently situation is relatively simple. Trend is bullish, but market stands very close to overbought and even we could say at overbought. At the same time there is 100 pips more to first 1.27 extension of butterfly. Recall that CFTC shows a bit overextended short positions and agrees with possible retracement here.
So, our conclusion on weekly chart – market probably will reach 1.3050 area before any meaningful retracement will happen. But after that we expect some bounce down to provide relief to the market. At the same time we do not expect too deep retracement since our major target has not been hit yet. It would be perfect if market will just re-test broken top around 1.28 area. In general this corresponds with minimal 3/8 retracement that butterfly should provide.
Daily
On daily chart we have similar picture. AB=CD pattern has 1.618 extension target around 1.3150 – slightly higher than weekly butterfly. Market stands close to overbought but not at overbought yet. New WPR1 coincides with weekly butterfly extension around 1.3084 area. Currently it is difficult to say how market will hit these targets since they have solid gap between them around 100 pips. This is not small distance for daily time scale. Either it will hit them simultaneously and start retracement after that, or, may be, it will hit first target, show retracement and 1.618 AB=CD target will be hit on final way up. Anyway, we’re mostly interested in depth of retracement, since this is the chance for scale-in or for first entry for those who doesn’t have yet long position.
Let’s work on some perspective here, guys. I’ve drawn fib levels that are not based on current high but on potential AB-CD target. Just to show levels that will be at that moment. I’ve marked this top by red circle. So all Fib levels that I’ve drawn here are based on top around 1.3162. If retracement really will start from there, we like support area around former top. Take a look this is combination of WPS1, top and 3/8 Fib support. All these levels have logic. First is, retracement should be a bit deeper since market will be at weekly and daily overbought and applying of WPS1 seems correct, instead of just WPP. Reaching of WPS1 will not break the trend, since we know the rule – until WPS1 holds retracement bullish trend is valid. Using former top as support is classical tool and finally, 3/8 Fib support corresponds to minimum retracement that butterfly should trigger. Deeper retracement is possible but not welcome, since they will be totally agreed with existence of untouched major 1.3470 target.
That’s being said, let’s keep watching for 1.28 area as potential target of downward retracement on coming week.
4-Hour
4-hour chart does not give us a lot of additional information. CAD mostly stands in upside channel. Right now price stands at upper border and probably some move down is possible on Monday morning. At the same time above we’ve said that no solid retracement should happen prior reaching of weekly butterfly target and WPR1. It means that market, for example, could test WPP and then continue move up right to target and only after that turn to our 1.28 area.
Conclusion:
Long term analysis and fundamental background confirms our long-term view on CAD and its long term target around 1.3470 area. CFTC data, Crude oil prices and dollar appreciation now support upside action on USD/CAD currency pair.
In short-term perspective we expect completion of weekly butterfly and then retracement to 1.28 area that could become not bad area for taking long position.
The technical portion of Sive's analysis owes a great deal to Joe DiNapoli's methods, and uses a number of Joe's proprietary indicators. Please note that Sive's analysis is his own view of the market and is not endorsed by Joe DiNapoli or any related companies.
Last edited: