Sive Morten
Special Consultant to the FPA
- Messages
- 18,732
Monthly
Sorry, guys, for light delay – there was no possibility to prepare research yesterday…
The euro slipped below the psychologically significant $1.35 level on Friday for the first time since February as the dollar gained broadly amid geopolitical tensions aggravated by the downing of a Malaysian airliner in Ukraine. The euro, shared by 18 countries, has been declining on shaky economic performance, including reports on Friday of weakening consumer confidence in Belgium, and speculation that U.S. policymakers may lift interest rates sooner than markets have expected. The euro dipped on Friday to $1.3492 shortly after the Bank of Italy cut its economic outlook, according to Shaun Osborne, currency strategist at TD Securities. It recovered later and stayed above $1.35. In reducing to 0.2 percent its 2014 growth forecast for Italy, the bank warned that there was significant uncertainty about the outlook for the euro zone's third-largest economy.
"Pillars supporting the euro dwindled Friday," Western Union Business Solutions analyst Joe Manimbo said. The region’s current account balance was reduced by more than half to a surplus of 8.9 billion euros in May from a revised 18.8 billion euros in April. "The euro has been in a range with $1.35 as a bottom," Osborne said. "The euro will probably trend lower now."
Currency traders were cautious, shifting away from riskier holdings as events played out in Ukraine, according to Lane Newman, director of foreign exchange at ING Capital Markets. "You will see a continuation of the risk-off move," Newman said. "I don't think many people want to go into the weekend with risk on."
Oil producer Norway's crown jumped, boosted by concerns about Europe's energy supply as tensions between Russia and the West over Ukraine rose. Valentin Marinov, head of European currency strategy at Citigroup in London, said worries over relations with Russia were outweighing the prospect of another cut in Norwegian interest rates next year.
The Norwegian central bank's shift in June to a looser approach to monetary policy had sent the crown down over 3 percent against the euro in the month to Thursday.
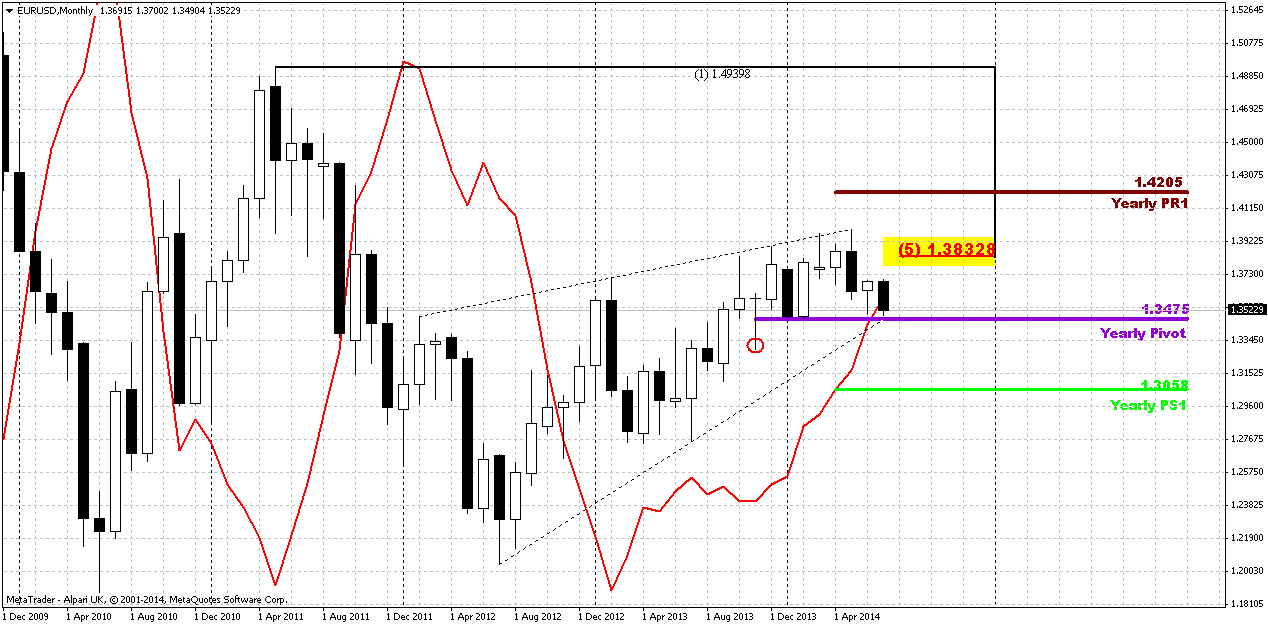
Technical
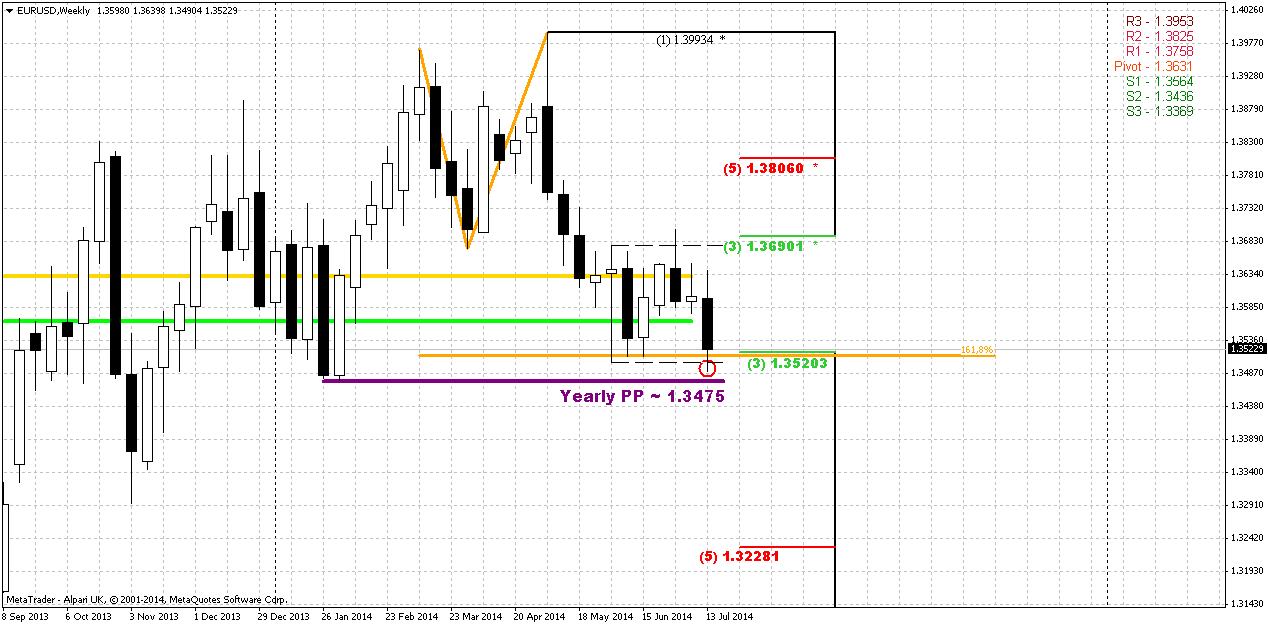
On previous week EUR has continued move down and almost has reached important 1.3475 area – Yearly pivot point. EUR now stands at very significant moment. It has closely approached to Yearly Pivot point and monthly MACDP (even slightly penetrated it). If we will get lucky, we could get clarification in July for extended period. Thus, appearing of bullish grabber right at YPP level definitely will tell us that market should exceed 1.40 level and probably even could reach YPR1~1.42 area. Conversely, failure at YPP will be great challenge on further downward action. We didn’t get grabber on June, but right now market already has touched MACDP and now it is a question of 2 weeks, whether we will get it or not.
We’re speaking about as upside as downside scenarios, because right now fundamental comments do not show any agreement in investors’ opinion concerning EUR. Some analysts even think that until US applies dovish policy EUR depreciation will be limited despite how dovish ECB is. Analysts suggest that Fed will keep rates low for longer period then they hint on. And as we’ve mentioned in fundamental part, investors expect that this riddle will be clarified in July. In fact, recent data on US economy was really positive and analysts talk about expectation to get prompts on earlier rate hiking in second part of 2015 instead of 2016. But in recent time Fed very often dissapoints investors and rethorical question why this couldn’t happen again? From that point of view it seems possible, especially if we recall Bernanke statements on private dinners, where he said that Fed will keep rates low longer than investors would like it. Thus, monthly grabber could be some kind of prophecy for this event. Actually we do not much care whether Fed will push USD up or down. We will be winners anyway, since we mostly need action in any direction and this probably will happen.
Technically market stands in tight range since 2014. Thus, 1.33-1.3850 is an area of “indecision”. While market stands inside of it we can talk about neither upward breakout nor downward reversal. At least, reversal identification could be done with yearly pivot – if market will move below it, this could be early sign of changing sentiment. But, as you can see, nothing among this issues have happened yet.
That’s being said, market stands around crucial area and July could clarify what will happen next. All we need on monthly chart is patience...
Also guys, there was a correct question on Boeing that was shot in Ukraine. In reality this event could lead to solid geopolitical tensions, this is not just plane crush and I will not be surprised if not even Fed but consequences of this incident will rule markets soon.
Weekly
On previous week market has shown solid donward action. Trend holds bearish still. Although price has reached low of our big hammer pattern – situation is not done yet with it. As we’ve said previously, when market forms long candle it usually holds following price action for some time, because market needs to accustom to new range. At the same time this will increase potential energy of breakout. After flat placing market breaks with additional power. Also we said that we will point on bearish trend only if market will move below YPP and take out lows of hammer pattern. This also will mean that monthly trend shifts bearish. And on previous week market has not passed through this low but tested it. In two words, major question here is the nature of this challenge. It is not neccesary that this upward is a failure breakout or W&R. Absolutely not. For example, this could be just first attempt, testing of the level. And return stands due strong support area – YPP, weekly Fib support and Agreement. You probably understand the difference between initially fake breakout, just W&R of stops and real attempt of breakout that has failed due strong support.
Consequences of these events will be different. Former will lead to upward continuation and may be acceleration, but latter will lead to market’s staying around these lows and new attempts of downward breakout. That’s our task - to understand what that was – fake or real attempt to pass lower.
Two issues that we’ve mentioned previously are still valid. They do not add encourage to the bulls, but at the same time they are not scary bearish. First one is a failure upward breakout of hammer’s range. Usually when market tries to take out top of some long candle and fails – this leads to action in oposite direction. At least, market will reach the low of this candle, but also it could pass twice length of this bar to the downside.
Second – price stands below MPP and even MPS1. This tells about bearish sentiment and confirms that current move down is not just some retracement and part of big bull trend. This is separate and independent bearish trend. Recall that on previous week we said:
Finally, MPS1 could become more significant tool than it seems now. If price will hold above it – this will be first hint on hidden bullish long-term reversal and could become a sign that Fed really could give weaker comments on possible rate policy. Other words it will be more dovish than investors would like it to be.
There is nothing to trade on weekly chart immediately, but it does not mean that expectation and observation of how market will deal with current low is less important. Patience and attention to details is a part of this business as well.
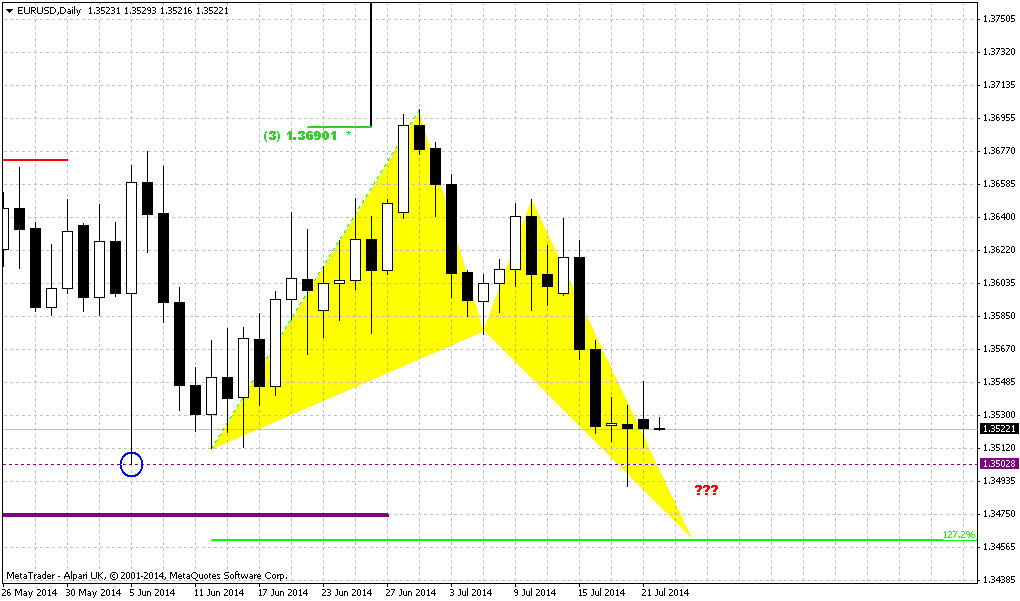
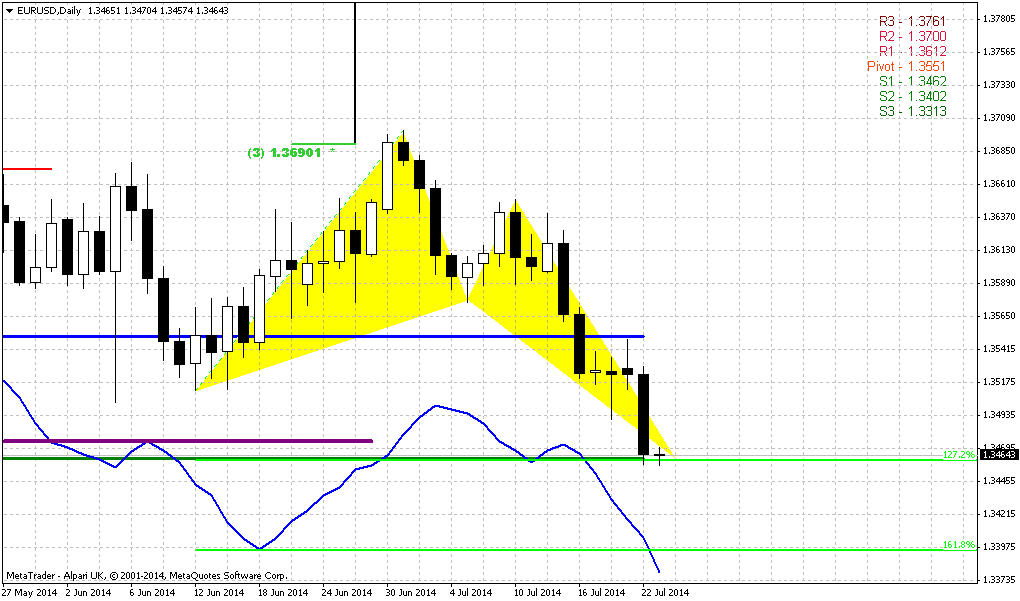
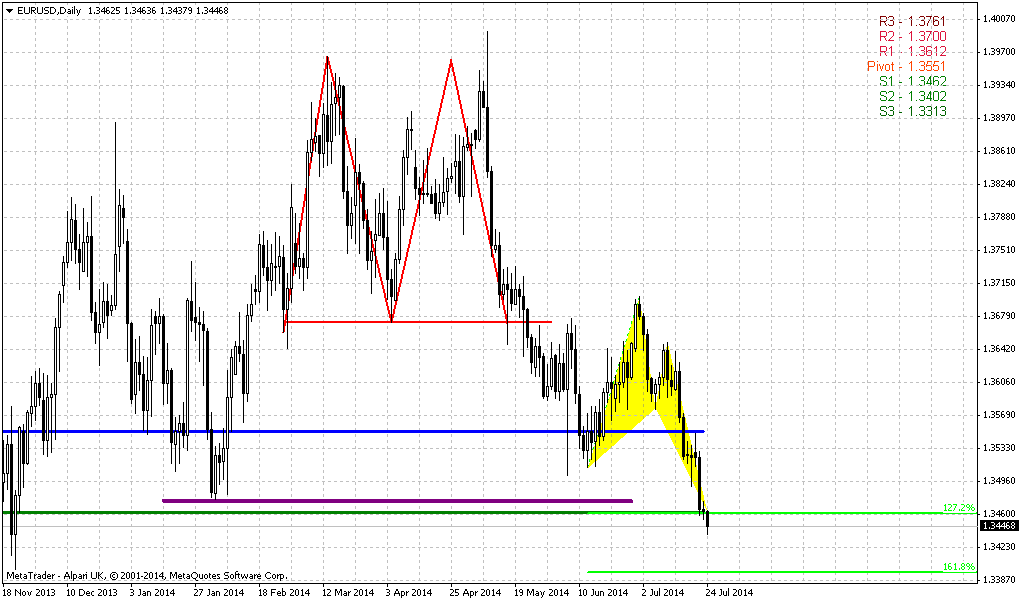
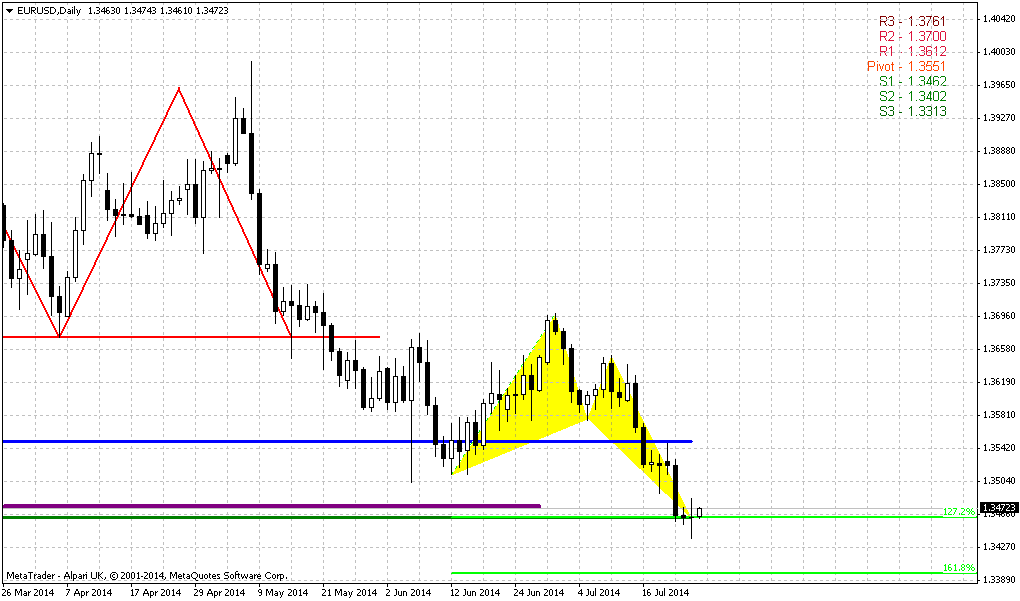
Daily
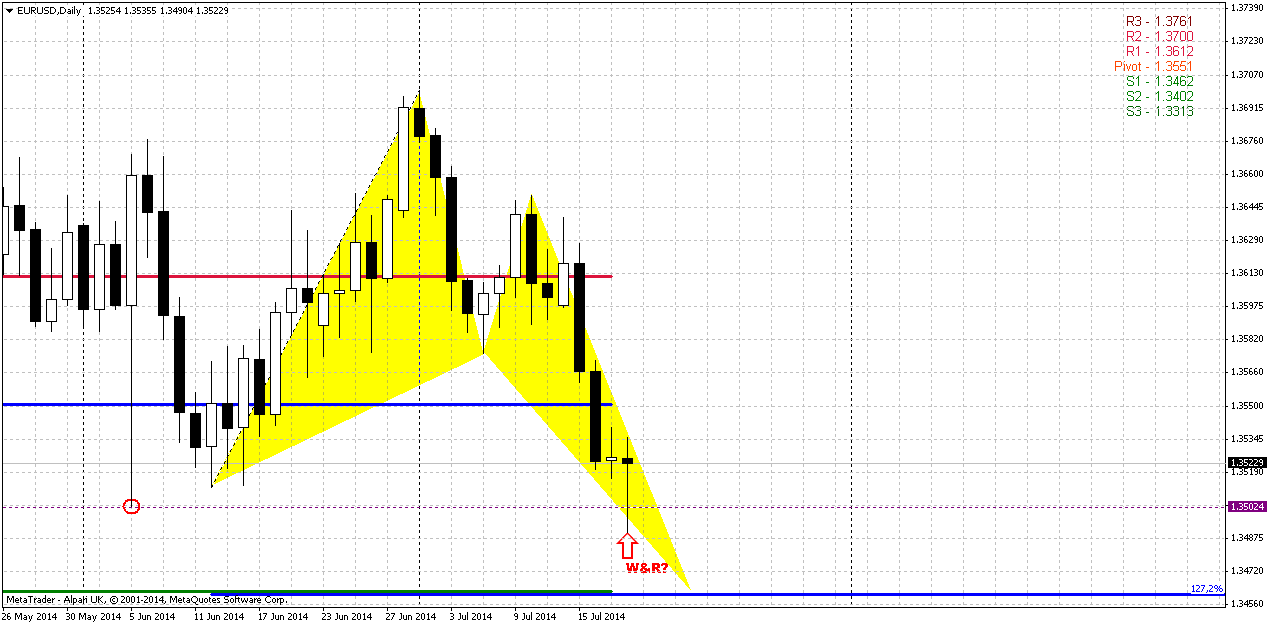
Trend is bearish on daily, market is not at oversold. It is interesting that last time when price stands at this level was on February. Major thoughts we’ve discussed above - at first glance this looks like W&R and potentially daily bullish signal, but it is better to not hurry with conclusions. We have some clear bearish facts that suggest downward action. They are pivots (as monthly as weekly), the way how market behaved on previous week – downward action was really fast and only minor retracement were made, almost invisible on daily chart. Second – what has changed in investors’ sentiment, in economy policy during previous week? Was any event, data or official statement that could shift balance? We do not see anything of this kind yet. It brings me to the point that we could see the siege of these 1.35 lows on coming week. Yes, some bounce probably will happen, but I have some feeling that it will not break the core. It means that if we’re bearish – we just need to wait some minor rally to sell into. Besides, this rally could give us the chance to test the quality of current move down – strength of the bears should be confirmed. We need gradual and reasonable retracement.
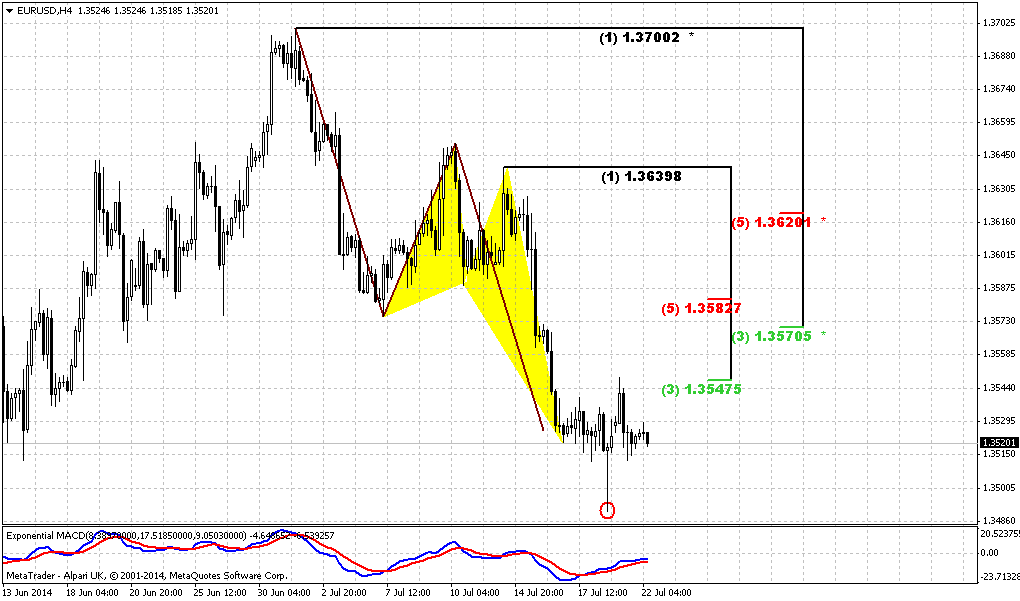
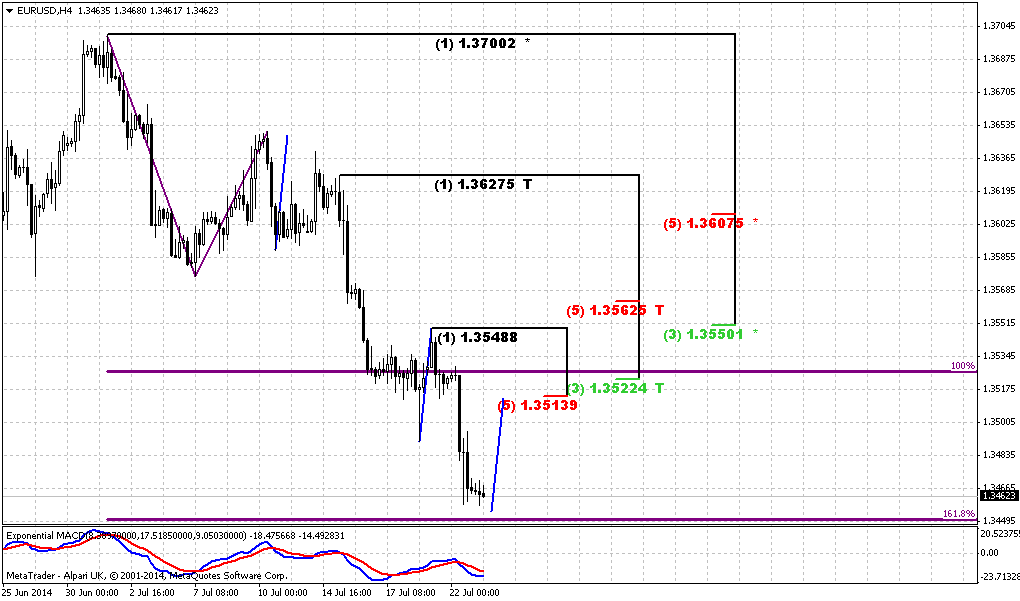
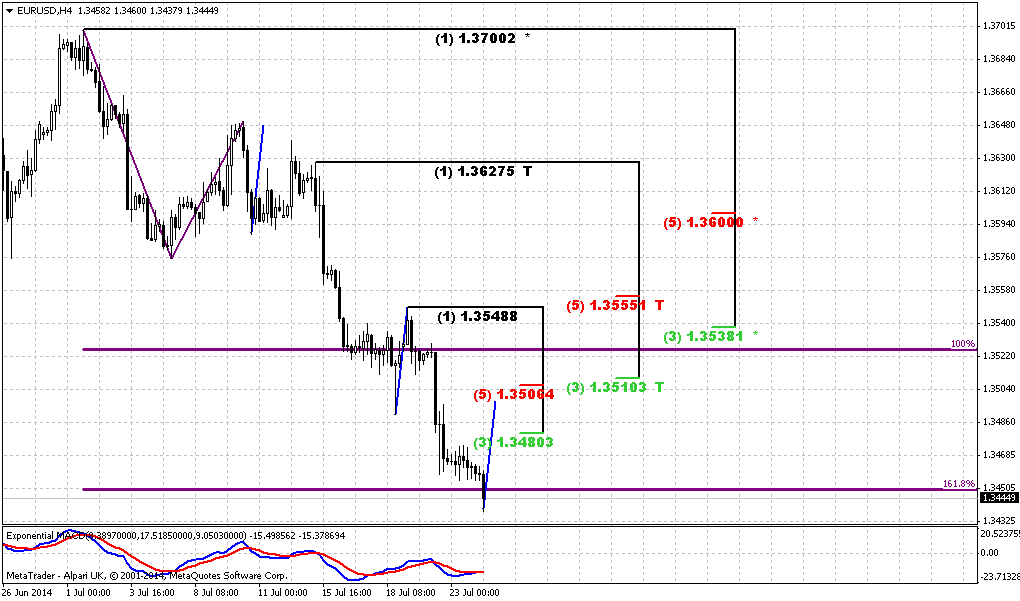
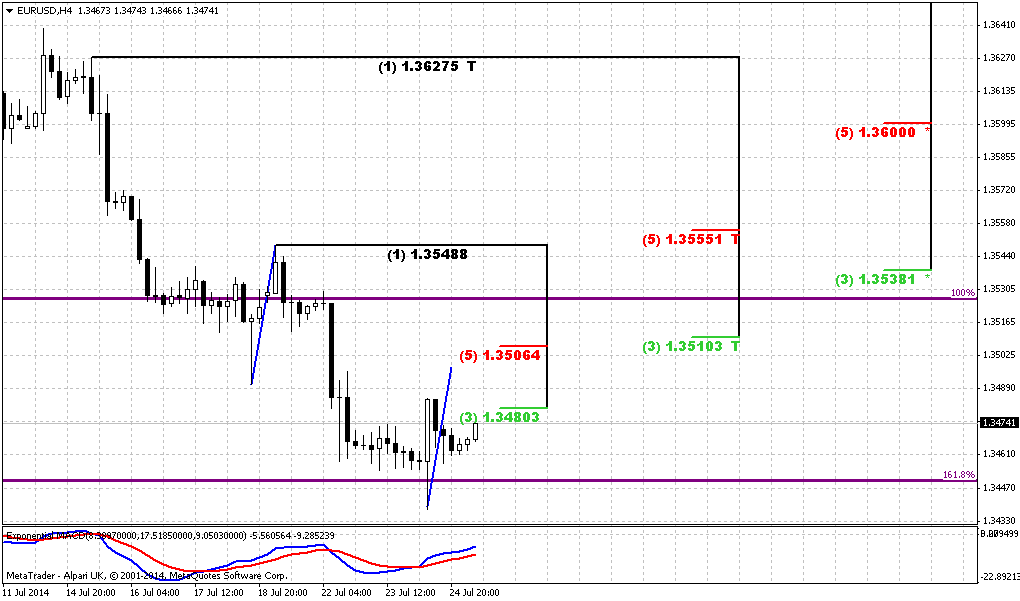
4-hour
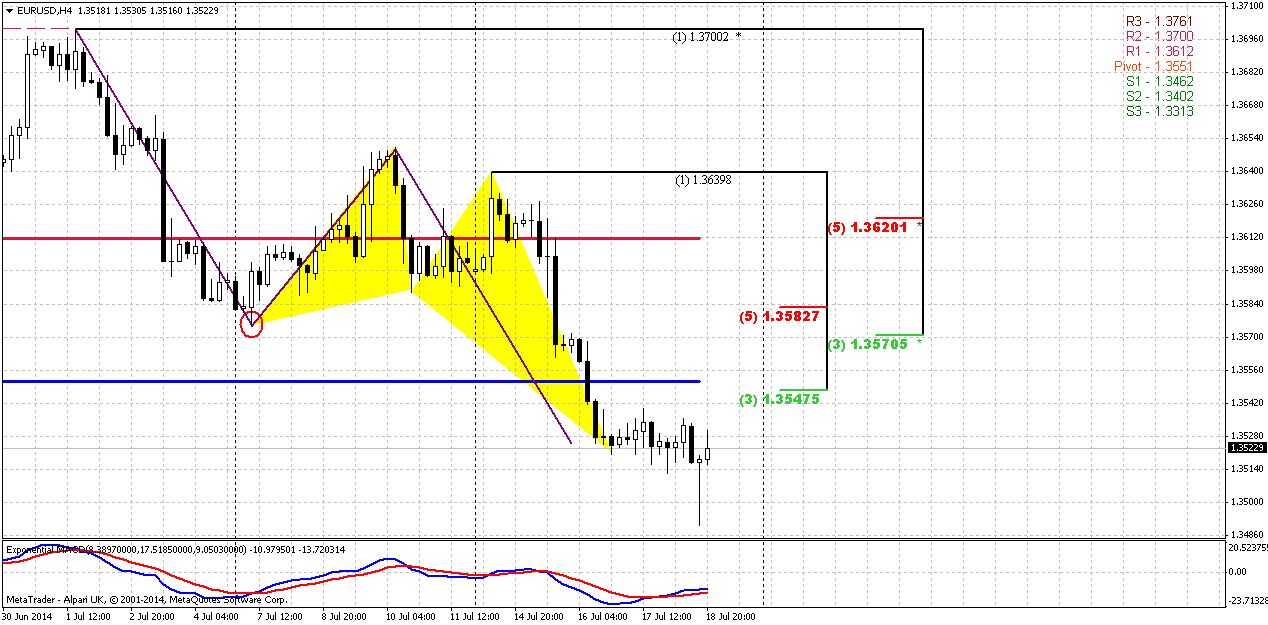
Trend has turned bullish here. We didn’t get our DRPO “Buy” but we still have as AB=CD as butterfly “Buy” patterns. As soon as we’ve got W&R of previous lows it makes obvious that we should not go short right now, at least from probabilities point of view. What to do we need to gudge about further direction? One of two results. First is downward breakout and holding below 1.35, second – 1.3580 area. From perspective of AB=CD, daily or 4-hour butterfly retracement even to 1.36 area will not mean that downward trend has been broken. 1.36 is just 5/8 Fib retracement and WPR1 - this a bit deep but acceptable retracement that will keep trend intact. But probably we should watch mostly for 1.3580 area. This is K-resistance and AB-leg low, besides, it stands very close to WPP. If market will fail to move above it – this will be early bell that downward action should start soon. Also, as usual, we have to keep an eye on partucularly how this upward action happen, what shape it will take, etc...
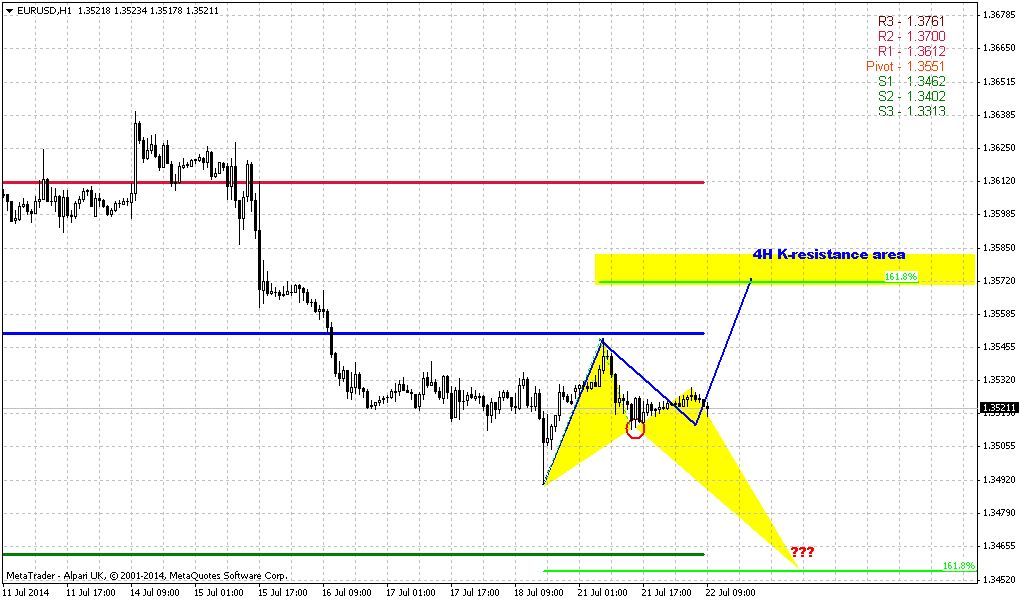
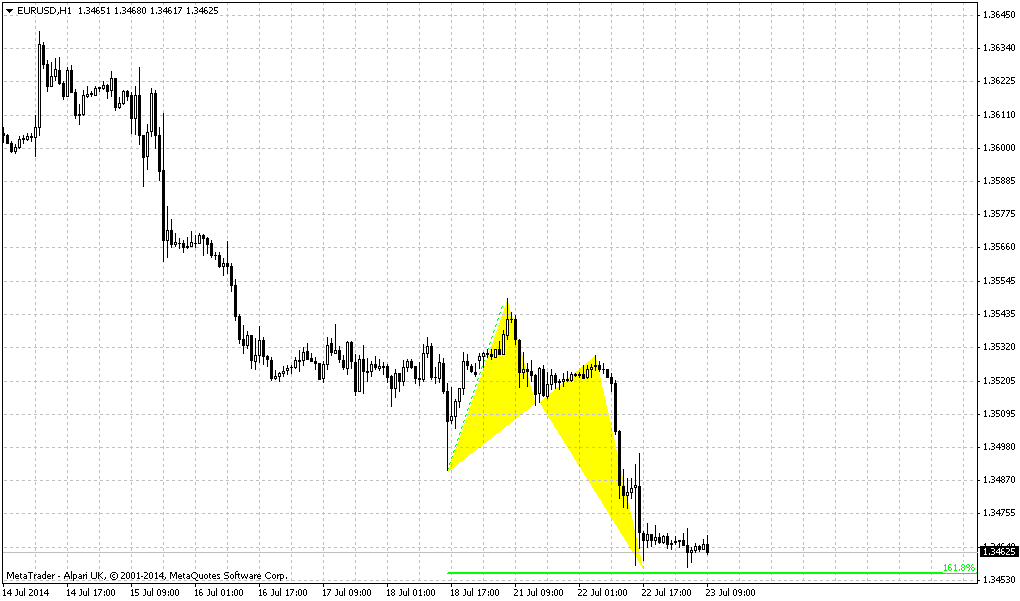
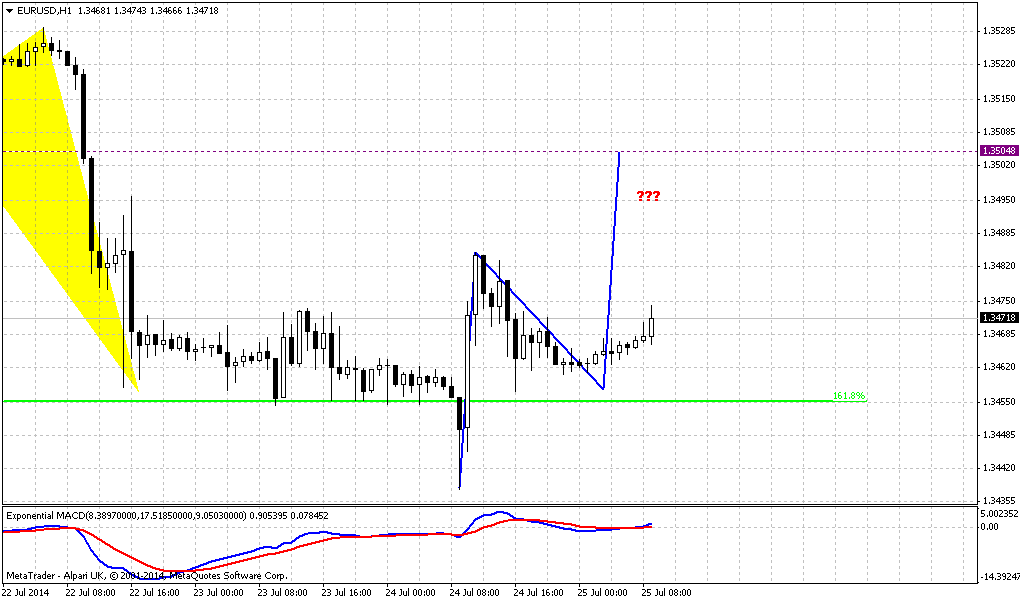
On the hourly chart we do not see anything special yet. May be we will get some pattern soon there – H&S or something of that sort. You also probably could find small butterfly and some hint on dynamic pressure, but all these moments too blur and insufficient yet. In fact they add nothing to overall analysis by far.
Conclusion:
While price stands in 1.33-1.38 area we can’t speak either on upward or downward breakout. To change really big picture market has to show breakout out of it. Still, market right now stands around crucial area – combination of YPP and monthly MACDP. Appearing of bullish grabber in July could resolve the riddle on further action or at least give us clear pattern on long-term chart.
Conversely moving below YPP will shift monthly trend bearish as well and could lead to further EUR depreciation. Currently impact of fundamental data is limited, since right now it is not data per se impacts market but how Fed treats it. Thus, investors mostly will be focused on inflation data on July and Fed reaction on it during July meeting.
We never use this kind of issues previously, but Boeing incident is not an occasion. There are really big plans stand behind and under cover of this crush. So, analyze, track and keep an eye on this event. I’m sure that there will be some unexpected consequences and turnings in investigation process that could really shake geopolitical picture.
In short-term perspective market has formed some bullish patterns that we just can’t ignore. Thus, in the beginning of the week we probably will be wait for this rally and watch what shape will it take and how fast it will be. As a second step – we will think about taking short position if rally will match our expectations. Actually, guys, our primary work right now is to understand the nature of this rally – whether it will be just retracement or something different.
It will be mystic if situation will resolve dramatically. The point is FOMC meeting will be on 30th of July. What will happen, if inflation data will be supportive for USD, investors will start gradually take short position on EUR/USD and on last day Fed will disappoint investors. In this case we could get as achieving of our downward targets as confirmation of bullish grabber on monthly right no 30th of July. It sounds incredible, but who knows…
The technical portion of Sive's analysis owes a great deal to Joe DiNapoli's methods, and uses a number of Joe's proprietary indicators. Please note that Sive's analysis is his own view of the market and is not endorsed by Joe DiNapoli or any related companies.
Sorry, guys, for light delay – there was no possibility to prepare research yesterday…
The euro slipped below the psychologically significant $1.35 level on Friday for the first time since February as the dollar gained broadly amid geopolitical tensions aggravated by the downing of a Malaysian airliner in Ukraine. The euro, shared by 18 countries, has been declining on shaky economic performance, including reports on Friday of weakening consumer confidence in Belgium, and speculation that U.S. policymakers may lift interest rates sooner than markets have expected. The euro dipped on Friday to $1.3492 shortly after the Bank of Italy cut its economic outlook, according to Shaun Osborne, currency strategist at TD Securities. It recovered later and stayed above $1.35. In reducing to 0.2 percent its 2014 growth forecast for Italy, the bank warned that there was significant uncertainty about the outlook for the euro zone's third-largest economy.
"Pillars supporting the euro dwindled Friday," Western Union Business Solutions analyst Joe Manimbo said. The region’s current account balance was reduced by more than half to a surplus of 8.9 billion euros in May from a revised 18.8 billion euros in April. "The euro has been in a range with $1.35 as a bottom," Osborne said. "The euro will probably trend lower now."
Currency traders were cautious, shifting away from riskier holdings as events played out in Ukraine, according to Lane Newman, director of foreign exchange at ING Capital Markets. "You will see a continuation of the risk-off move," Newman said. "I don't think many people want to go into the weekend with risk on."
Oil producer Norway's crown jumped, boosted by concerns about Europe's energy supply as tensions between Russia and the West over Ukraine rose. Valentin Marinov, head of European currency strategy at Citigroup in London, said worries over relations with Russia were outweighing the prospect of another cut in Norwegian interest rates next year.
The Norwegian central bank's shift in June to a looser approach to monetary policy had sent the crown down over 3 percent against the euro in the month to Thursday.
Technical
On previous week EUR has continued move down and almost has reached important 1.3475 area – Yearly pivot point. EUR now stands at very significant moment. It has closely approached to Yearly Pivot point and monthly MACDP (even slightly penetrated it). If we will get lucky, we could get clarification in July for extended period. Thus, appearing of bullish grabber right at YPP level definitely will tell us that market should exceed 1.40 level and probably even could reach YPR1~1.42 area. Conversely, failure at YPP will be great challenge on further downward action. We didn’t get grabber on June, but right now market already has touched MACDP and now it is a question of 2 weeks, whether we will get it or not.
We’re speaking about as upside as downside scenarios, because right now fundamental comments do not show any agreement in investors’ opinion concerning EUR. Some analysts even think that until US applies dovish policy EUR depreciation will be limited despite how dovish ECB is. Analysts suggest that Fed will keep rates low for longer period then they hint on. And as we’ve mentioned in fundamental part, investors expect that this riddle will be clarified in July. In fact, recent data on US economy was really positive and analysts talk about expectation to get prompts on earlier rate hiking in second part of 2015 instead of 2016. But in recent time Fed very often dissapoints investors and rethorical question why this couldn’t happen again? From that point of view it seems possible, especially if we recall Bernanke statements on private dinners, where he said that Fed will keep rates low longer than investors would like it. Thus, monthly grabber could be some kind of prophecy for this event. Actually we do not much care whether Fed will push USD up or down. We will be winners anyway, since we mostly need action in any direction and this probably will happen.
Technically market stands in tight range since 2014. Thus, 1.33-1.3850 is an area of “indecision”. While market stands inside of it we can talk about neither upward breakout nor downward reversal. At least, reversal identification could be done with yearly pivot – if market will move below it, this could be early sign of changing sentiment. But, as you can see, nothing among this issues have happened yet.
That’s being said, market stands around crucial area and July could clarify what will happen next. All we need on monthly chart is patience...
Also guys, there was a correct question on Boeing that was shot in Ukraine. In reality this event could lead to solid geopolitical tensions, this is not just plane crush and I will not be surprised if not even Fed but consequences of this incident will rule markets soon.
Weekly
On previous week market has shown solid donward action. Trend holds bearish still. Although price has reached low of our big hammer pattern – situation is not done yet with it. As we’ve said previously, when market forms long candle it usually holds following price action for some time, because market needs to accustom to new range. At the same time this will increase potential energy of breakout. After flat placing market breaks with additional power. Also we said that we will point on bearish trend only if market will move below YPP and take out lows of hammer pattern. This also will mean that monthly trend shifts bearish. And on previous week market has not passed through this low but tested it. In two words, major question here is the nature of this challenge. It is not neccesary that this upward is a failure breakout or W&R. Absolutely not. For example, this could be just first attempt, testing of the level. And return stands due strong support area – YPP, weekly Fib support and Agreement. You probably understand the difference between initially fake breakout, just W&R of stops and real attempt of breakout that has failed due strong support.
Consequences of these events will be different. Former will lead to upward continuation and may be acceleration, but latter will lead to market’s staying around these lows and new attempts of downward breakout. That’s our task - to understand what that was – fake or real attempt to pass lower.
Two issues that we’ve mentioned previously are still valid. They do not add encourage to the bulls, but at the same time they are not scary bearish. First one is a failure upward breakout of hammer’s range. Usually when market tries to take out top of some long candle and fails – this leads to action in oposite direction. At least, market will reach the low of this candle, but also it could pass twice length of this bar to the downside.
Second – price stands below MPP and even MPS1. This tells about bearish sentiment and confirms that current move down is not just some retracement and part of big bull trend. This is separate and independent bearish trend. Recall that on previous week we said:
Finally, MPS1 could become more significant tool than it seems now. If price will hold above it – this will be first hint on hidden bullish long-term reversal and could become a sign that Fed really could give weaker comments on possible rate policy. Other words it will be more dovish than investors would like it to be.
There is nothing to trade on weekly chart immediately, but it does not mean that expectation and observation of how market will deal with current low is less important. Patience and attention to details is a part of this business as well.
Daily
Trend is bearish on daily, market is not at oversold. It is interesting that last time when price stands at this level was on February. Major thoughts we’ve discussed above - at first glance this looks like W&R and potentially daily bullish signal, but it is better to not hurry with conclusions. We have some clear bearish facts that suggest downward action. They are pivots (as monthly as weekly), the way how market behaved on previous week – downward action was really fast and only minor retracement were made, almost invisible on daily chart. Second – what has changed in investors’ sentiment, in economy policy during previous week? Was any event, data or official statement that could shift balance? We do not see anything of this kind yet. It brings me to the point that we could see the siege of these 1.35 lows on coming week. Yes, some bounce probably will happen, but I have some feeling that it will not break the core. It means that if we’re bearish – we just need to wait some minor rally to sell into. Besides, this rally could give us the chance to test the quality of current move down – strength of the bears should be confirmed. We need gradual and reasonable retracement.
4-hour
Trend has turned bullish here. We didn’t get our DRPO “Buy” but we still have as AB=CD as butterfly “Buy” patterns. As soon as we’ve got W&R of previous lows it makes obvious that we should not go short right now, at least from probabilities point of view. What to do we need to gudge about further direction? One of two results. First is downward breakout and holding below 1.35, second – 1.3580 area. From perspective of AB=CD, daily or 4-hour butterfly retracement even to 1.36 area will not mean that downward trend has been broken. 1.36 is just 5/8 Fib retracement and WPR1 - this a bit deep but acceptable retracement that will keep trend intact. But probably we should watch mostly for 1.3580 area. This is K-resistance and AB-leg low, besides, it stands very close to WPP. If market will fail to move above it – this will be early bell that downward action should start soon. Also, as usual, we have to keep an eye on partucularly how this upward action happen, what shape it will take, etc...
On the hourly chart we do not see anything special yet. May be we will get some pattern soon there – H&S or something of that sort. You also probably could find small butterfly and some hint on dynamic pressure, but all these moments too blur and insufficient yet. In fact they add nothing to overall analysis by far.
Conclusion:
While price stands in 1.33-1.38 area we can’t speak either on upward or downward breakout. To change really big picture market has to show breakout out of it. Still, market right now stands around crucial area – combination of YPP and monthly MACDP. Appearing of bullish grabber in July could resolve the riddle on further action or at least give us clear pattern on long-term chart.
Conversely moving below YPP will shift monthly trend bearish as well and could lead to further EUR depreciation. Currently impact of fundamental data is limited, since right now it is not data per se impacts market but how Fed treats it. Thus, investors mostly will be focused on inflation data on July and Fed reaction on it during July meeting.
We never use this kind of issues previously, but Boeing incident is not an occasion. There are really big plans stand behind and under cover of this crush. So, analyze, track and keep an eye on this event. I’m sure that there will be some unexpected consequences and turnings in investigation process that could really shake geopolitical picture.
In short-term perspective market has formed some bullish patterns that we just can’t ignore. Thus, in the beginning of the week we probably will be wait for this rally and watch what shape will it take and how fast it will be. As a second step – we will think about taking short position if rally will match our expectations. Actually, guys, our primary work right now is to understand the nature of this rally – whether it will be just retracement or something different.
It will be mystic if situation will resolve dramatically. The point is FOMC meeting will be on 30th of July. What will happen, if inflation data will be supportive for USD, investors will start gradually take short position on EUR/USD and on last day Fed will disappoint investors. In this case we could get as achieving of our downward targets as confirmation of bullish grabber on monthly right no 30th of July. It sounds incredible, but who knows…
The technical portion of Sive's analysis owes a great deal to Joe DiNapoli's methods, and uses a number of Joe's proprietary indicators. Please note that Sive's analysis is his own view of the market and is not endorsed by Joe DiNapoli or any related companies.