Sive Morten
Special Consultant to the FPA
- Messages
- 18,695
Monthly
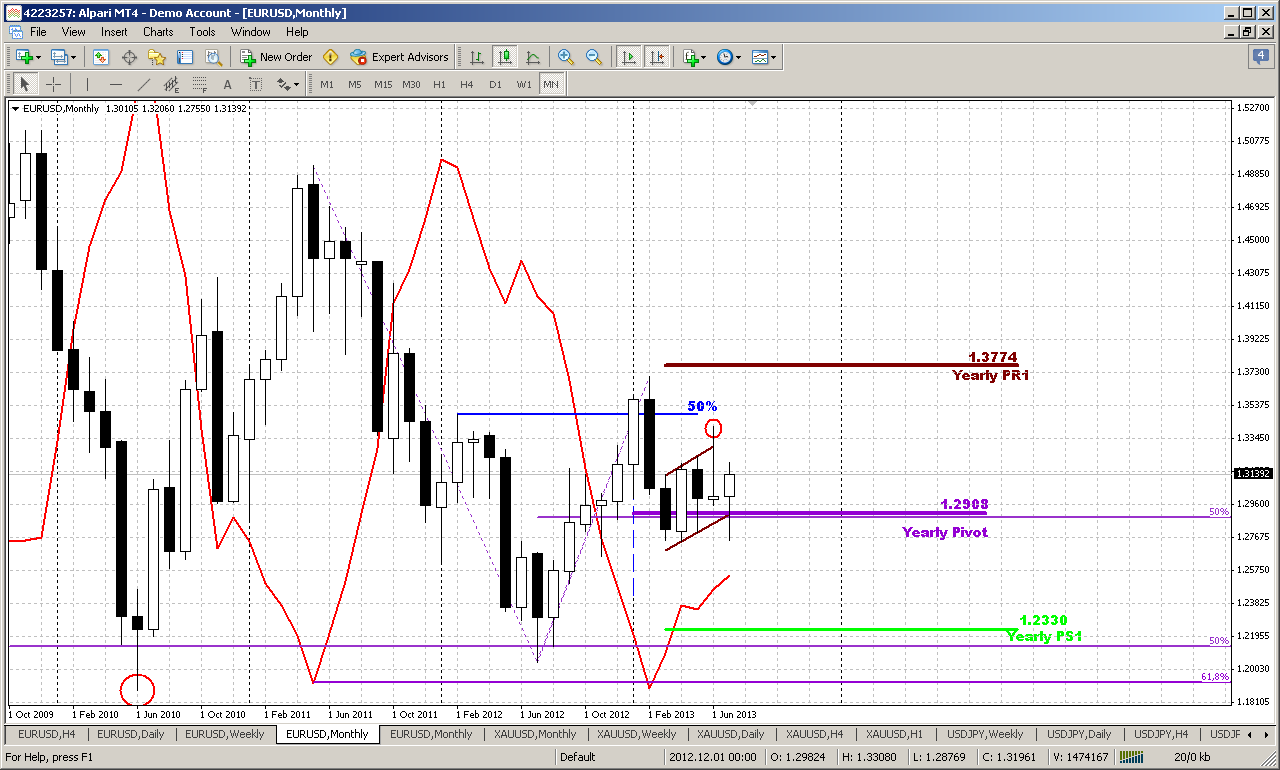
On monthly chart we do not see significant move during previous week, but still, overall action here looks significant. Although by now price movements look mostly as indecision, since market stands in tight range of flag consolidation and has formed two opposite candles with symmetrical oposite breakouts of the flag. Current failure downward breakout is more significant, because it shows that previous bullish trap has not worked and take a look where this has happened – right at yearly pivot point and 50% Fib support. Now market gradually moves to the upper border of the flag and the major drama will be played around it.
Although monthly chart right now can’t help us much in day-by-day trading, since until price stands it 1.29-1.33 range we can rely only on lower time frames and search patterns and context for trading here. Monthly chart could give us a signal or direction only when price will out of this range.
When this will happen targets to the downside remain the same – minimum target stands the same area around Yearly Pivot support 1 and preavious lows 1.2150-1.23. Potentially this probably will trigger downward action by huge AB=CD pattern that has minor 0.618 target and will challenge 1.1875 lows around all time major 50% support.
If market will continue move up, then it could lead to appearing of AB=CD pattern and challenging of yearly pivot resistance 1 area.
Still by current action here, it seems that advantage on the bull side, because bearish fake breakout has not worked and market has not continued move down. Even more, price slowly but creeping and creeping higher.
Weekly
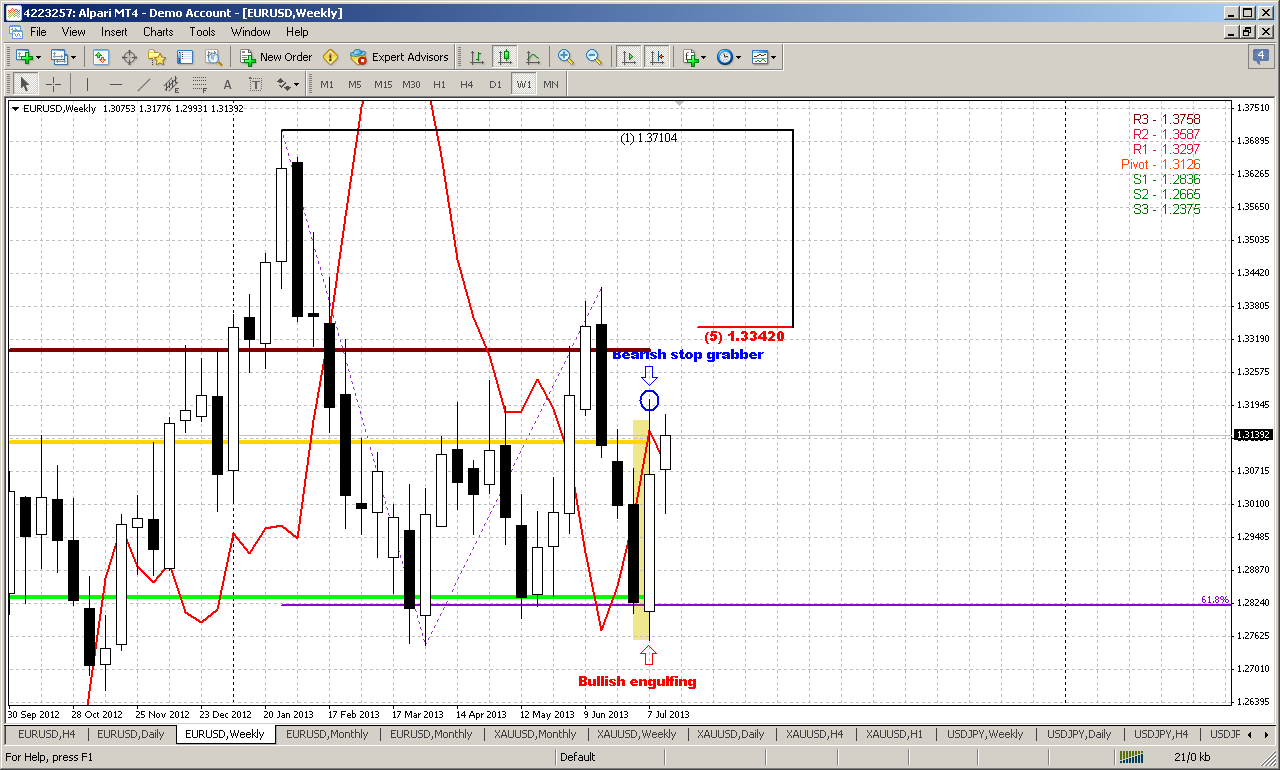
Well guys, weekly chart could become a real bomb in a medium-term perspective. But first, let’s take a look at picture that we get over to. I hope that everybody remember H&S pattern on weekly, and when we’ve discussed the reliability of this pattern, we’ve said – yes, may be it is too obvious and usually that patterns rare work, but we will not trade particular weekly H&S, since it’s big, we will try to get direction from it, but trade on lower time frames. Until neckline situation has developed perfectly, but now something is go out from whack. Market has reached significant support around neck line and 0.618 AB-CD pattern that is based on head and right shoulder.
But now, take a look – we have two opposite patterns. First is huge bullish engulfing and second is – bearish stop grabber. Although I do not like grabbers of this kind very much, since it stands opposite to the trend, but still – this is the pattern and it has not been cancelled yet. So, what bet would you place here – to the upside or to the downside?
We have to say, that looks like enguling pattern is working by far. Although passed week was an inside one, but trend has turned bullish, market closed higher than on previous week and what is mostly important – we’ve got close above MPP.
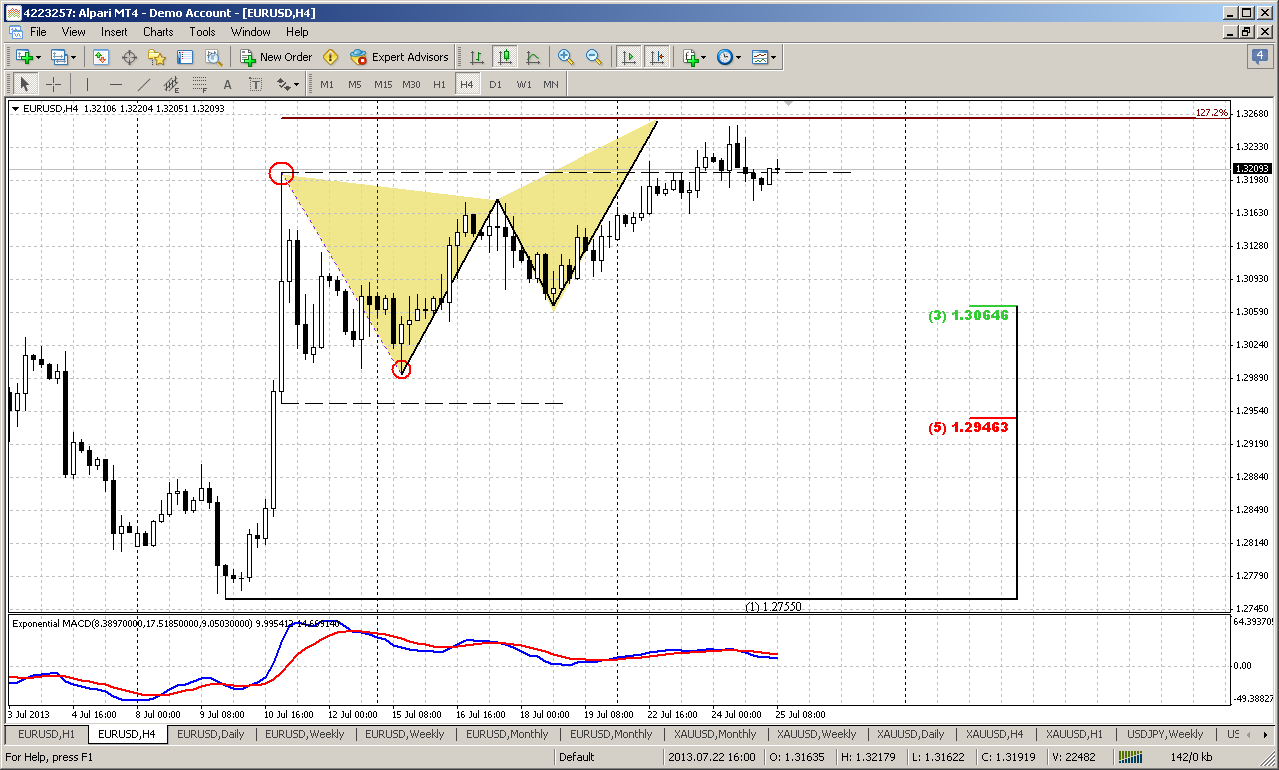
And now, guys, watch this:
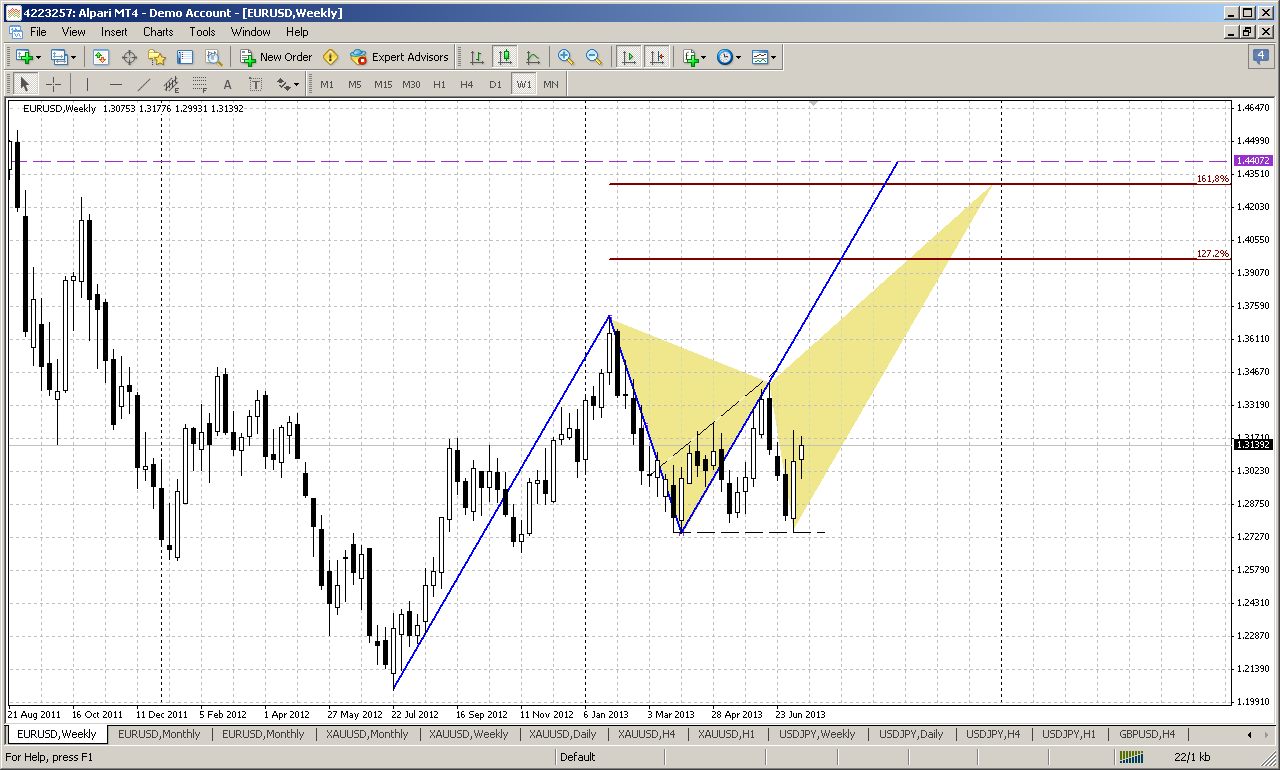
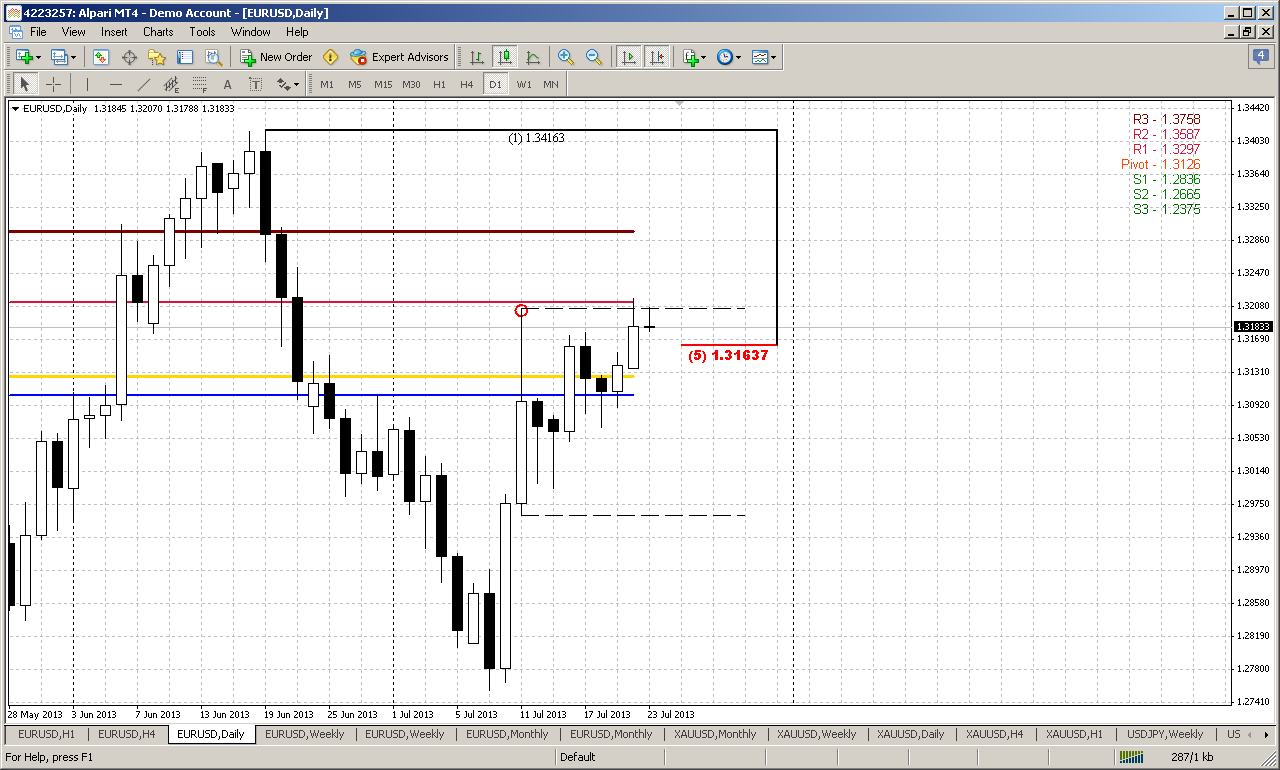
Let’s discuss this picture. First of all, market is forming here widening triangle, aka megaphone, and now price stands with 5th wave inside of it. Sometimes flat exit from triangles happens, but in most cases market will either show breakout to the uspide or fail to reach previous top and turn to the downside. Current low stands slightly higher than previous one and this keeps road open for appearing of butterfly “sell” with ultimate target round 1.43 area. Somewhere around stands objective point of AB=CD pattern either. What is significant that this possible scenario ergonomically links with monthly perspectives of possible upward action, especially close above MPP and hit over obviousness of H&S pattern by shifting it to H&S failure. That is also logical, since obvious patterns rare works. Will see, but this significantly renovate overall action on EUR and gives absolutely different picture. Now we just have to educe signs of this potential move and control it’s normal development.
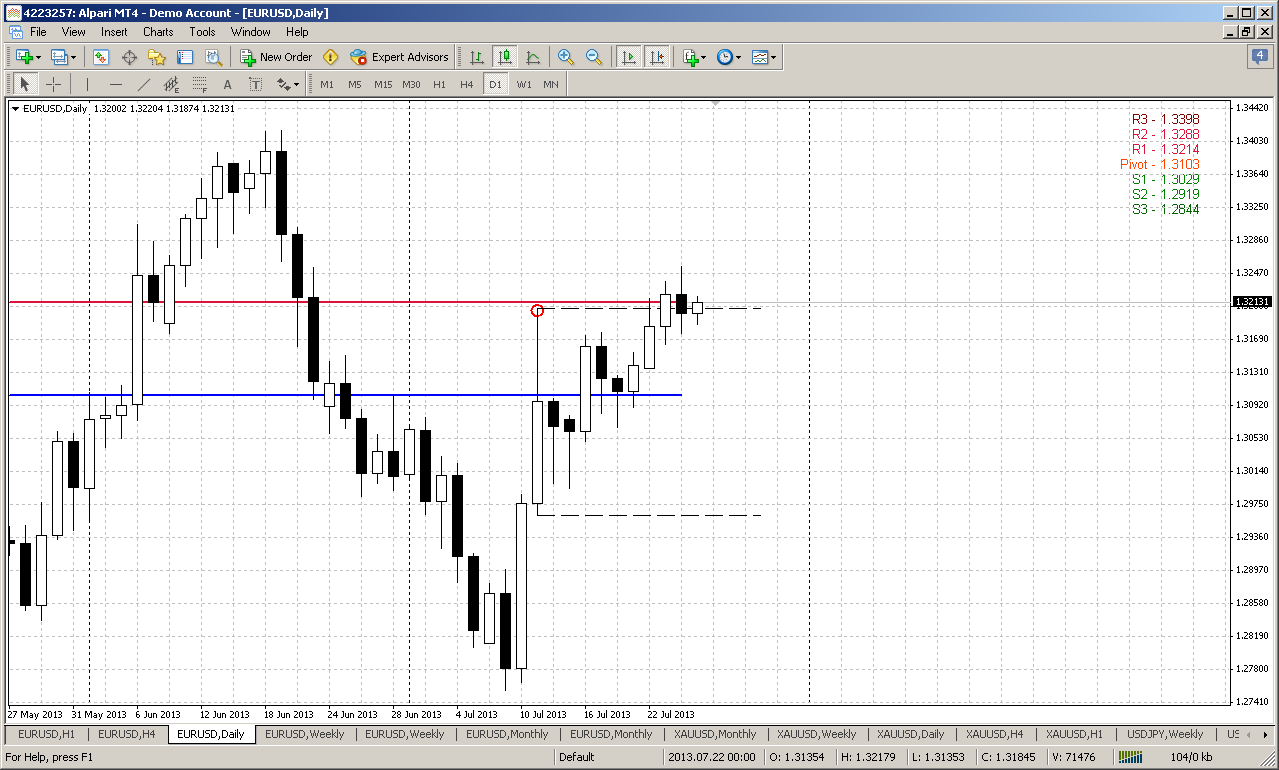
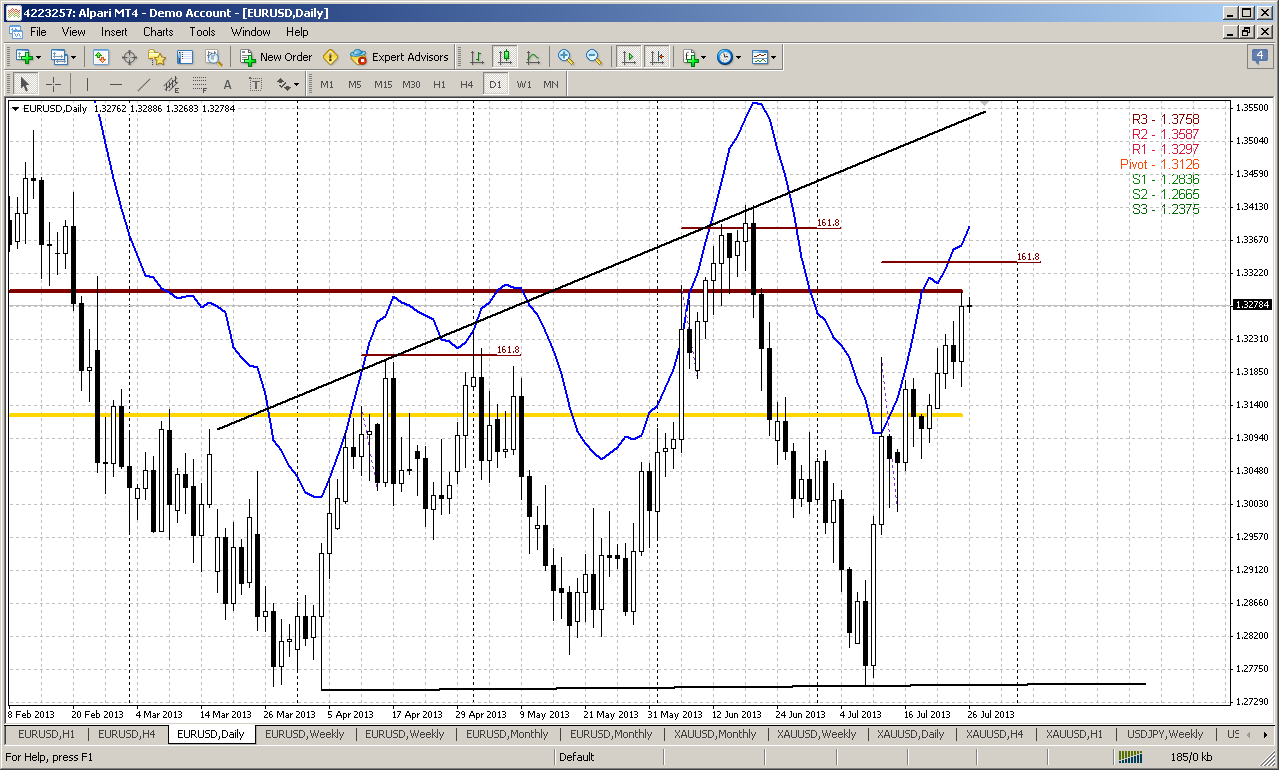
Daily
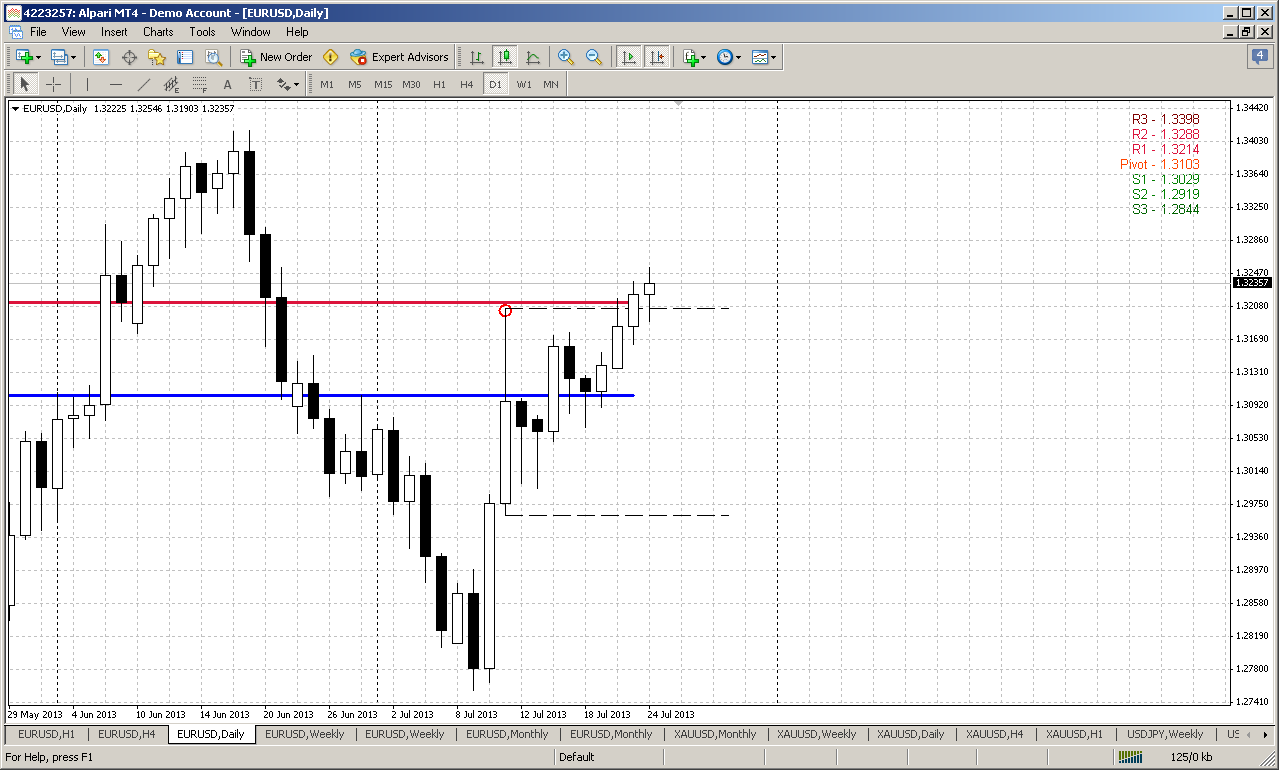
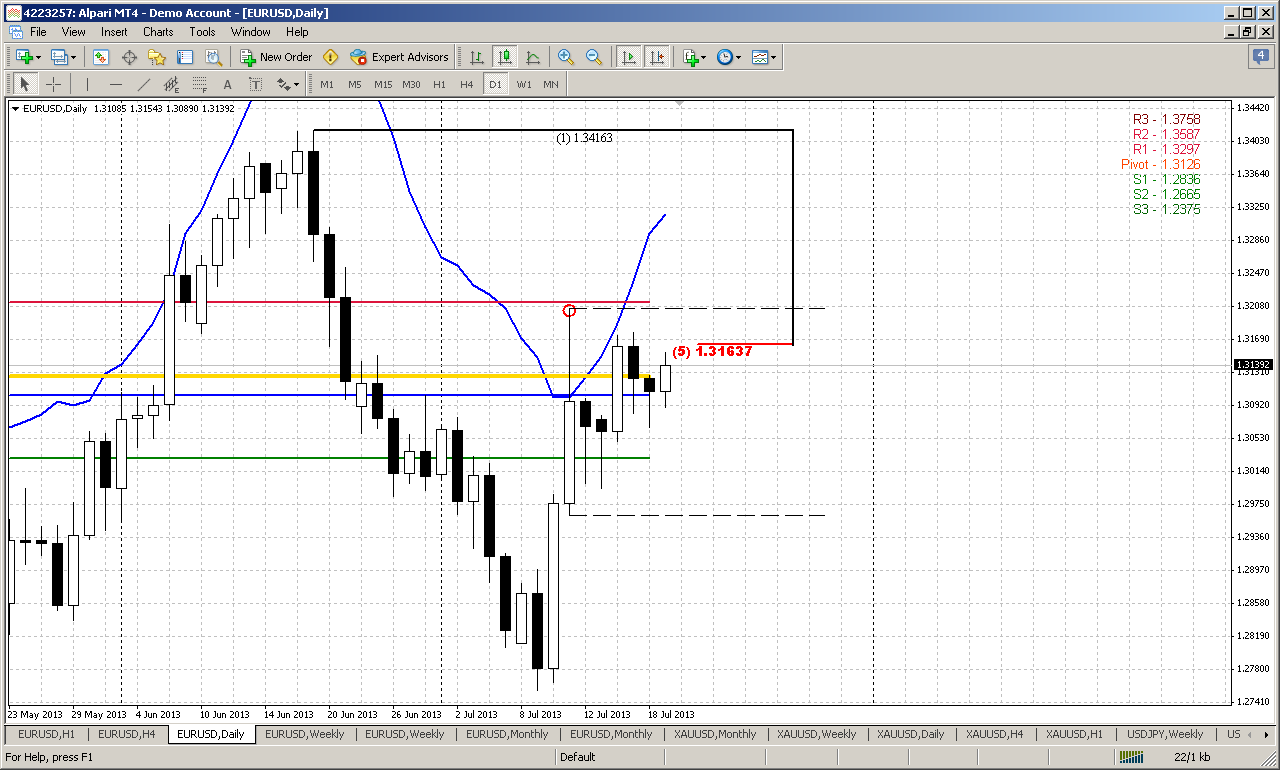
Since within 2 consecutive weeks market stands in the range, it’s not much what we can say here. The major moment is still the same - market has not shown due response to strong resistance – no reasonable retracement, nothing. As we’ve said on previous week, this adds points to bullish perspective, because as market does not show action that should follow by logical development in current situation, then it probably will show opposite move. Currently this idea was not vanished yet, since market confirms this intention by far. But this is sentiment analysis… Technically, future tendency will depend on breakout direction of long bar range here and on the hourly chart. The fact that market does not show any momentum yet makes analysis more difficult. As you can see on intraday charts, price movement reminds mostly gradual free flow rather than knowledgeable behavior.
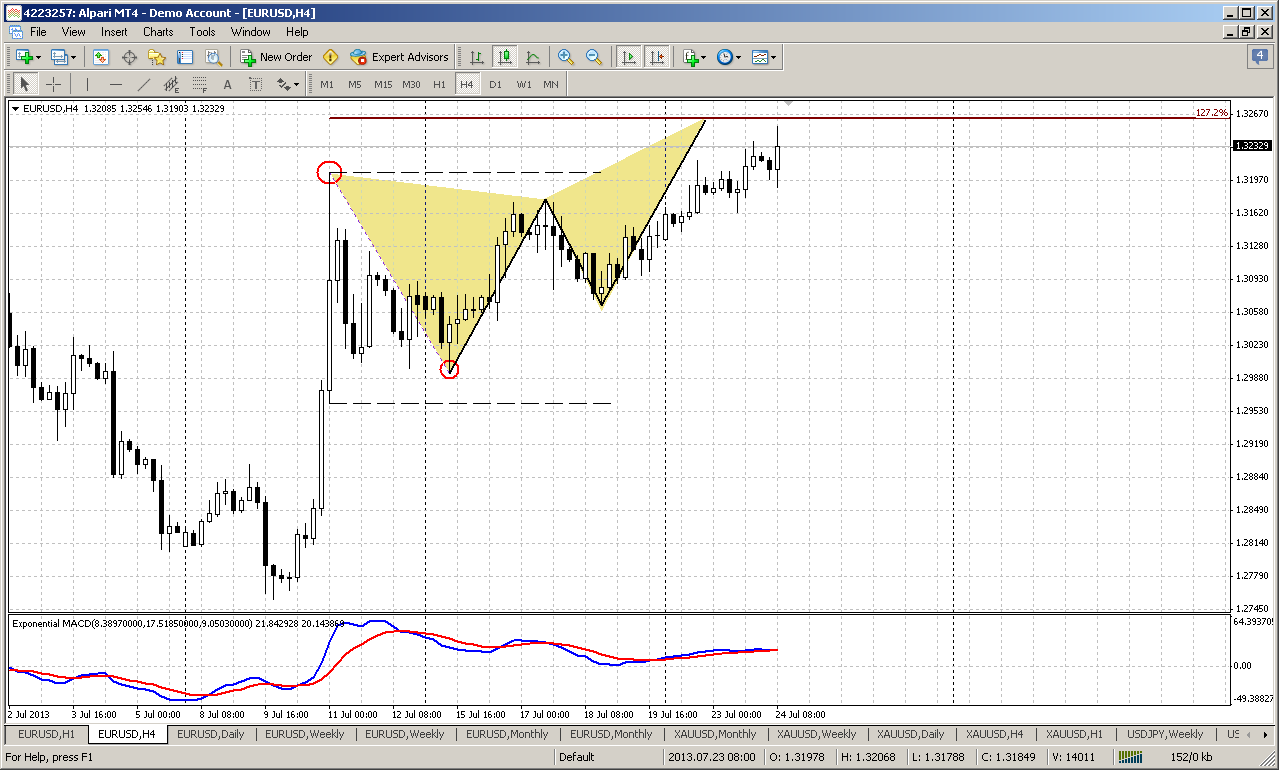
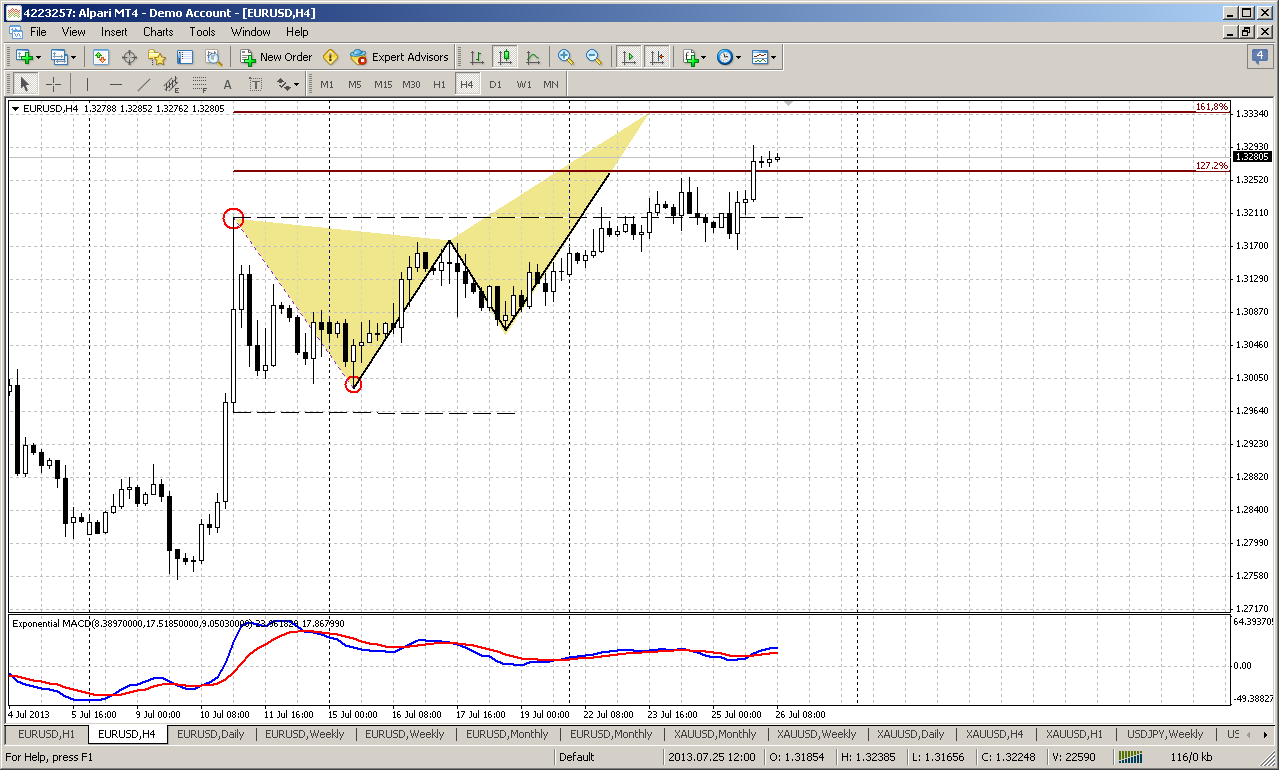
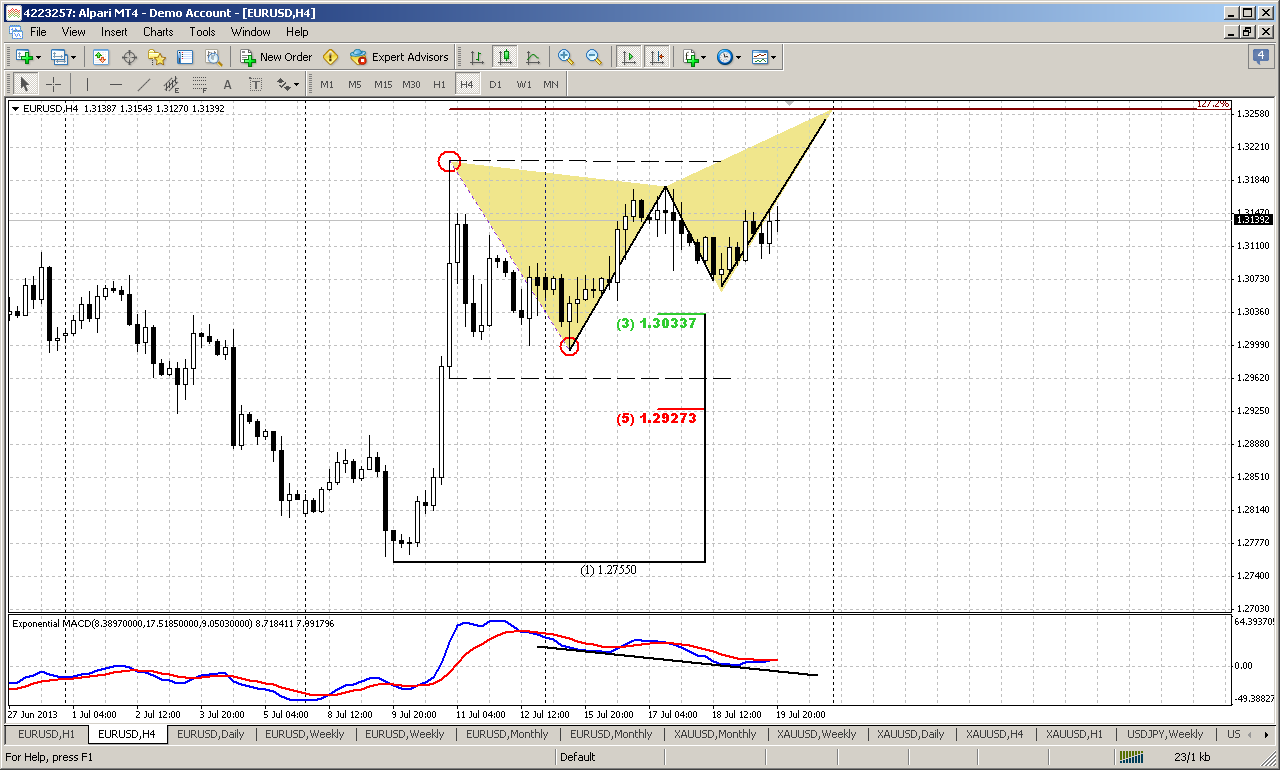
4-hour
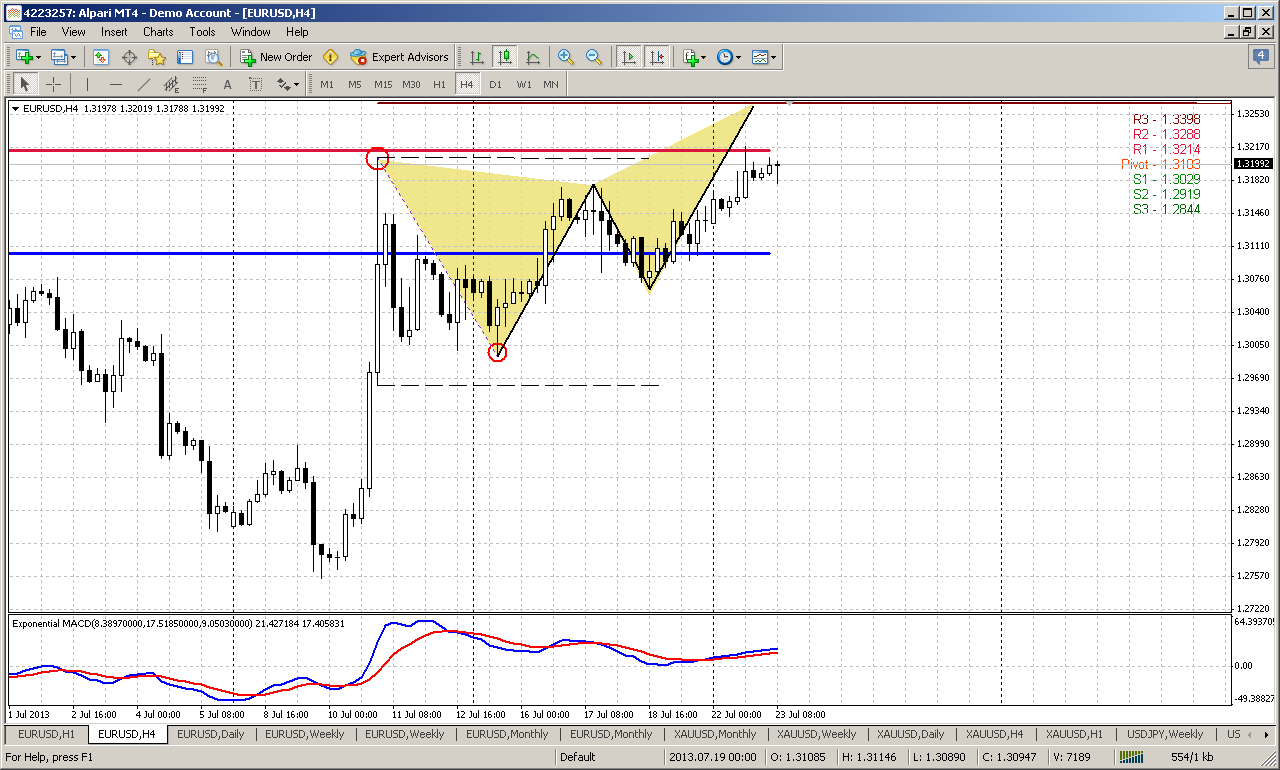
That’s our very-very short-term perspective, that could be a part on overall big puzzle. As market has shown just 4 new small candles here, I hold Friday analysis intact. The way how market behaves on intraday charts I suspect that this could be butterfly “Sell” with reaching MPR1 and erasing of bearish stop grabber on weekly chart. Daily overbought is not a barrier any more. After move up retracement was small – just 3/8, market has formed hidden bullish divergence here and has shifted trend to bullish as well. So, it seems that we should be ready for some upward action, although I do not know how furious it will be.
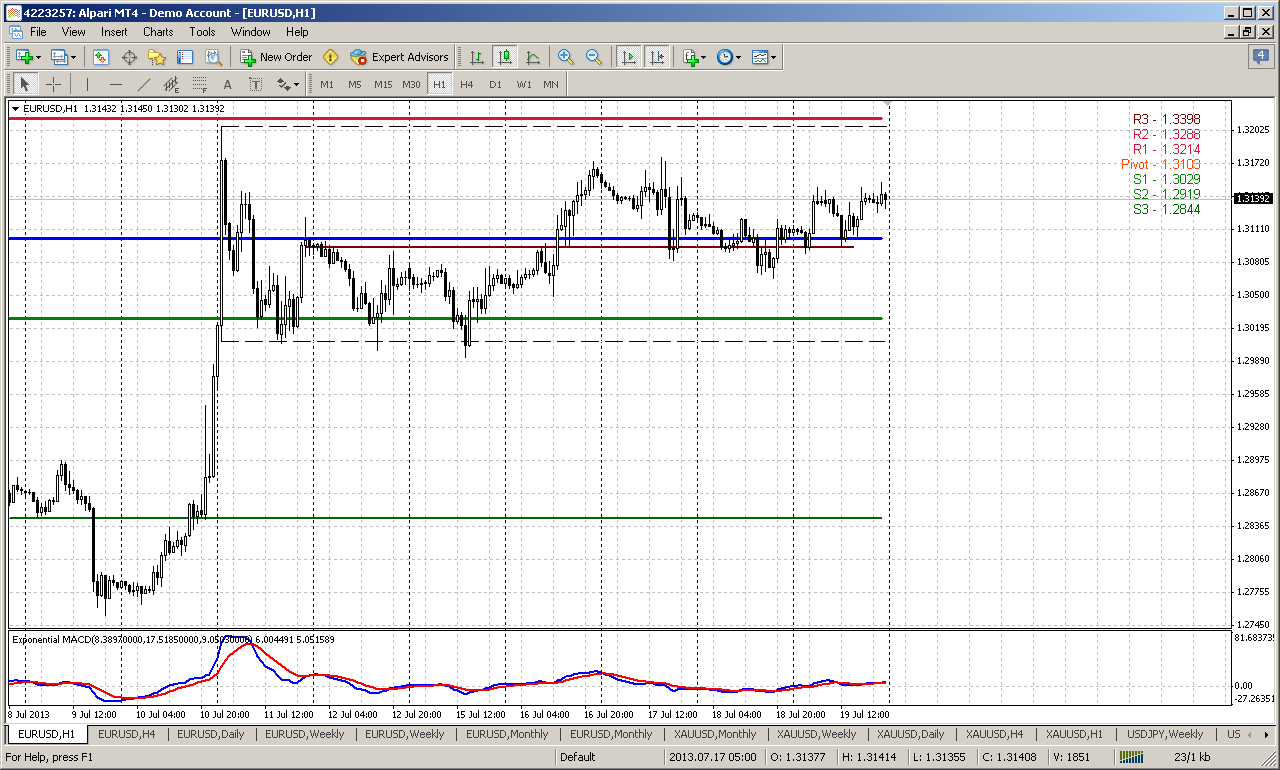
60-min
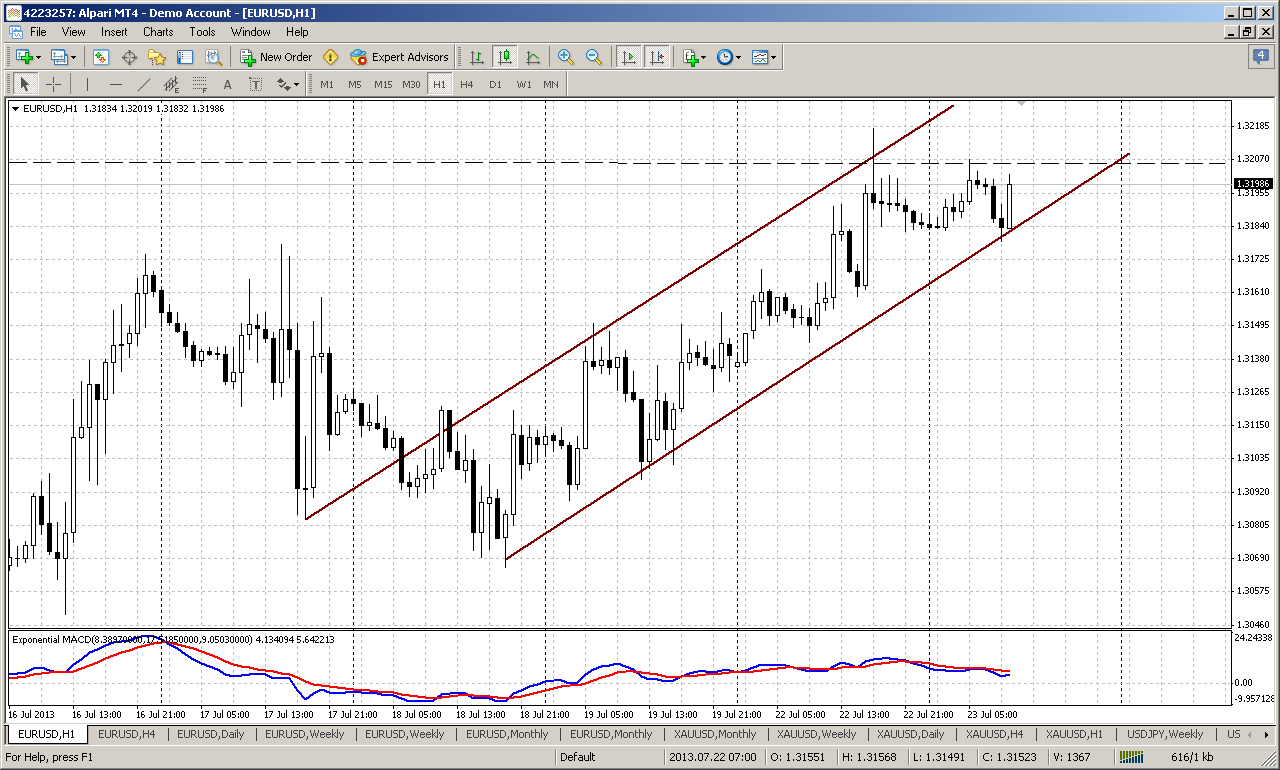
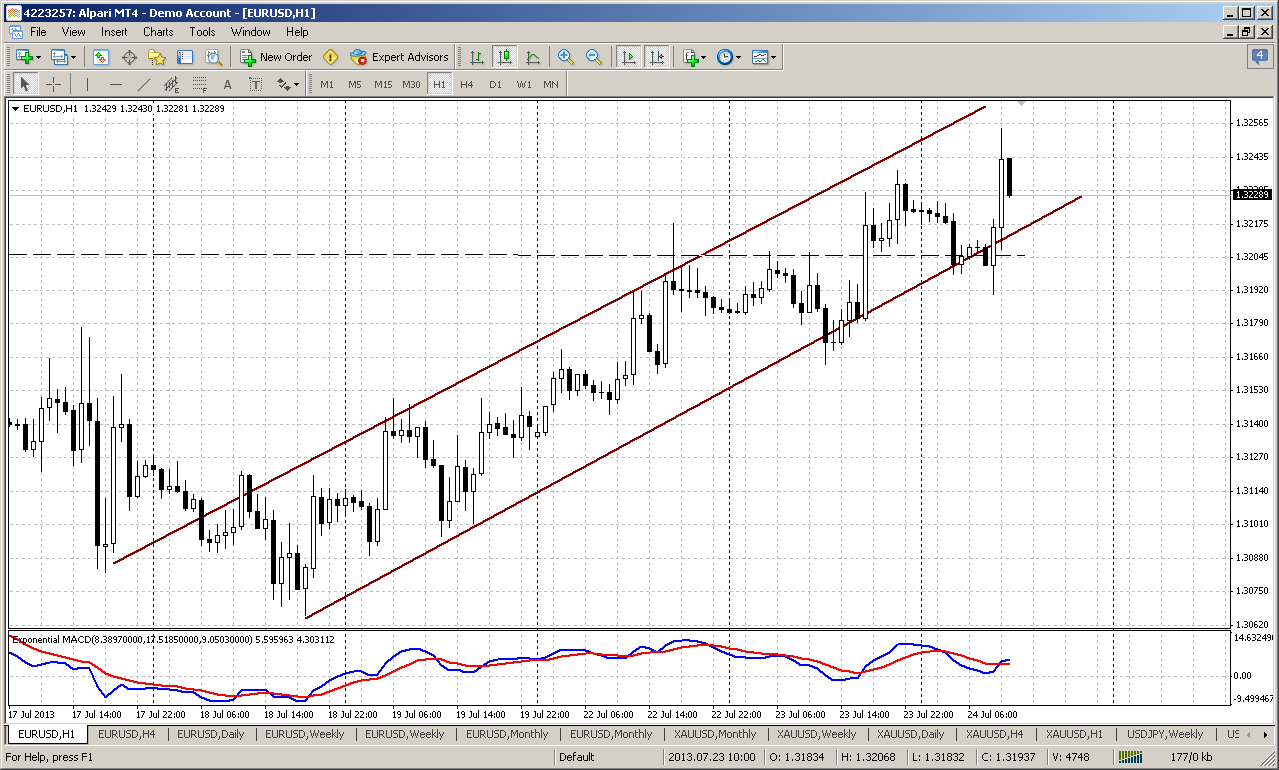
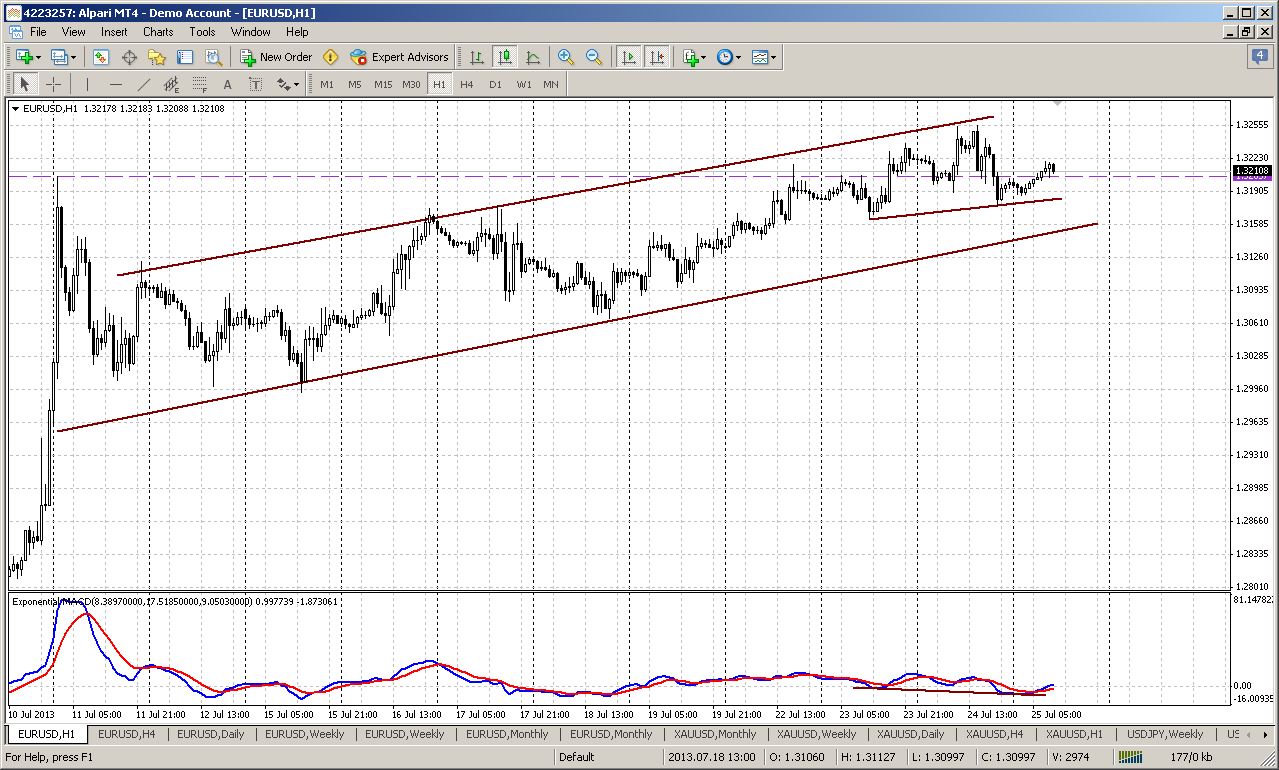
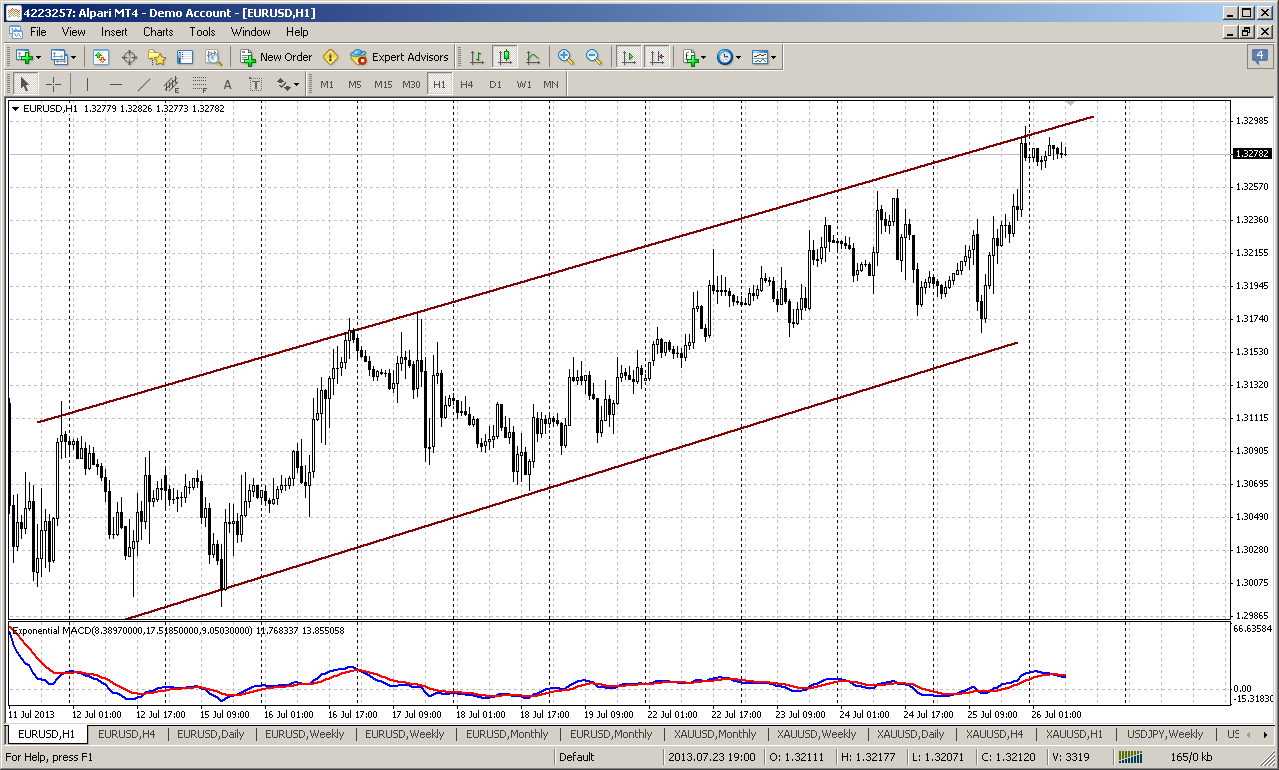
Picture here looks simple, but analysis here will be more sophisticated than on other time frames. Our major tool will be pivot points, since we do not have valuable Fib levels as market stands in the range. But pivots will give us solid assistance, because they coinside with natural support and resistance levels.
As you can see price still holds above support in the middle of the range. This support coincides now with WPP and marke probably will test it. To rely on butterfly and be sure that sentiment is still bullish – we need to see that market will hold above this area again. May be this an area where we should try to enter long. At least I do not see any other leads here how we can enter. If we will get lucky and market finally will start move up – second checkpoint is WPR1. We need to see it been broken by price action. This will confirm that current move up is not just fluctuations and give us confidence with further upward perspectives on weekly time frame. Theoretically stop should be placed below 1.2990 lows, since this is invalidation point of butterfly and WPS1. But for some of you this stop could be too far.
Conclusion:
Currently on different time frames across the board some bullish hints are started to appear. They are blur and not obvious but they are visible. We probably stand at the eve of clarification moment that could happen very soon and may be on coming week. If market will show action as we’ve described in hourly chart, then it could a triggering point for medium term upward development. At least currently is very dangerous to hold shorts. As “3-period rule” suggests: if market has not started move that you expect to see within 3 periods – close position. We didn’t get downward development within 3 days although context was nice for it. Thus, this tells that something is hidden under at first glance calm and choppy action on EUR.
The technical portion of Sive's analysis owes a great deal to Joe DiNapoli's methods, and uses a number of Joe's proprietary indicators. Please note that Sive's analysis is his own view of the market and is not endorsed by Joe DiNapoli or any related companies.
On monthly chart we do not see significant move during previous week, but still, overall action here looks significant. Although by now price movements look mostly as indecision, since market stands in tight range of flag consolidation and has formed two opposite candles with symmetrical oposite breakouts of the flag. Current failure downward breakout is more significant, because it shows that previous bullish trap has not worked and take a look where this has happened – right at yearly pivot point and 50% Fib support. Now market gradually moves to the upper border of the flag and the major drama will be played around it.
Although monthly chart right now can’t help us much in day-by-day trading, since until price stands it 1.29-1.33 range we can rely only on lower time frames and search patterns and context for trading here. Monthly chart could give us a signal or direction only when price will out of this range.
When this will happen targets to the downside remain the same – minimum target stands the same area around Yearly Pivot support 1 and preavious lows 1.2150-1.23. Potentially this probably will trigger downward action by huge AB=CD pattern that has minor 0.618 target and will challenge 1.1875 lows around all time major 50% support.
If market will continue move up, then it could lead to appearing of AB=CD pattern and challenging of yearly pivot resistance 1 area.
Still by current action here, it seems that advantage on the bull side, because bearish fake breakout has not worked and market has not continued move down. Even more, price slowly but creeping and creeping higher.
Weekly
Well guys, weekly chart could become a real bomb in a medium-term perspective. But first, let’s take a look at picture that we get over to. I hope that everybody remember H&S pattern on weekly, and when we’ve discussed the reliability of this pattern, we’ve said – yes, may be it is too obvious and usually that patterns rare work, but we will not trade particular weekly H&S, since it’s big, we will try to get direction from it, but trade on lower time frames. Until neckline situation has developed perfectly, but now something is go out from whack. Market has reached significant support around neck line and 0.618 AB-CD pattern that is based on head and right shoulder.
But now, take a look – we have two opposite patterns. First is huge bullish engulfing and second is – bearish stop grabber. Although I do not like grabbers of this kind very much, since it stands opposite to the trend, but still – this is the pattern and it has not been cancelled yet. So, what bet would you place here – to the upside or to the downside?
We have to say, that looks like enguling pattern is working by far. Although passed week was an inside one, but trend has turned bullish, market closed higher than on previous week and what is mostly important – we’ve got close above MPP.
And now, guys, watch this:
Let’s discuss this picture. First of all, market is forming here widening triangle, aka megaphone, and now price stands with 5th wave inside of it. Sometimes flat exit from triangles happens, but in most cases market will either show breakout to the uspide or fail to reach previous top and turn to the downside. Current low stands slightly higher than previous one and this keeps road open for appearing of butterfly “sell” with ultimate target round 1.43 area. Somewhere around stands objective point of AB=CD pattern either. What is significant that this possible scenario ergonomically links with monthly perspectives of possible upward action, especially close above MPP and hit over obviousness of H&S pattern by shifting it to H&S failure. That is also logical, since obvious patterns rare works. Will see, but this significantly renovate overall action on EUR and gives absolutely different picture. Now we just have to educe signs of this potential move and control it’s normal development.
Daily
Since within 2 consecutive weeks market stands in the range, it’s not much what we can say here. The major moment is still the same - market has not shown due response to strong resistance – no reasonable retracement, nothing. As we’ve said on previous week, this adds points to bullish perspective, because as market does not show action that should follow by logical development in current situation, then it probably will show opposite move. Currently this idea was not vanished yet, since market confirms this intention by far. But this is sentiment analysis… Technically, future tendency will depend on breakout direction of long bar range here and on the hourly chart. The fact that market does not show any momentum yet makes analysis more difficult. As you can see on intraday charts, price movement reminds mostly gradual free flow rather than knowledgeable behavior.
4-hour
That’s our very-very short-term perspective, that could be a part on overall big puzzle. As market has shown just 4 new small candles here, I hold Friday analysis intact. The way how market behaves on intraday charts I suspect that this could be butterfly “Sell” with reaching MPR1 and erasing of bearish stop grabber on weekly chart. Daily overbought is not a barrier any more. After move up retracement was small – just 3/8, market has formed hidden bullish divergence here and has shifted trend to bullish as well. So, it seems that we should be ready for some upward action, although I do not know how furious it will be.
60-min
Picture here looks simple, but analysis here will be more sophisticated than on other time frames. Our major tool will be pivot points, since we do not have valuable Fib levels as market stands in the range. But pivots will give us solid assistance, because they coinside with natural support and resistance levels.
As you can see price still holds above support in the middle of the range. This support coincides now with WPP and marke probably will test it. To rely on butterfly and be sure that sentiment is still bullish – we need to see that market will hold above this area again. May be this an area where we should try to enter long. At least I do not see any other leads here how we can enter. If we will get lucky and market finally will start move up – second checkpoint is WPR1. We need to see it been broken by price action. This will confirm that current move up is not just fluctuations and give us confidence with further upward perspectives on weekly time frame. Theoretically stop should be placed below 1.2990 lows, since this is invalidation point of butterfly and WPS1. But for some of you this stop could be too far.
Conclusion:
Currently on different time frames across the board some bullish hints are started to appear. They are blur and not obvious but they are visible. We probably stand at the eve of clarification moment that could happen very soon and may be on coming week. If market will show action as we’ve described in hourly chart, then it could a triggering point for medium term upward development. At least currently is very dangerous to hold shorts. As “3-period rule” suggests: if market has not started move that you expect to see within 3 periods – close position. We didn’t get downward development within 3 days although context was nice for it. Thus, this tells that something is hidden under at first glance calm and choppy action on EUR.
The technical portion of Sive's analysis owes a great deal to Joe DiNapoli's methods, and uses a number of Joe's proprietary indicators. Please note that Sive's analysis is his own view of the market and is not endorsed by Joe DiNapoli or any related companies.